269 WAS THEREA CREDIT CRUNCHIN NAMIBIABETWEEN 1996-2000?
WAS THERE A CREDIT CRUNCH IN NAMIBIA
BETWEEN 1996-2000?
S
YLVANUSI
KHIDE*Research Department, Bank of Namibia Submitted February 2003; accepted August 2003
Commercial bank credit is a useful tool for promoting economic growth especially at the early stages of development. It has been observed that between 1996 and the early part of 2000, the growth rate of real credit to the private sector declined significantly in Namibia. This period coincided with observed strong demand for commercial bank loans. There has therefore been public discourse on the possibility of a restriction in the supply of credit by commercial banks and hence the occurrence of a credit crunch in the economy since commercial bank lending capacity did not fall. This paper attempts to provide some evidence in this regard by examining the main determinants of commercial bank credit in the economy and ascertaining if credit has been demand or supply constrained. This has been done through a survey of disaggregated data in the banking industry and an estimation of a switching regression model to identify regimes of excess supply and demand. Although it is difficult to determine in the face of obvious demand factors the extent to which the credit slowdown can be attributed to credit supply factors, our results show that supply factors did play a major role.
JEL classification codes: E51
Key words: Africa, Namibia, credit crunch, asymmetric information, economic growth
I. Introduction
The availability of credit is a major factor for the promotion of rapid economic growth. This derives from the importance of credit in consumption, investment and capital formation. Production credit has been identified in a number of studies as a major constraint on speedy economic growth.1 Financial
* Dr. Sylvanus Ikhide was Reader in the Department of Economics at the Obafemi Awolowo University, Ile-Ife, Nigeria. Currently, he is economic adviser to the (Central) Bank of Namibia, Windhoek, Namibia. E-mail: [email protected].
institutions, particularly commercial banks, are considered very important in this process through their willingness to lend money. Traditionally, commercial banks in Africa finance mainly firms’ working capital and to a limited extent, leasing finance for machinery. Rarely do they directly finance investment in plant and machinery, buildings and research and development. And yet, productive credit is indispensable particularly for small and medium scale firms. The results of a survey in the mining and manufacturing sectors in South Africa (Fielding, 2000) show that smaller firms suffer credit constraint. The same study posits that the shortage of formal sector credit to the private sector is a major factor in the poor investment performance in South Africa over the past decade. Elsewhere, the experience of bank-based financial systems typified by Japan and Germany and the newly-industrialising south-east Asian developing economies show that banks especially at the early stages of development are very crucial for financing productive enterprises (Mayer, 1988; Beck and Levine, 2000). On the other hand, the ability of business firms and other private sector operators’ to borrow is also considered crucial as this may impact on the pace and tempo of economic activity. Thus, in this regard, efforts are often geared towards identifying the factors that influence the demand for, and supply of, credit in the economy.
For quite sometime now, the Namibian economy has witnessed a substantial slowdown in credit growth. Real credit to the private sector more than halved between 1995 and 2000 falling from 15.72 per cent to 7.01 per cent. This situation tends to suggest that a credit crunch exist in the economy.2 The joint
occurrence of a decline in private sector credit and growing commercial banks net transfers to neighbouring South Africa has often led to the conclusion that domestic enterprises are not able to effectively utilise the available supply of credit in the economy.3, 4However, a slowdown in credit growth is not always
1 In an aggregative study for 10 SADC countries, (including Namibia), Allen and Ndikumana (2000) found credit to private sector positively related to real GDP growth.
2 In this study, we define a credit crunch as any leftward shift in the supply curve of credit, which could be demand or supply driven. This enables us to investigate the causative factors.
3 Namibia, Lesotho, Swaziland, and South Africa belong to the Common Monetary Area (CMA).
4 All but one of the five commercial banks in Namibia are branches of banks with head offices in South Africa.
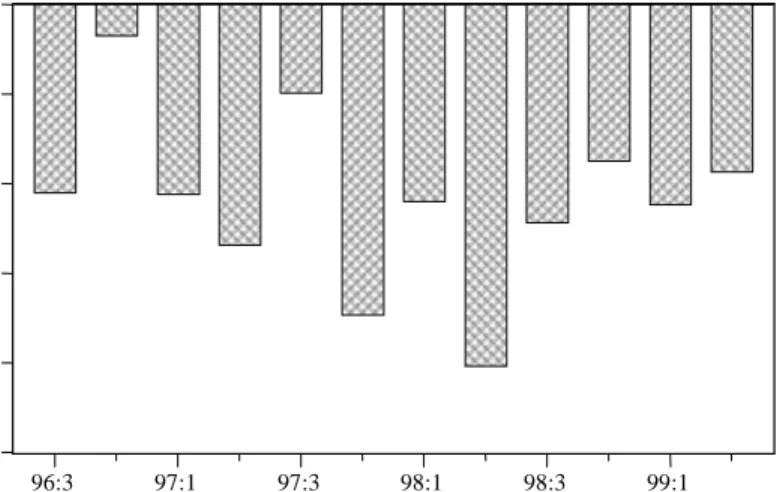
symptomatic of a demand driven credit crunch. The slowdown could be supply driven. Similarly, the occurrence of net transfers by commercial banks in the face of dwindling domestic supply of credit may not be explained sufficiently by a lack of demand. Figure 1 shows the extent of these transfers between 1996 and 2000. What is disturbing about this transfer is that even for periods when domestic lending rates are high, and domestic demand has not slowed down, such net transfers have persisted.
5 Redlining is said to occur when some categories of borrowers are totally excluded from the credit market.
-1000 -800 -600 -400 -200 0 96:3 97:1 97:3 98:1 98:3 99:1 N$ million
Figure 1. Commercial Banks Net Transfers to South Africa (NTRS)
Given that lending rates in South Africa are for most of the period lower than in Namibia, other factors like the need for commercial banks to avoid perceived credit risks as well as the possibility of the occurrence of “redlining” could have been at play during this period.5 Thus the objective of this work is
to examine whether a supply constrained credit crunch actually existed in the Namibian economy during the period 1996-2000.
This study is divided into five parts. Section II examines major macroeconomic and credit trends while in Section III a review of some of the theoretical issues, which we consider pertinent for the behaviour of commercial
bank lending in a developing economy framework, is attempted. In Section IV, a switching regression model of the demand for and supply of commercial bank loans is estimated using quarterly data for the period 1993-2002. This model in addition to shedding some light on the main determinants of credit, enables us to capture regimes of excess supply and demand in the economy. Finally in section V, we summarise our main conclusions.
II. Major Macroeconomic and Credit Trends
With a per capita income of approximately US$1,800 and an annual real GDP growth rate of about 3 % (1990-99), Namibia is ranked as one of the fastest growing countries in Africa. Its gross national savings estimated at about 18.8 % of GDP outstrip the gross domestic investment of 16.0 %. Coupled with a positive current account surplus, which hit about 5 % of GDP in 1999, Namibia is also an exception among African countries in having an excess of savings over investment as well as a surplus in the current account. The major economic activities are mining, which accounts for close to 24 % of GDP and 70 % of export earnings, agriculture which supports directly or indirectly about 70 % of the nation’s population, and accounts for close to 12 % of exports consisting mainly of cattle and fisheries, and a growing manufacturing sector. Over the years, efforts have been made to ensure that the level of fiscal deficits, which has orbited between 1.1 and 6.1 %, is kept relatively low. Currently, the deficit stands at about 3.6 %.
Inflation levels in Namibia have generally followed a downward trend falling from a high of 11.9 % in 1991 to 7.9 % in 1998. With the increase in oil prices in 1999, the introduction of the value added tax (VAT) in 2000, and the sharp depreciation of the exchange rate in 2001, the inflation rate started rising again, reaching a high of 10.8 % in the first quarter of 2002. This will be the first double-digit average annual inflation recorded since 1996.
Interest rates in Namibia generally monitor the rates in South Africa, which between 1999 and 2000 witnessed a general downward trend. Although real lending rates have remained positive, real deposit rates in recent times have become negative partly due to the low level of interest rates charged by commercial banks on deposits. Of major concern therefore in Namibia is the
spread between lending and deposit rates which is attributable to the lack of competition in the nation’s financial system.
In Namibia, bank credit account for close to 85 % of total (formal) domestic credit to the private sector. Commercial bank credit to the private sector has grown substantially since 1990, but the growth rate slowed down considerably since 1996. Real credit to the private sector grew at an annual average rate of 17.8 % between 1991 and 1995.6 However, between 1996 and 2000 it fell to
3.14 %. The slowdown in the growth rate of domestic credit during the second half is often attributed to the tight monetary policy stance adopted by many emerging markets central banks, especially after the Asian financial crisis of 1997/98 and the expansion of the financial markets.
However, a careful examination of disaggregated data on commercial bank credit tends to establish that these factors may not have sufficiently explained the slowdown in credit supply during this period. Other factors such as commercial bank risk-averse behaviour could have featured prominently. For instance, it is observed that episodes of declines in the supply of credit have co-existed with periods of increasing real interest rates. Through the period 1996 to 1998, interest rates were on the increase and the demand for credit did not fall, yet the growth in the supply of credit declined persistently. Credit outstanding declined by 4.2 % during this period for reasons that cannot be fully attributed to demand.
Moreover, there are evidence that point to increased risk aversion by banks particularly since the middle of 1998, which go to confirm that banks were deliberately restraining lending during the period. First, we observed a decline in risk weighted assets to total assets from 76 % to 66 % between 1998 and 2001. The risk-weighted assets of banks consist essentially of their loans. Second, the share of overdrafts in total bank lending also declined from 42 % to about 30 % over the period as banks have tended to exercise more control over their lending. This becomes more evident when it is realised that collateralised lending has been on the increase during this period. Collateralised lending as a ratio of total loans rose from about 20 % to 26 % between 1997 and 2001.
6 Even if allowance is made for the outlier growth of 32.3 % in 1991, the growth rate of 14.17 % recorded between 1992-95 is still outstanding.
Finally, there was a tendency for average lending rates to move in closer tandem with prime rates in recent times, suggesting that banks have increasingly shifted their lending to relatively safe customers.7 The close
movement in the two rates which was discernible prior to the introduction of regulatory sanctions early in 1997 is being re-enacted again particularly since 1999.
III. Theoretical Underpinnings of Commercial Bank Lending
Behaviour in Namibia
The traditional thinking on the relationship between interest rates, the supply of credit by commercial banks and economic growth is rooted in the loanable funds theory. According to this theory, the demand for loanable funds is assumed to be a declining function of the interest rate while the supply by banks is an increasing function. There is therefore an equilibrium interest rate at which the demand for loanable funds by firms is exactly equal to the supply by banks and other financial institutions and the market is cleared. Thus, it is expected that as interest rates on loans fall, the demand for investible funds should rise. Until recently this conventional market clearing analysis has remained the foundation for most theoretical and empirical deduction on the relationship between credit and interest rates. Two main considerations make this simplistic approach to the interest rate-credit-investment link rather inadequate for many developing countries. First is the assumption that a fall in the rate of interest will lead to an increase in the demand for loans by investors. Doubts have been expressed as to whether bank credit necessarily constitutes the basis on which investment is undertaken in developing countries given the low level of financial development. Second, for various reasons,
7 Each of these arguments should be taken alongside the overall body of evidence provided in this paper. For instance, it is possible that the ratio of risk-weighted assets to total assets is declining due to a fall in demand for loans but granted that we have not been able to establish a decline in demand for loans, this argument is not feasible. Second, the decline in the spread between average lending rate and the prime rate could be a result of the low interest rates that is being granted by banks on restructured loans with falling interest rates. Again, this will not be applicable in our case since falling interest rates were generally out of the question during this period except for the latter part of 2000.
the rate of interest may not equilibrate the demand and supply of commercial bank loans in which case commercial banks may have to ration the available credit using non-price means.
The finance of physical investment in plant and machinery is the main preserve of non-financial firms. The way by which these entities come by their funds has been a major source of debate for many years. What has emerged as a coalescence of views is that non-financial firms, particularly at the early stages of development, rely considerably on commercial banks as a source of start-up funds. This is more so in developing countries where the financial markets are at the early stages of development thus foreclosing the use of equity finance and retained earnings. Self-finance might be relatively low because of poor incomes. Thus the low level of financial development is actually a primordial reason for the use of bank credit for investment financing. In a similar vein, at the heart of the transmission mechanism is the discussion on how monetary impulses are transmitted to investment and output growth. The possibility of the effectiveness of a credit channel outside and independent of the interest rate channel gives further weight to the role of credit in the economy. Both the bank lending and broad credit channel (both sub-sets of the credit channel) agree that a tightening of monetary policy may cause the supply of bank loans to decline and initiate changes in the investment behaviour of small and large firms. Such changes, it is argued, could substantially affect investment and hence economic growth. The prevalence of evidence on the effectiveness of the credit channel as against the real interest rate channel in the transmission process of monetary policy, particularly in developing countries, again emphasise the role of the supply of credit in the growth equation of developing countries.8 Namibia’s membership of the CMA
substantially limits her ability to manipulate interest rates to achieve any expansionary monetary policy goal. In a recent work in the research department of the Bank of Namibia, it was found that the transmission from credit to the business sector to private investment, though occurs with a lag, is very strong (Ikhide and Uanguta, 2002).
8 This should not come as a surprise given the state of financial development in many developing countries and the dependence of the real interest rate channel on the efficacy of financial markets.
The second issue is very relevant for this study. The possibility that the rate of interest might not equilibrate the demand for and supply of credit raises the prospect that there might be genuine borrowers that may not have access to credit due to some form of rationing. Earlier, it was argued that the possible co-existence of high interest rates and decline in the supply of credit even in the face of a relatively stable demand might be indicative of a risk-averse behaviour by commercial banks. This may be evidence of the existence of a backward bending supply curve of loans by commercial banks for higher levels of interest rates. In this situation, the expected return on a loan is not a monotonic function of the nominal interest rate of the loan.
Stiglitz and Weiss (1981) attribute this phenomenon to adverse selection resulting from asymmetric information. Asymmetric information occurs because banks do not have information about each potential borrower’s investment project and therefore are not able to calculate the project’s riskiness since they do not know the probability distribution of returns on the projects. But the borrowers do have more information about the project and are able to calculate the risk and expected returns on the project better than the banks. Adverse selection sets in because at high interest rates enterprises with relatively low risk projects decide not to borrow while risky enterprises will attempt to borrow at the high interest rate. At high interest rates, only enterprises with high expected returns (high risks) on their projects will wish to borrow. Thus at high interest rates, the proportion of high-risk projects in the bank’s total lending portfolio is greater than at low interest rates. The increase in interest rates will have two opposing effects on the expected value of banks’ returns. First is the direct effect of the interest rate increase for a given population of borrowing firms which increases the banks expected returns and produces higher revenue and second, the indirect effect which changes the risk of this population (Freixas and Rochet, 1999). The latter effect reduces expected returns because a higher interest rate causes the bank to have a greater proportion of its loans invested in risky projects. Beyond a certain level of interest rate, the indirect effect of an increase in interest rate is greater than the direct effect. The existence of adverse selection explains why banks are not willing to charge higher interest rates and hence the interest rate on bank credit may be less than the interest rates that would equate the demand and supply of credit leading to credit rationing.
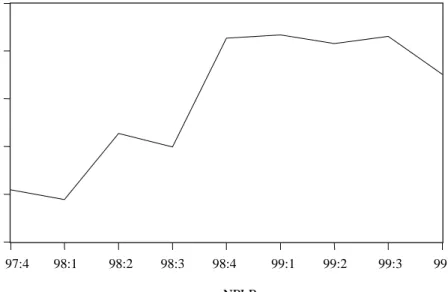
The financial crisis of late 1997 which exacerbated an upward rise in lending rates may have generated some adverse selection problems as only individuals and firms who are willing to increase their returns or refinance their debts borrowed at the higher interest rates. This had the effect of increasing the share of risky or insolvent clients among borrowers. The sharp rise in non-performing loans to total loans between 1997.2 to 1999.2 will tend to confirm this.
Figure 2. Non-performing Loans as a Ratio of Total Credit to the Private Sector (NPLR %)
Credit rationing may also occur due to the non-price elements of a loan contract such as collateral requirements (Baltensperger, 1976). Here a borrower is turned down not as a result of his inability to pay the rate of interest on the loan but because he does not have enough collateral to support his loan request. In a similar vein, credit is not a perfectly divisible good. A bank may be unwilling to lend to a borrower who is willing to borrow more at a given interest rate if this will increase the risk of the bank. In either case, some rationing occurs since the equilibrium interest rate ceases to be a linear function of the loan size.
14 12 10 8 6 4 97:4 98:1 98:2 98:3 98:4 99:1 99:2 99:3 99:4 NPLR
Finally, credit rationing also occurs when some categories of borrowers are totally excluded from the credit market. Commonly referred to as redlining, it occurs because borrowers do not have enough future cash flows or collateral to match their demand for credit. This may have been very relevant to the Namibian case. After the spurt in interest rates initiated by the financial crisis, and in the face of a lack of any form of credit rating system, banks had limited access particularly to new entrants to the credit market, and were thus unable to screen out risky borrowers.9
IV. Modelling the Supply and Demand for Credit in Namibia
So far we have tried to establish that there was a contraction in domestic credit in the second half of the last decade in Namibia. We have also provided some evidence that supply considerations on the part of banks may have played some role due mainly to perceived increase in the risk of default by borrowers. In this section we intend to provide more empirical evidence on whether the fall in bank credit resulted from supply or demand factors by modelling the demand and supply of commercial bank loans in the economy during the period under consideration.Several studies have adopted different approaches towards this end. Among others, Domac and Ferri (1999a), and Dollar and Hallward-Driemier (1998) used survey evidence on changes in bank lending and firm borrowing to assess the incidence of a credit crunch. The main shortcoming of the survey approach is that they can be seriously biased. For example, a tight monetary regime can reduce demand for credit and respondents may see this as lack of demand. Domac and Ferri (1999b) developed a conceptual framework based on the credit view of monetary policy to analyse the existence of a credit crunch in Indonesia, Malaysia, the Philippines, and Thailand. They argued that a
9 New entrants to the credit market included previously disadvantaged groups who were excluded (redlined) from the loans market through a policy of segregation that prevailed during the apartheid era. There are evidence of denial of access of blacks to opening of bank accounts and consequently to any form of credit during the apartheid era in Namibia and South Africa. See the report on Black Economic Empowerment Commission, Bee com South Africa (1999).
widening of the spread between the lending rate and a representative rate on risk-free assets while at the same time real bank credit is falling represents evidence that the demand for loans could not have declined by more than the supply of credit. Their results corroborated this view and thus concluded that credit crunch was widespread in these economies after the Asian crises affecting mostly small-sized firms. Agenor, Aizenman and Hoffmaister (2000) used a two-step econometric approach to elicit information on bank excess liquid asset on the existence of a credit crunch in some East Asian economies after the crises that befell those economies in the last decade. The first step involved the estimation of a demand function for excess liquid assets by commercial banks. In their second step, they established dynamic projections for the periods following the crisis and assessed whether or not residuals were large enough to be viewed as indicators of involuntary accumulation of excess reserves. This enabled them to draw conclusions on whether the credit crunch was demand or supply driven.
The approach by Ghosh and Ghosh (1999) using a switching regression framework to analyse the behaviour of real private credit in Korea and Indonesia has been slightly modified for our present study. In this approach, both supply and demand functions for credit are estimated. Thereafter, we determine whether supply or demand was the constraining factor. This approach enables us to identify the main determinants of the supply and demand for credit and in addition resolve the relative size of the demand and supply profiles for the period under investigation. Both issues have a number of policy implications. Identifying variables in the demand and supply process will enable policy makers to focus appropriate policy actions on such variables. On the other hand, the isolation for instance of a supply constrained credit growth may tend to suggest the need for structural measures such as regulatory changes or interventions by the central bank to remove the obstacles to growth. Thus, in this section we attempt to model the credit market in Namibia using a disequilibrium approach, which will enable us to identify regimes of excess supply and demand.
A. Model Formulation
number of variables among which are lending capacity, total deposits, the interest rate on loans, the level of economic activities in the country, and the level of prices. Lending capacity (Ct) defined as the difference between total commercial bank liabilities plus net worth adjusted for cash in vault, capital accounts and required reserves is expected to be positively related to the supply of credit (Ls
t). Commercial bank loans are made on the basis of their total
deposit (Dt). Other things equal, an increase in the level of deposits should lead to a rising level of loans by commercial banks. The average (nominal) lending rate (lt) denotes the profitability of bank’s lending activities. Thus this variable is expected to have a positive effect on the supply of credit by commercial banks. Finally, three variables are used as measures of the level of economic activities. The stock market index, (Mt), is used as a measure of the buoyancy of the economy and is positively linked to the supply of credit.10
The expected inflation rate, (ePt), is negatively related to the supply of credit as banks are supposed to be more cautious in lending in a high-inflation regime.11 We also tried expected real income, (eY
t),as a determinant of the
supply of loans in our estimation. The theoretical basis for this is that higher expected income is associated with lower moral hazard and default risks and lenders should therefore be expected to issue more loans as expected income
10 The use of the stock market index as a measure of the buoyancy of the economy may raise some eyebrows especially after our argument on the relative underdevelopment of the financial market. Our use of this variable stems from the very rapid growth of the Namibian stock market in the last decade. At present, it is the third most developed stock market in Africa going by stock market indicators like market capitalization, market turn over and stock market index. Namibia is classified as one of the most developed financial markets in Africa (See, “Promoting Sound, Accessible, Development Oriented Financial Sectors in Africa”, World Bank, 2000). Finally, most institutions listed on the Namibian Stock exchange are also listed on the larger Johannesburg Stock exchange. An increase in the level of economic activities on both exchanges could serve as an indication of productivity increase and hence stimulate the demand for credit.
11 The relationship between inflation and economic activity is sometimes questionable. For instance, the conventional, downward-sloping Phillips curve does not represent a fundamental relationship as this may change as policymakers’ beliefs about the economy change. Moreover, inflation may move up and down in response to shocks occurring in the economy which may not have been accommodated by the learning process which is presumed in the estimation of inflation (see, for instance, Bharat Trehan, 1999). However, we have used the inflation rate in this study for lack of a better variable.
rises. In an alternate regression, we also tried the spread between lending and deposit rates, lst, to test our argument on the existence of credit rationing (and hence a backward bending supply curve) in the economy. Thus the supply of credit is specified as follows:
Ls
t = α0 + α1 Dt + α2 lt + α3 Mt + α4 ePt + α5 Ct + α6 eYt (1)
Expected income (eYt), output gap, (Y_t), the real rate of interest (Rt), and the expected inflation rate (ePt) explain the real demand for credit (Ld
t). The
demand for credit is expected to depend negatively on the real rate of interest as bank business customers may be expected to delay investment when interest rates are rising. The inflation rate is used here as a proxy for general macroeconomic condition and is negatively related to the demand for credit.12
Expected decline in inflation may also affect credit demand by increasing the real cost of debt payments. This is the debt deflation phenomenon. Thus, it might be necessary to distinguish between expected and unexpected inflation. In our specification of the demand equation, we have included unexpected inflation (uPt) computed as the difference between actual and expected inflation as one of the explanatory variables.
Expected income is expected to affect credit demand positively. The inclusion of the output gap (Y_t) as additional explanatory variable is intended to gauge the impact of deviations of output from its long-term trend as measured by expected income. The inclusion of this output gap may help to proxy the demand for credit during periods of falling income. The argument here is that during falling incomes, firms may seek greater credit financing to maintain their level of production. Hence, estimated demand for credit does not fall simply because of a shrinking output. Inclusion of only expected
12 The exact relationship between the level of prices and the demand for credit has been a source of confusion in empirical works. Pazarbasioglu (1997) argues that a higher rate of inflation would erode the value of nominal debt and will thus be positively related to the demand for credit. Ghosh and Ghosh (1999) however argue that periods of rising prices connote general macroeconomic instability and will tend to discourage the demand for credit. Moreover, rising prices reduces the real value of borrowers’ income and hence discourages credit demand. In this analysis we adopt the latter view, as this is more likely to be the situation in a developing economy.
income will tend to bias the results against finding a credit crunch since estimated credit demand would, as a matter of fact, fall with the decline in the output level. The demand for credit is specified as,
Ld
t = β0 + β1Y_ t + β2 eYt + β3 lt + β4 Pt + β5 uPt (2)
The expected change in output is calculated as the fitted value of a regression of actual GDP on its past values and changes in the stock market index. The idea here is to capture forward-looking expectations of the level of economic activity on current credit demand. All variables except the interest rate are estimated in their log-linear forms. To remove seasonal effects, the variables were all deseasonalized prior to the tests for stationarity and subsequent estimation.
B. Estimation Method
A fall in actual credit (Lt) could be attributed to a falling supply of credit, (Ls
t), falling demand for credit, (L d
t), or both. There is a key identification
problem here in attributing the observed changes in actual private sector credit to underlying movements of the credit supply or credit demand function. This identification problem is tackled by using a switching regression framework. We can rewrite equations 1 and 2 as
Ls
t = α X1t + u1t, u1t ~ N(0, ó11), (3)
Ld
t = β X2t + u2t, u2t ~ N(0,ó00), (4)
where, corr (u1t, u2t) = ñ10, X1 and X2 are vectors of exogenous variables, and u1t and u2t are residuals.
If we assume that the market for bank loans clears instantaneously, the interest rate equilibrates the demand for and supply of credit. However, as argued earlier, interest rates may not adjust instantaneously and some amount of credit rationing may occur. The demand for credit need not equal its supply as some disequilibrium exists. The (observed) actual level of credit is approximated by the expression,
Lt = min (Ls t, L
d
t) (5)
In the absence of sufficient information on the price adjustment process, and assuming that the errors are normally distributed random variables, the model itself allows the determination of the probabilities with which each observation belongs to the demand or supply regime. In an exogenous switching model (Maddala, 1983), separation into one regime or the other is determined outside the structure of the model. Two possible cases are the observed separation indicators where there exists an observed indicator variable S which equals 1 if regime 1 applies and 0 if regime 0 applies. The other is when there exists no separation indicator; it is known which regime applies for a given observation. In a model of endogenous switching, there would be a supplementary equation for the separation indicator thus;
S* = ùZ + î, (6)
S = 1 if S* > 0 and 0 otherwise.
corr(î, u1t) = ñ1; corr(î,u2t) = ñ0
This implies a stronger separation model and hence at any observation, only one regime is observed. Estimating these equations using 2SLS or MLE may ignore some information. 2SLS may be inefficient.13 The single equation
MLE each re-estimates ù, and hence ignores the fact that ù is being estimated twice, differently. FIML jointly estimates á, â, ó11, ó00, ñ1 and ñ0 and thus
enables us to overcome some of the shortcomings of 2SLS and MLE while overcoming the problem of identification.14 Using the Marquardt iterative
procedure, E-Views enables us to estimate the likelihood function under the assumption that the contemporaneous errors have a joint normal distribution. FIML is invariant to the equation that is dropped. This we have applied in this work based on quarterly data for the period 1993-2002.
13 2SLS assumes that there is no contemporaneous correlation in the error terms. 14 Since only one regression is observable at a given observation, ñ
10 would not be estimable even if it were assumed to be non-zero.
A slightly related issue in this estimation is the stationarity of the data used. In most of the models in this category, stationarity has not been explicitly addressed.15 In this study, although we tested for stationarity, we did not go
ahead to attempt an error correction modelling because of the small size of our data. However, like Ghosh and Ghosh (1999), we believe that estimation in levels could provide useful results as long as the determinants of credit supply and credit demand forms a cointegrating vector. This was tested in this model by checking whether the estimated credit demand, Ld
t, is
cointegrated with observed real credit, Lt (and, likewise, Ls
t is cointegrated
with Lt). Our results show that it is not possible to reject a unit root in all our variables during the period. Accordingly, the existence of a cointegrating relationship between the estimated credit demand (credit supply) and the actual real credit to the private sector (Lt) was tested (see Ghosh and Ghosh, 1999). The results show that the estimated demand and supply of credit are both cointegrated with the actual level of credit.
C. Empirical Results
The result of the FIML regression is presented in Table 1 below. The uniqueness of the estimation period lies in the fact that periods of rising real lending interest rates (1994.1 to 1998.2) and falling interest rates (1998.3 to 2002.1) are represented thus enabling us to further capture the impact of lending rates.
The demand for credit equation shows that real interest rate on lending, expected income, output gap and the inflation rate all affect the demand for credit. The real interest rate variable is negatively signed and weakly significant at the 10 % level suggesting that higher real interest rates are associated with lower credit demand. Expected income is positively related to the demand for credit and is significant at 1 %, with a coefficient that is strongly above unity. This variable appears to be the single most important determinant of the demand for credit. Output gap came out with a negative
15 Catao (1997) is an exception as his study actually utilizes an error correction modeling approach to capture both short-run and long run dynamics in the credit equation.
Table 1. FIML Regression Results
Demand function Supply function
Variable Estimation t-statistic Variable Estimation t-statistic
Constant -19.89 -9.234 Constant -0.909 -3.293 Rt -0.028 -3.152** Y t -0.591 1.501 Yt 2.421 10.859*** l t 0.014 2.974 ** Yt-1 -0.073 -1.820* M t 0.140 3.913 ** ePt -0.0289 -1.382 Ct 0.194 3.994** uPt 0.184 0.513 Dt 0.310 5.597*** ePt -0.005 -0.476 s.e. 0.069 s.e. 0.042 R2 0.91 R2 0.96 Log-likelihood 157.88 Log-likelihood 157.88
No. of obs. 40 No. of obs. 40
Notes: *, **, *** significant at 10, 5 and 1 % level, respectively.
sign, though significant. This will tend to demonstrate that firms seek less credit during falling output thus emphasising the importance of demand factors in the credit equation. Unexpected inflation was not significant in the credit demand equation. This may be explained by the fact that firms were able to predict accurately the trends in inflationary expectations and built this into their demand for credit position.
The credit supply function shows that the bank’s lending capacity has the expected positive sign and is significant at 1 % level. Average lending rate is positively correlated with credit supply and is significant at 5 % level. Stock market index effectively captures optimistic business expectations and economic buoyancy as this is positively linked with credit supply.16 The
16 This did not come to us as a surprise given the integration of the Namibian and South African capital markets. South Africa has well developed, well diversified and soundly regulated capital market. She is also highly integrated into the global financial market.
expected inflation variable is negatively signed though insignificant. Inflation may not have been a major consideration in the decision to supply credit by commercial banks, though as a measure of economic stability, it is rightly signed. Total deposits are strongly correlated with the supply of credit confirming the fact that a major source of variation in bank lending is the volume and variability of deposits. In the alternate regression, the spread between lending and deposit rates came out with a negative sign (-0.018) and is significant at 1% level. Overall, the performance of the credit supply equation is satisfactory with the regressors explaining over 95 % of the change in the supply of credit. Although expected income came out with the right sign in the credit supply equation, it turned out to be insignificant.
We have plotted a simple graph of the estimated supply and demand functions in Figure 3. The extent of the supply and credit crunch can be inferred from the figure. A discernible pattern emerges from the figure. Between the period 1993:1 to 1994:3, the demand for credit predominantly outstripped the supply. However, for the period 1995.1 to 1998.2, the estimated supply and demand is very close with the supply outstripping demand for most of the period. From the third quarter of 1998 to the second quarter of 2001, we once again notice that the demand for credit outstrips the supply and thereafter, supply overtakes demand.
Generally, one can conclude that both demand and supply factors have been very relevant for the behaviour of credit in the Namibian economy. Specifically, for the period of our interest (1997:1 to 1998:4), we observed, however, that during periods of rising interest rates, actual credit (LRCPS) actually surpassed the estimated demand and supply of credit and the converse is the case during periods of falling interest rates. Eviews enabled us to generate a data dated table of the solved demand and supply equations of 1 and 2. The estimated supply and demand equations show that between 1998-2000, the demand for credit outstripped the supply (not reported). Finally, an interesting observation from our analysis is that throughout the period, both the actual credit observable and the estimated demand and supply consistently fell far below commercial bank’s lending capacity (LRCBLC) which increased during the period of analysis.
From the analysis thus far, it is obvious that commercial bank lending did take a dip in the second half of the 1990’s. It is difficult to completely ascribe
Figure 3. Estimated Demand (DL), Supply (SL) of Credit, Actual Credit (LRCPS) and Commercial Banks Lending Capacity (LRCBLC)
log of variables in N$m 4.4 4.2 4.0 3.8 3.6 3.4 3.2 3.0 93 94 95 96 97 98 99 00 01 02 SL LRCBLC DL LRCPS
the fall in total commercial bank loans to either demand or supply factors. Demand factors in the guise of high real interest rates and falling real incomes may have played some role in constraining credit expansion during the period. But from the results of the regression analysis and the anecdotal evidence from the disaggregated data, supply factors seemed to have also played a prominent role.
One possible cause of the supply-constrained phenomenon is the perception by banks of a high lending risk. The results from the regression analysis show that even though commercial banks are not sensitive to increases in lending rates, the spread between lending and deposit rates affect the supply of loans albeit in a perverse manner. The interest rate spread though significant came out with a negative sign. Increased spread should ordinarily cause increased supply of loans by commercial banks to enable them fulfil their profit maximisation objective. At higher level of interest rates, the risk of default increases. However, given a wide spread, commercial banks can maintain the same level of profitability through their interest income without increasing the level of credit made available. One reason why this is so in the case of
Namibia, is the low level of interest rates commercial banks charge on deposits. Under the circumstance, banks could reduce their loan supply without sacrificing their loan income since a compensating effect from the increased spread can be achieved.
A number of factors may have combined to increase bank’s perception of higher lending risks. First, there was the high leap in non-performing loans following the high interest rates regimes that came at the heels of the Asian crisis in 1997. Second, more stringent capital regulations were also introduced by the central bank at about this time in response to international regulatory requirements and the shattering performing loans. Increasing non-performing loans in the wake of the financial crisis, and a tightening of regulatory standards would have the combined effect of eroding banks capital base (Berger and Udell, 1994: Sharpe, 1995). Banks, it is argued, will respond to this by shrinking their risk weighted assets in order to boost capital adequacy ratios (Woo, 1999). A reduction in risk-weighted assets can be achieved with minimal effect on total bank assets by curtailing those assets with the highest risk weightings. Of the assets with the highest risk weighting, bank lending constitutes the largest component. This may have contributed to the observed reduction in commercial bank loans.
V. Conclusions
Commercial bank lending in Namibia took a downturn in the second half of the last decade. Although it is difficult to determine, in the face of obvious demand factors (rising real interest rate, falling real incomes etc), the extent to which the credit slowdown can be attributed to credit supply factors, this study shows that supply factors did play a major role. Thus, this study has attempted to provide evidence on the existence of a credit crunch in Namibia. The evidence in this study show that a major factor in the supply driven credit constraint is the perception by commercial banks of the existence of risks in lending. Commercial banks have thus tended to be very strict in the kind of loans they grant and who benefits from such loans. This may have given rise to the exclusion of marginal borrowers from the commercial bank loans market. The groups that unfortunately suffer most from such loan policies are the new entrants to the loans market. This group does not possess acceptable
collateral and even where they do, given their short history of existence in the commercial loans market, are often subject to more stringent scrutiny prior to any loan approvals.
References
Agenor, P., Aizenman., J., and A. Hoffmaister (2000), “The Credit Crunch in East Asia: What can Bank Excess Liquid Assets Tell Us?” Working Paper 7951, NBER.
Allen, D.S., and L. Ndikumana (2000), “Financial Intermediation and Economic Growth in Southern Africa,” Journal of African Economies 9 (2): 132-160.
Baltensperger, E. (1976), “The Borrower-lender Relationship, Competitive Equilibrium and the Theory of Hedonic Prices,” American Economic Review 66 (3): 401-405.
Beck, T., and R. Levine (2000), “New Firm Formation and Industry Growth: Does Having a Market-based or Bank-based System Matter?” Working Paper 2383, World Bank.
Berger, A.N., and G.F. Udell (1994), “Did Risk-based Capital Allocate Bank Credit and Cause a Credit Crunch in the US?” Journal of Money, Credit and Banking 26 (3): 585-628.
Bharat, T. (1999), “Economic Activity and Inflation,” Federal Reserve Bank of San Francisco: FRBSF Economic Letter, March.
Catao, L. (1997), “Bank Credit in Argentina in the Aftermath of the Mexican Crisis: Supply or Demand Constrained?” Working Paper WP/97/32, IMF. Dollar, D. and M. Hallward-Dreimeir (1998), “Crisis, Adjustment and Reform
in Thai Industry,” unpublished manuscript, World Bank.
Domac, I., and G. Ferri (1999a), “The Credit Crunch in East Asia: Evidence from Field Findings on Bank Behaviour and Policy Issues,” unpublished manuscript, World Bank.
Domac, I., and G. Ferri (1999b), “Did Financial Shocks Disproportionately Hit Small Businesses in Asia?: Evidence from Malaysia and the Republic of Korea,” unpublished manuscript, World Bank.
Fielding, D. (2000), “Investment under Credit Rationing and Uncertainty: Evidence from South Africa,” Journal of African Economies 9: 189-212.
Freixas, X., and J. Rochet (1999), Microeconomics of Banking, Cambridge, Massachusetts, MIT Press.
Fry, M. (1988), Money, Interest, and Banking in Economic Development, Baltimore and London, John Hopkins University Press.
Ghosh, S., and A.R. Ghosh (1999), East Asia in the Aftermath: Was there a Credit Crunch? Working Paper WP/99/38, IMF.
Hossain, A., and A. Chowdhury (1998), Open-Economy Macroeconomics for Developing Countries, Edward Elgar Cheltenham, UK.
Ikhide, S., and E. Uanguta (2002), “The Transmission Mechanism of Monetary Policy in Namibia,” Bank of Namibia, Working Paper Series 4.
Maddala, G.S. (1983), Limited-Dependent and Qualitative Variables in Econometrics, New York, Cambridge University.
Mayer, C. (1988), “New Issues in Corporate Finance,” European Economic Review 32: 1167-89.
Pazarbasioglu, C. (1997), “A Credit Crunch? Finland in the Aftermath of the Banking Crisis,” IMF Staff Papers 44 (3).
Sharpe, S.A. (1995), “Bank Capitalization, Regulations, and the Credit Crunch: A Critical Review of the Research Findings,” Finance and Economics Discussion Series, Federal Reserve Board.
Stiglitz, J., and A. Weiss (1981), “Credit Rationing in Markets with Imperfect Information,” American Economic Review 71: 393-410.
Woo, D. (1999), “In Search of Capital Crunch: Supply Factors Behind the Credit Slowdown in Japan,” Working Paper WP/99/3, IMF.
World Bank (2000), “Promoting Sound, Accessible, Development Oriented Financial Sectors in Africa. An African Region Strategy,” World Bank, Washington DC.