ACCEPTED MANUSCRIPT
Highlights
• Structural Features for Classification
• Evolutionary Features for Classification
• Effective Prediction
ACCEPTED MANUSCRIPT
EvoStruct-Sub: An Accurate Gram-positive Protein
Subcellular Localization Predictor Using Evolutionary
and Structural Features
Md. Raihan Uddin1, Alok Sharma2,3,5, Dewan Md Farid1, Md. Mahmudur
Rahman4, Abdollah Dehzangi4,∗ and Swakkhar Shatabda1,∗
1Department of Computer Science and Engineering, United International University, Bangladesh
2School of Engineering and Physics, University of the South Pacific, Fiji 3Institute for Integrated and Intelligent Systems, Griffith University, Australia
4Department of Computer Science, Morgan State University, United States 5RIKEN Center for Integrative Medical Sciences, Yokohama, Japan
∗Corresponding authors
Abstract
Determining subcellular localization of proteins is considered as an important step towards understanding their functions. Previous studies have mainly fo-cused solely on Gene Ontology (GO) as the main feature to tackle this problem. However, it was shown that features extracted based on GO is hard to be used for new proteins with unknown GO. At the same time, evolutionary informa-tion extracted from Posiinforma-tion Specific Scoring Matrix (PSSM) have been shown as another effective features to tackle this problem. Despite tremendous ad-vancement using these sources for feature extraction, this problem still remains unsolved. In this study we propose EvoStruct-Sub which employs predicted structural information in conjunction with evolutionary information extracted directly from the protein sequence to tackle this problem. To do this we use several different feature extraction method that have been shown promising in subcellular localization as well as similar studies to extract effective local and global discriminatory information. We then use Support Vector Machine (SVM) as our classification technique to build EvoStruct-Sub. As a result, we are able to enhance Gram-positive subcellular localization prediction accuracies by up to 5.6% better than previous studies including the studies that used GO for
ACCEPTED MANUSCRIPT
feature extraction.
Keywords: Proteins subcellular localization, Evolutionary-based Features, Structural-based Features, Classification, Support Vector Machine, Feature Selection
1. INTRODUCTION
The functioning of a protein depends on its location in the cell. In fact, it just functions properly in one or a few locations in the cell. Knowing those locations can provide important information about functioning of the proteins and how they interact with other micro-molecules. Therefore, determining protein
sub-5
cellular localization is considered as an important step towards understanding its functioning [1, 2].
Of all proteins, bacterial proteins are the most important proteins to deter-mine their functions because of their biological aspects which are both harmful and useful [3]. Some bacteria can cause a wide range of diseases while some
10
others play the role of catalyst in biological interactions. Some bacteria are also widely used to produce antibiotics. Bacteria are categorized as a kind of prokaryotic microorganism that can be divided in two groups, Gram-positive and Gram-negative [4]. Gram-positive bacteria are those that are stained dark blue or violet by Gram-staining while Gram-negative bacteria cannot retain the
15
stain, instead taking up the counter-stain and appearing red or pink [3]. During the past two decades and since the introduction of bacterial proteins subcellular localization, a wide range of machine learning methods with many different combination and types of features have been proposed to tackle this problem [5, 6, 7, 8, 9, 10, 11, 12, 13, 14, 15, 16, 17, 18, 19, 20, 21, 22, 23, 24, 24, 25,
20
26]. For example, PSORT (predictor) used sequence features based on sorting signal [27], SubLoc (predictor) uses SVM with AAC to obtain higher accuracy [28], and TargetP (predictor) uses ANN and N-terminal sequence to predict subcellular locations [29]. In addition Pierleoni et al. used N-terminal, AAC and alignment profile to predict the subcellular localization [30]. Similarly, Tamura
ACCEPTED MANUSCRIPT
and Akutsu used alignment of block sequence [31] and Chang et al. developed and used gapped-dipeptide and probabilistic latent semantic analysis method for prediction of Gram-negative bacterial protein [32]. Lee et al. Despite all the efforts have been made so far, the protein subcellular localization prediction problem for bacterial proteins have remained unsolved.
30
As pointed in a recent review [33], in the last decade or so, a number of web-servers were also developed for predicting the subcellular localization of proteins with both single site and multiple sites based on their sequences information alone. They can be roughly classified into two series [34]. One is the PLoc series and the other is iLoc series. The PLoc series contains the six web-servers [4],
35
[35], [36], [37], [38], [39] to deal with eukaryotic, human, plant, Gram-positive, Gram-negative, and virus proteins, while the iLoc series contains the seven web-servers [40], [41], [42] , [43], [3], [40], [44] to deal with eukaryotic, human, plant, animal, Gram-positive, Gram-negative, and virus proteins, respectively.
In addition, Huang and Yuan analyzed series of classifiers for subcellular
40
localization, but these were limited to single location site. For multi label pre-diction, Gpos-mplock and Gneg-mplock (predictor) are proposed [36], [38] to predict protein localization in Gram-positive and Gram-negative bacteria; and Plant-mploc (predictor) is developed [37] which uses top down strategy to pre-dict single or multiple protein localization in plant protein. Virus-mploc
(pre-45
dictor) [39] was developed with fusion of classifiers and features of functional domain and gene ontology to predict virus proteins. To increase the quality of prediction, three revised version of the prediction systems were developed: iloc-Gpos (predictor) [3], iloc-plant (predictor) [42], iloc-virus (predictor) [44]. Huang and Yuan used AAC, evolution information and PseACC with backward
50
propagation (BP) and radial basis function (RBF) neural network to predict both single and multi-site subcellular proteins.
Many of those studies that have mentioned earlier relied on Gene Ontology as their feature to tackle this problem [45, 46, 47, 48, 49]. Despite promising results achieved using GO, it is hard or even for some cases impossible to use
55
ACCEPTED MANUSCRIPT
emphasis on proposing methods that rely on features directly extracted from protein sequence without using any other extra information or meta data that are available for just known proteins.
Early studies have focused on using features that are extracted from the
oc-60
currence of amino acids from the protein sequence [50, 45, 51]. Later studies try to incorporate physicochemical based features to enhance the prediction per-formance [52]. However, the protein subcellular localization prediction problem remained limited using these sources of features.
More recent studies have started using evolutionary information to tackle
65
this problem [2, 53, 54, 5, 7, 55, 6]. Using these features they demonstrated significant enhancement and even achieved comparable performance compared to use of GO as input feature. In fact, application of evolutionary based fea-tures have demonstrated its superiority over using occurrence or physicochem-ical based features in many similar studies found in the literature [56, 57, 58,
70
59, 60, 61]. However, further enhancement have remained out of reach relying on these features. In addition, many of those studies tried to address Gram-positive and Gram-negative subcellular localization at the same time. Despite lots of similarities, still they have their own differences in nature based on their biological properties. Therefore, similar to all the other subcellular-localization
75
prediction problems, a well designed method that is tailored for that specific task (either Gram-positive or Gram-negative) has a better chance to achieve more promising results.
To develop a really useful sequence-based statistical predictor for a biological system as reported in a series of recent publications [20, 21, 22, 23, 24, 33,
80
12, 62, 63, 64, 65, 66], one should observe the Chou’s 5-step rule [67]; i.e., making the following five steps very clear: (i) how to construct or select a valid benchmark dataset to train and test the predictor; (ii) how to formulate the biological sequence samples with an effective mathematical expression that can truly reflect their intrinsic correlation with the target to be predicted; (iii)
85
how to introduce or develop a powerful algorithm (or engine) to operate the prediction; (iv) how to properly perform cross-validation tests to objectively
ACCEPTED MANUSCRIPT
evaluate the anticipated accuracy of the predictor; (v) how to establish a user-friendly web-server for the predictor that is accessible to the public. Below, we are to describe how to deal with these steps one-by- one.
90
To address these problems, here we propose EvoStruct-Sub which in addi-tion to evoluaddi-tionary informaaddi-tion uses predicted structural informaaddi-tion to specifi-cally predict Gram-positive subcellular localization. To do this, we first extract evolutionary information from Position Specific Scoring Matrix (PSSM) [68] and predicted secondary structure using SPDER 2.0 [69, 70]. We then extract
95
global and local discriminatory information using segmentation technique for our classification task [71, 72]. We finally use Support Vector Machine (SVM) to our extracted features to build EvoStruct-Sub. By applying EvoStruct-Sub to Gram-positive subcellular localization, we achieve up to 95.4% prediction ac-curacy for this task. In addition, we achieve to over 90.0% prediction acac-curacy
100
for this problem when we use our method for multi-label samples. These results are over 5.0% better than previously reported results found in the literature [73, 5, 6].
2. MATERIALS AND METHODS
In this section, we describe the materials and methods required to develop
105
EvoStruct-Sub.
2.1. Benchmark Dataset
In this research we use a dataset which have been used widely in literature for Gram-positive subcellular localization [74], [75], [76], [77], [78]. The benchmark that we use in this study was introduced in [74], [75], [76], [77]. This
bench-110
mark contains total 523 protein samples which belongs to four Gram-positive subcellular localizations. Among this 523 samples there are total 519 differ-ent protein sample. Among 519 proteins there are total 515 protein samples which belongs to only one or single location while the rest 4 protein samples belongs to two locations. Thus Gram-positive bacterial protein benchmark
con-115
ACCEPTED MANUSCRIPT
proteins in these four locations are shown in Table 1. This dataset is available at: http://www.csbio.sjtu.edu.cn/bioinf/Gpos-multi.
Table 1: Details of Gram-positive bacterial proteins’ dataset
No. subcellular location Total protein samples 1 Cell membrane 174
2 Cell wall 18 3 Cytoplasm 208 4 Extracellular 123 Total number of locative proteins 523 Total number of different proteins 519
2.2. Feature Extraction
We extract evolutionary information from Position Specific Scoring Matrix
120
(PSSM) [68] and structural information from the SPIDER 2.0 [70, 69].
PSSM which is produced as the output of PSIBLAST is an scoring matrix that provide substitution probabilities of a given amino acid with other amino acids based on its specific position in a protein[68]. PSSM is aL×20 matrix, where L is the length of the input protein. Here we use PSIBLAST with three
125
iteration and its cut off value (E) set to 0.001 to produce PSSM .
SPIDER 2.0 (Scoring Protein Interaction Decoys using Exposed Residues) is an accurate method that predict different aspects of local structure such as secondary structure, torsion angle, and Accessible Surface Area (ASA), simul-taneously [70, 69]. As an output it produces aL×8 matrix that include three
130
columns of the probability of contribution of amino acids to each of the sec-ondary structure elements (α-helix, β-strand, coil), one column for ASA, and four columns for the torsion angles (φ,ψ,θ,τ) [79, 80]. For the rest of this pa-per, we will refer to this matrix as SPD3 for simplicity. SPD3 has been recently used in many different fields and demonstrated promising results [81, 82, 83, 84].
135
Here we have extracted a wide range of features based on different concepts that have been investigate in the literature both for PSSM and SPD3. As a
ACCEPTED MANUSCRIPT
result the combination of 6 feature groups attained the best result for our task. This might be due to the consistency of these sets of features with each other. However, further investigations in future can potentially provide better
under-140
standing of available discriminatory information in these feature groups and consequently provide further prediction enhancement. These 6 feature groups are explained in detail in the following sections.
2.2.1. PSSM-AAO Feature
PSSM-AAO is amino acid occurrence based on PSSM. This feature group is
145
directly extracted from PSSM matrix. It aims at capturing global discriminatory information regarding the substitution probabilities of the amino acids with respect to their positions in the protein sequence [85, 86, 87]. This feature is extracted by summation of the substitution score of a given amino acid with all the amino acids along the protein sequence. The equation for this feature is
150 given below: P SSM−AAOj = L X i=1 Ni,j (j= 1, ...,20) (1)
Here N is the corresponding matrix, L is the protein length and j is the respective column. The dimensionality of this feature vector is 20. Algorithm for extracting composition feature is shown in Algorithm 1.
155
2.2.2. PSSM-SD Feature
This method is specifically proposed to add more local discriminatory in-formation about how the amino acids, based on their substitution probabilities (extracted from PSSM), are distributed along the protein sequence [88]. This method is explained in detail in [71] [5].
160
Algorithm for extracting PSSM-SD feature is shown in Algorithm 2. As shown in [5] using Fp = 25 gives the best result for this method. As
a result, in our final experiment we have adopted Fp = 25 which produces 80
ACCEPTED MANUSCRIPT
Algorithm 1:PSSM-AAO Feature Extraction
1 N←PSSM Matrix; 2 L←Length of the Protein; 3 C←Number of matrix column; 4 V ←Empty array of sizeC; 5 forj= 0; j < C; j=j+ 1do 6 sum←0;
7 fori= 0; i < L; i=i+ 1do 8 sum=sum+Ni,j;
9 end
10 Vj=sum;
11 end
2.2.3. PSSM-SAC Feature
165
This feature was introduced in [5, 89, 86]. It was shown that information about the interaction of neighboring amino acids along the protein sequence can play an important role in providing significant local discriminatory information and enhancing protein subcellular localization prediction accuracy [6, 87]. To ex-tract this information, the concept of auto covariance has been used for different
170
segments of proteins. This is done to enforce local discriminatory information extracted from PSSM. We use the similar approach that was adopted and ex-plained in [5]. We also use the distance factor of 10 as it was also shown in this study as the most effective parameter to extract features for protein subcellular localization.
175
2.2.4. Auto Covariance of Predicted Secondary Structure
A correlation factor coupling adjacent residues along the protein sequence is known as Auto covariance (AC) [59, 90, 72]. It is also known as a kind of variant
ACCEPTED MANUSCRIPT
Algorithm 2:PSSM-SD Feature Extraction
1 N←PSSM Matrix; 2 L←Length of the Protein; 3 C←Number of matrix column; 4 Fp←Desired value ofFp, e.g 5, 10, 25; 5 V ←Empty array of size (100÷Fp)×C; 6 k← 0 ; 7 forj= 0; j < C; j=j+ 1do 8 Tj ←Sum of jth column; 9 partialSum←0; 10 i←0; 11 fortp=Fp; tp <= 50; tp=tp+Fpdo 12 whilepartialSum <=tp×(Tj÷100)do 13 partialSum=partialSum+Ni,j; 14 i=i+ 1; 15 end 16 Vk=i; 17 k=k+ 1; 18 end 19 partialSum←0; 20 i←L; 21 index←0; 22 fortp=Fp; tp <= 50; tp=tp+Fpdo 23 whilepartialSum <=tp×(Tj÷100)do
24 partialSum=partialSum+Ni,j; 25 i=i−1; 26 index=index+ 1; 27 end 28 Vk=index; 29 k=k+ 1; 30 end 31 end
of auto cross covariance. It is a very powerful statistical tool which is used to analyze sequences of vectors [91]. The Auto Covariance transformation has been
ACCEPTED MANUSCRIPT
widely applied in various fields of bioinformatics [92], [93], [94], [95], [96], [97]. Auto Covariance variables are able to avoid producing too many variants. The equation for this feature is given below:
185 AutoCovariancek,j= 1 L LX−k i=1 Ni,jNi+k,j (j= 1, ...,20and k= 1...DF) (2)
where DF is the distance factor. Different values have been tested to find out the effective value of DF which gives the highest accuracy rate of prediction. In this research we have tested total 15 values for DF (DF = 1,2,3,4,...,12,13,14,15) and took only one value which is DF = 10. We have observed that DF = 10 gives the highest accuracy rate for this task. So, the effective value of DF is
190
used as 10 for the employed benchmark. The dimensionality of this feature vector will be (N umber of columns)×DF. Since we are using this method to extract features based on the predicted secondary structure which consists of three columns in SPD3, we will have 30 features in total. Algorithm for extracting auto covariance feature is shown at Algorithm 3.
195
2.2.5. Composition of Torsion Angles
This feature is extracted from the Spider SPD3. Torsion angles are shown as effectives components to capture continuous information based on the secondary structure of proteins [79, 80]. To calculate this feature we have taken columns corresponding to torsion angles one at the time, summed up all the values and
200
finally divided them byL. The equation for this method is given below:
Compositionj = 1 L L X i=1 Ni,j (3)
HereNis the corresponding matrix,Lis the protein length andjis the respec-tive column. The dimensionality of this feature vector will be (N umber of columns) which is four for our case corresponding to four torsion angles. Algorithm for
205
ACCEPTED MANUSCRIPT
Algorithm 3:Auto Covariance Feature Extraction
1 DF ←10;
2 P ←Matrix from which feature will be extracted; 3 L←Length of the Protein;
4 V ←Empty array of sizeL×(Number of matrix column); 5 C←Number of matrix column;
6 fork= 0; k < DF; k=k+ 1do 7 forj= 0; j < C; j=j+ 1do 8 sum←0;
9 fori= 0; i < L−k; i=i+ 1do 10 sum=sum+Pi,jPi+k,j;
11 end
12 Vk,j= sum
L ; 13 end
14 end
2.2.6. One-Lead Bi-gram of ASA
We extract this feature based on the Bi-gram concept that have been previ-ously used in [87, 60, 6]. Accessible Surface Area (ASA) can provide important information on the locality of neighboring amino acids in the proteins 3D
struc-210
ture [98]. We adopt this method to extract one-lead Bi-gram for the ASA. Algorithm for extracting one-lead Bi-gram feature is shown in Algorithm 5.
The equation for this feature is given below:
OneLeadBigramk,l= 1
L
LX−2
i=1
Ni,kNi+2,l (4)
The dimensionality of this feature vector will be:
215
(N umber of columns)×(N umber of columns).
ACCEPTED MANUSCRIPT
Algorithm 4:Composition Feature Extraction
1 N←Matrix from which feature will be extracted; 2 L←Length of the Protein;
3 C←Number of matrix column; 4 V ←Empty array of sizeC; 5 forj= 0; j < C; j=j+ 1do 6 sum←0;
7 fori= 0; i < L; i=i+ 1do 8 sum=sum+Ni,j;
9 end
10 Vj=
sum L ; 11 end
one of the most important but also most difficult problems in computational bi-ology is how to express a biological sequence with a discrete model or a vector, yet still keep considerable sequence-order information or key pattern
charac-220
teristic. This is because all the existing machine-learning algorithms can only handle vector but not sequence samples, as elucidated in a comprehensive re-view [33]. However, a vector defined in a discrete model may completely lose all the pattern information. To avoid completely losing the sequence-pattern information for proteins, the pseudo amino acid composition or PseAAC
225
[45] was proposed. Ever since the concept of Chou’s PseAAC was proposed, it has been widely used in nearly all the areas of computational proteomics [99]. Because it has been widely and increasingly used, recently three pow-erful open access soft-wares, called Builder’, ’propy’, and ’PseAAC-General’, were established: the former two are for generating various modes of
230
Chou’s special PseAAC; while the 3rd one for those of Chou’s general PseAAC [67], including not only all the special modes of feature vectors for proteins but also the higher level feature vectors such as ”Functional Domain” mode, ”Gene Ontology” mode, and ”Sequential Evolution” or ”PSSM” mode [67].
ACCEPTED MANUSCRIPT
Algorithm 5:One-Lead Bi-gram Feature Extraction
1 N←Matrix from which feature will be extracted; 2 L←Length of the Protein;
3 C←Number of matrix column; 4 V ←Empty array of sizeC×C; 5 fork= 0; k < C; k=k+ 1do 6 forl= 0; l < C; l=l+ 1do 7 sum←0;
8 fori= 0; i < L−2; i=i+ 1do 9 sum=sum+Ni,kNi+2,l;
10 end
11 Vk,l= sum
L ; 12 end
13 end
Encouraged by the successes of using PseAAC to deal with protein/peptide
235
sequences, the concept of PseKNC [100] was developed for generating various feature vectors for DNA/RNA sequences that have proved to be very useful as well [66, 67, 101, 57, 99, 100, 102]. Particularly, recently a very powerful web-server called ’Pse-in-One’ [101] and its updated version ’Pse-in-One2.0’ [57] have been established that can be used to generate any desired feature vectors for
240
protein/peptide and DNA/RNA sequences according to users’ need or defined by users’ own. In the current study, we are to use the six features extracted from the PSSM and SPIDER to formulate the protein sequences for predicting their subcellular localization.
2.3. Support Vector Machine
245
SVM is considered to be one of the best pattern recognition techniques [103]. It is also widely used in Bioinformatics and has outperformed other classifiers and obtained promising results for protein subcellular localization. It aims to
ACCEPTED MANUSCRIPT
reduce the prediction error rate by finding the hyperplane that produces the largest margin based on the concept of support vector theory. It transforms
250
the input data to higher dimensions using the kernel function to be able to find support vectors (for non linear cases). The classification of some known points in input spacexiisyiwhich is defined to be either−1 or +1. Ifx0 is a point in
input space with unknown classification then:
y0= sin(
n X i=1
aiyiK(xi, x0) +b) (5)
where y0 is the predicted class of point x0. The function K() is the kernel
function,nis the number of support vectors andaiare adjustable weights and
bis the bias. In this study, the SVM classifier is implemented with the LIBSVM toolbox using the Radial Basis Function (RBF) as its kernel [104]. RBF kernel is adopted in our experiments due to its better performance than other kernels functions (e.g. polynomial kernel, linear kernel, and sigmoid). RBF kernel is defined as follows:
K(xi, xj) =e−γkxi−xjk 2
whereγis the regularization parameter,xiandxj are input feature vectors. In
255
this study, theγin addition to the cost parameterC(also called the soft margin parameter) are optimized using grid search algorithm which is also implemented in the LIBSVM package. Despite its simplicity, grid search has been shown to be an effective method to optimize these parameters. We tuned those parameter using grid search implemented in LIBSVM. As a result we used Cost parameter
260
(C) = 3000, andγ= 0.005.
3. VALIDATION METHOD
For our experiment we have adopted two types of validation method namely, 10-fold cross validation and jackknife (also known as leave-one-out) cross vali-dation.
ACCEPTED MANUSCRIPT
10-Fold Cross Validation: in 10-fold cross-validation, the original sample set is randomly partitioned into 10 equal sized subsamples. Of the 10 subsam-ples, a single subsample is retained as the validation data for testing the model, and the remaining 9 subsamples are used as training data. The cross-validation
270
process is then repeated 10 times with each of the 10 subsamples used exactly once as the validation data. The 10 results from the folds can then be averaged to produce a single estimation. The advantage of this method is that all samples are used for both training and validation.
275
Jackknife Test: in this method the original sample is randomly partitioned intonsubsamples wherenis the total number of samples in the dataset. Of the
n subsamples a single subsample (means exactly one sample from the sample dataset) is retained as the validation data for testing the model, and the remain-ingn−1 subsamples are used as training data. The cross-validation process is
280
then repeatedntimes, with each of thensubsamples used exactly once as the validation data. Thenresults from the folds can then be combined to produce a single estimation. The advantage of this method is that all observations are used for both training and validation and each observation is used for validation exactly once. It can help to build a more general and robust method. The main
285
disadvantage of jackknife test is it takes more time to complete a full training and testing process.
4. EVALUATION MEASUREMENT
290
Here we use Sensitivity, Specificity, Matthew’s Correlation Coefficient (MCC) and accuracy to provide more information about the statistical significance of our achieved results. Sensitivity, specificity, MCC and accuracy are statistical measures of the performance of a binary classification test, also known in statis-tics as classification function. These have been widely used in the literature for
ACCEPTED MANUSCRIPT
protein subcellular localization [48, 105, 41]. Sensitivity(also called the true positive rate, the recall, or probability of detection in some fields) measures the proportion of positives that are correctly identified. Specificity (also called the true negative rate) measures the proportion of negatives that are correctly identified. The value of sensitivity and specificity varies between 0 and 1.
Hav-300
ing specificity, and sensitivity equal to 1 represents a fully accurate model while 0 represents a fully inaccurate. On the other hand, MCC measures the pre-diction quality of the model. MCC takes into account true and false positives and negatives and is generally regarded as a balanced measure which can be used even if the classes are of very different sizes. The accuracyrefers to the
305
total correctly classified instances over the number of samples present in the dataset. The equation for calculating sensitivity, specificity, MCC and accuracy are given below:
Sensitivity= T P T P+F N ×100 (6) Specif icity= T N T N+F P ×100 (7) M CC= p (T N×T P)−(T N×F P) (T P+F P)(T P+F N)(T N+F P)(T N+F N)×100 (8) Accuracy= T P+T N T P+F N+F P+T N ×100 (9)
where T P is the number of correctly identified (true positive) samples, F N is the number of incorrectly rejected samples (false negative),T Nis the number of
310
correctly rejected (true negative) samples, andF P is the number of incorrectly accepted samples (false positive).
This set of metrics is valid only for the single-label systems (in which each protein only belongs to one and only class). For the multi-label systems (in which a protein might belong to several classes), whose existence has become
315
ACCEPTED MANUSCRIPT
biomedicine [108], a completely different set of metrics as defined in [109] is needed. This set of metrics widely used in the literature [110, 111, 112, 113, 64, 114, 115, 63, 116, 117, 65, 57] . Also, the rigorous metrics used in here to examine the quality of a new predictor for a multi-label system was taken from
320
[109].
5. RESULTS AND DISCUSSION
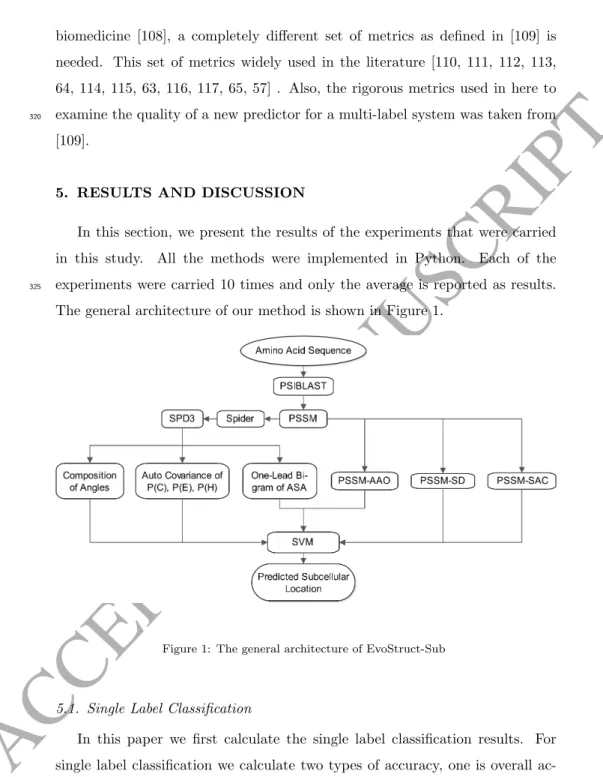
In this section, we present the results of the experiments that were carried in this study. All the methods were implemented in Python. Each of the experiments were carried 10 times and only the average is reported as results.
325
The general architecture of our method is shown in Figure 1.
Figure 1: The general architecture of EvoStruct-Sub
5.1. Single Label Classification
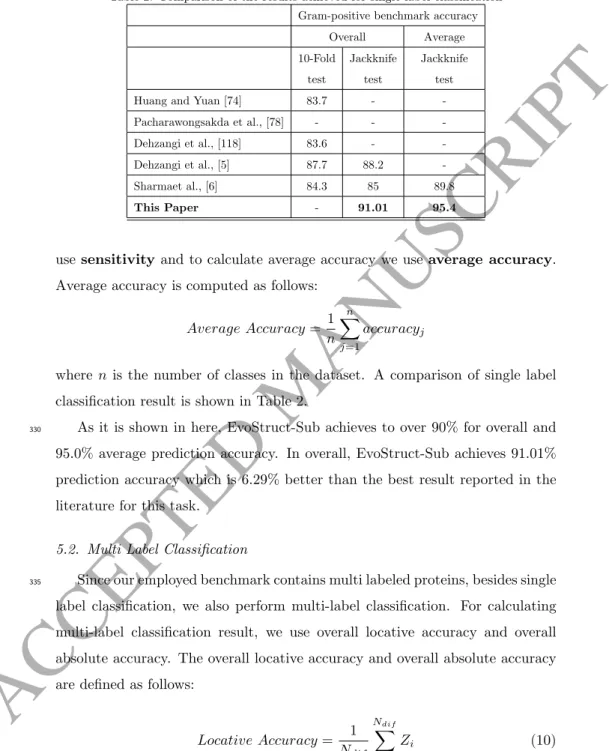
In this paper we first calculate the single label classification results. For single label classification we calculate two types of accuracy, one is overall ac-curacy and another one is average acac-curacy. To calculate overall acac-curacy we
ACCEPTED MANUSCRIPT
Table 2: Comparison of the results achieved for single label classificationGram-positive benchmark accuracy
Overall Average 10-Fold test Jackknife test Jackknife test
Huang and Yuan [74] 83.7 -
-Pacharawongsakda et al., [78] - -
-Dehzangi et al., [118] 83.6 -
-Dehzangi et al., [5] 87.7 88.2
-Sharmaet al., [6] 84.3 85 89.8
This Paper - 91.01 95.4
use sensitivityand to calculate average accuracy we useaverage accuracy. Average accuracy is computed as follows:
Average Accuracy= 1 n n X j=1 accuracyj
where nis the number of classes in the dataset. A comparison of single label classification result is shown in Table 2.
As it is shown in here, EvoStruct-Sub achieves to over 90% for overall and
330
95.0% average prediction accuracy. In overall, EvoStruct-Sub achieves 91.01% prediction accuracy which is 6.29% better than the best result reported in the literature for this task.
5.2. Multi Label Classification
Since our employed benchmark contains multi labeled proteins, besides single
335
label classification, we also perform multi-label classification. For calculating multi-label classification result, we use overall locative accuracy and overall absolute accuracy. The overall locative accuracy and overall absolute accuracy are defined as follows:
Locative Accuracy= 1
Ndif NXdif
i=1
ACCEPTED MANUSCRIPT
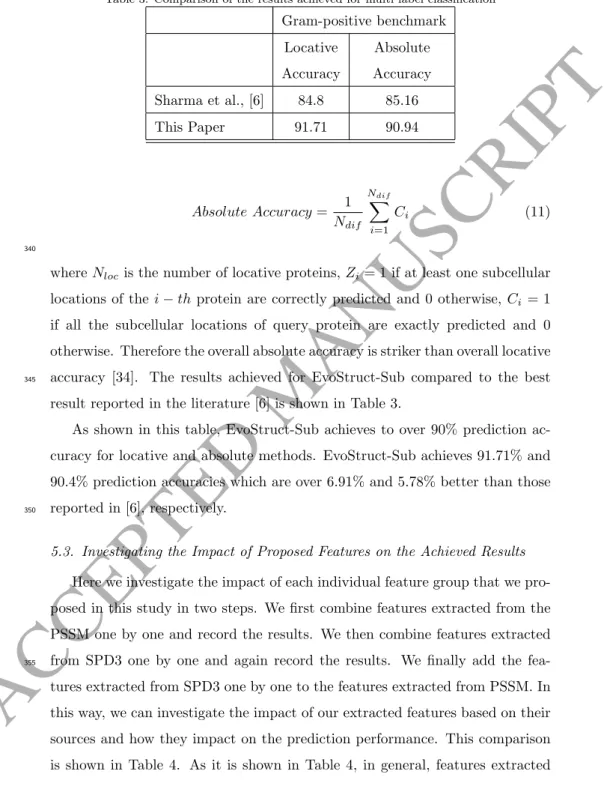
Table 3: Comparison of the results achieved for multi label classificationGram-positive benchmark Locative Accuracy Absolute Accuracy Sharma et al., [6] 84.8 85.16 This Paper 91.71 90.94 Absolute Accuracy= 1 Ndif NXdif i=1 Ci (11) 340
whereNlocis the number of locative proteins,Zi= 1 if at least one subcellular
locations of thei−thprotein are correctly predicted and 0 otherwise,Ci = 1
if all the subcellular locations of query protein are exactly predicted and 0 otherwise. Therefore the overall absolute accuracy is striker than overall locative accuracy [34]. The results achieved for EvoStruct-Sub compared to the best
345
result reported in the literature [6] is shown in Table 3.
As shown in this table, EvoStruct-Sub achieves to over 90% prediction ac-curacy for locative and absolute methods. EvoStruct-Sub achieves 91.71% and 90.4% prediction accuracies which are over 6.91% and 5.78% better than those reported in [6], respectively.
350
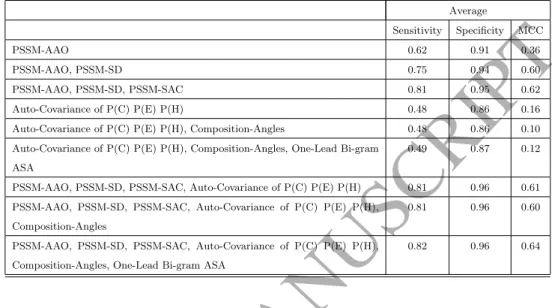
5.3. Investigating the Impact of Proposed Features on the Achieved Results
Here we investigate the impact of each individual feature group that we pro-posed in this study in two steps. We first combine features extracted from the PSSM one by one and record the results. We then combine features extracted from SPD3 one by one and again record the results. We finally add the
fea-355
tures extracted from SPD3 one by one to the features extracted from PSSM. In this way, we can investigate the impact of our extracted features based on their sources and how they impact on the prediction performance. This comparison is shown in Table 4. As it is shown in Table 4, in general, features extracted
ACCEPTED MANUSCRIPT
Table 4: Investigating the impact of features extracted from PSSM, SPD3, and theircombi-nations Average Sensitivity Specificity MCC PSSM-AAO 0.62 0.91 0.36 PSSM-AAO, PSSM-SD 0.75 0.94 0.60 PSSM-AAO, PSSM-SD, PSSM-SAC 0.81 0.95 0.62 Auto-Covariance of P(C) P(E) P(H) 0.48 0.86 0.16 Auto-Covariance of P(C) P(E) P(H), Composition-Angles 0.48 0.86 0.10 Auto-Covariance of P(C) P(E) P(H), Composition-Angles, One-Lead Bi-gram
ASA
0.49 0.87 0.12
PSSM-AAO, PSSM-SD, PSSM-SAC, Auto-Covariance of P(C) P(E) P(H) 0.81 0.96 0.61 PSSM-AAO, PSSM-SD, PSSM-SAC, Auto-Covariance of P(C) P(E) P(H),
Composition-Angles
0.81 0.96 0.60
PSSM-AAO, PSSM-SD, PSSM-SAC, Auto-Covariance of P(C) P(E) P(H), Composition-Angles, One-Lead Bi-gram ASA
0.82 0.96 0.64
from PSSM provide better performance than SPD3. However, the best results
360
achieve by adding the SPD3-based features to PSSM-based features. It high-lights the incremental impact of structural features extracted from SPD3 on the achieved results and on enhancing the protein subcellular localization prediction performance.
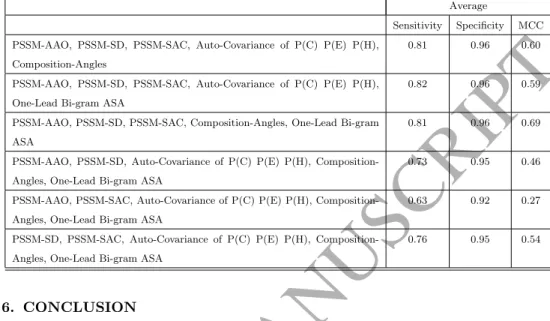
We then investigate the impact of each of our proposed feature groups
indi-365
vidually on the achieved results. To do this, we exclude each of feature group from the combination of features one at the time. In other words, we exclude each one of our feature groups which leave us with the combination of 5 remain-ing feature groups. The result for this experiments are demonstrated in Table 5. As it is shown in Table 5, we still can achieve very good results using the
370
combination of 5 feature groups. However, none of those combinations achieve to the results of using all 6 feature groups at the time. In other words, incor-poration of all 6 proposed feature groups is vital to enhance protein subcellular localization prediction problem.
ACCEPTED MANUSCRIPT
Table 5: Investigating the impact of each individual feature group on our achieved results.Average
Sensitivity Specificity MCC PSSM-AAO, PSSM-SD, PSSM-SAC, Auto-Covariance of P(C) P(E) P(H),
Composition-Angles
0.81 0.96 0.60
PSSM-AAO, PSSM-SD, PSSM-SAC, Auto-Covariance of P(C) P(E) P(H), One-Lead Bi-gram ASA
0.82 0.96 0.59
PSSM-AAO, PSSM-SD, PSSM-SAC, Composition-Angles, One-Lead Bi-gram ASA
0.81 0.96 0.69
PSSM-AAO, PSSM-SD, Auto-Covariance of P(C) P(E) P(H), Composition-Angles, One-Lead Bi-gram ASA
0.73 0.95 0.46
PSSM-AAO, PSSM-SAC, Auto-Covariance of P(C) P(E) P(H), Composition-Angles, One-Lead Bi-gram ASA
0.63 0.92 0.27
PSSM-SD, PSSM-SAC, Auto-Covariance of P(C) P(E) P(H), Composition-Angles, One-Lead Bi-gram ASA
0.76 0.95 0.54
6. CONCLUSION
375
In this study, we have proposed EvoStruct-Sub for predicting Gram-positive bacterial protein subcellular localization. To build EvoStruct-Sub we have ex-tracted a wide range of features from PSSM and SPD3 and among them selected 6 features with total feature vector size of 235. We then used SVM to our ex-tracted features for the classification task. As our benchmark is multi-label
380
dataset, so we have reported both single label and multi label prediction accu-racies. For single label classification our reported result is 91.01% and for multi label classification our reported result for locative accuracy is 91.71% and for absolute accuracy is 90.94%. These results in all cases are up to 6% better than previously reported results in the literature for Gram-positive subcellular
lo-385
calization. These enhancements highlight the effectiveness of EvoStruct-Sub to explore the potential information embedded in the PSSM and SPD3 for Gram-positive subcellular localization prediction problem.
As pointed out in [119] and demonstrated in a series of recent publications (see, e.g., [116, 117]), user-friendly and publicly accessible web-servers represent
390
the future direction for developing practically more useful prediction methods and computational tools. Actually, many practically useful web-servers have
ACCEPTED MANUSCRIPT
increasing impacts on medical science, driving medicinal chemistry into an un-precedented revolution [99], we shall make efforts in our future work to provide a web-server for the prediction method presented in this paper.
395
7. ACKNOWLEDGEMENTS
We would like to thank Professor Kuo-Chen Chou for sharing Gram-positive and Gram-negative protein subcellular localizations benchmarks which are in-troduced inCell-PLoc 2.0package.
References
400
[1] K.-C. Chou, Using amphiphilic pseudo amino acid composition to predict enzyme subfamily classes, Bioinformatics 21 (1) (2004) 10–19.
[2] K.-C. Chou, H.-B. Shen, Recent progress in protein subcellular location prediction, Analytical biochemistry 370 (1) (2007) 1–16.
[3] Z.-C. Wu, X. Xiao, K.-C. Chou, iloc-gpos: a multi-layer classifier for
405
predicting the subcellular localization of singleplex and multiplex gram-positive bacterial proteins, Protein and peptide letters 19 (1) (2012) 4–14. [4] H.-B. Shen, K.-C. Chou, Gpos-mploc: a top-down approach to improve the quality of predicting subcellular localization of gram-positive bacterial proteins, Protein and peptide letters 16 (12) (2009) 1478–1484.
410
[5] A. Dehzangi, R. Heffernan, A. Sharma, J. Lyons, K. Paliwal, A. Sat-tar, Gram-positive and gram-negative protein subcellular localization by incorporating evolutionary-based descriptors into chou s general pseaac, Journal of theoretical biology 364 (2015) 284–294.
[6] R. Sharma, A. Dehzangi, J. Lyons, K. Paliwal, T. Tsunoda, A. Sharma,
415
Predict gram-positive and gram-negative subcellular localization via in-corporating evolutionary information and physicochemical features into
ACCEPTED MANUSCRIPT
chou’s general pseaac, IEEE Transactions on NanoBioscience 14 (8) (2015) 915–926.
[7] H. Saini, G. Raicar, A. Dehzangi, S. Lal, A. Sharma, Subcellular
localiza-420
tion for gram positive and gram negative bacterial proteins using linear interpolation smoothing model, Journal of theoretical biology 386 (2015) 25–33.
[8] S. Shatabda, S. Saha, A. Sharma, A. Dehzangi, iphloc-es: Identification of bacteriophage protein locations using evolutionary and structural features,
425
Journal of theoretical biology 435 (2017) 229–237.
[9] A. Sharma, K. K. Paliwal, S. Imoto, S. Miyano, A feature selection method using improved regularized linear discriminant analysis, Machine vision and applications 25 (3) (2014) 775–786.
[10] A. Sharma, A. Dehzangi, J. Lyons, S. Imoto, S. Miyano, K. Nakai,
430
A. Patil, Evaluation of sequence features from intrinsically disordered re-gions for the estimation of protein function, PloS one 9 (2) (2014) e89890. [11] X.-X. Chen, H. Tang, W.-C. Li, H. Wu, W. Chen, H. Ding, H. Lin, Iden-tification of bacterial cell wall lyases via pseudo amino acid composition, BioMed Research International 2016.
435
[12] X. Cheng, X. Xiao, K.-C. Chou, ploc-meuk: Predict subcellular localiza-tion of multi-label eukaryotic proteins by extracting the key go informalocaliza-tion into general pseaac, Genomics.
[13] G.-L. Fan, Q.-Z. Li, Predict mycobacterial proteins subcellular locations by incorporating pseudo-average chemical shift into the general form of
440
chous pseudo amino acid composition, Journal of Theoretical Biology 304 (2012) 88–95.
[14] S. Mei, Multi-kernel transfer learning based on chou’s pseaac formulation for protein submitochondria localization, Journal of Theoretical Biology 293 (2012) 121–130.
ACCEPTED MANUSCRIPT
[15] S. Mei, Predicting plant protein subcellular multi-localization by chou’s pseaac formulation based multi-label homolog knowledge transfer learn-ing, Journal of theoretical biology 310 (2012) 80–87.
[16] S. Wan, M.-W. Mak, S.-Y. Kung, Goasvm: a subcellular location predictor by incorporating term-frequency gene ontology into the general form of
450
chou’s pseudo-amino acid composition, Journal of Theoretical Biology 323 (2013) 40–48.
[17] Y.-S. Jiao, P.-F. Du, Predicting protein submitochondrial locations by in-corporating the positional-specific physicochemical properties into chou’s general pseudo-amino acid compositions, Journal of theoretical biology
455
416 (2017) 81–87.
[18] B. Yu, S. Li, W.-Y. Qiu, C. Chen, R.-X. Chen, L. Wang, M.-H. Wang, Y. Zhang, Accurate prediction of subcellular location of apoptosis pro-teins combining chous pseaac and psepssm based on wavelet denoising, Oncotarget 8 (64) (2017) 107640.
460
[19] S. Zhang, X. Duan, Prediction of protein subcellular localization with oversampling approach and chou’s general pseaac, Journal of theoretical biology 437 (2018) 239–250.
[20] X. Cheng, X. Xiao, K.-C. Chou, ploc-mplant: predict subcellular local-ization of multi-location plant proteins by incorporating the optimal go
465
information into general pseaac, Molecular BioSystems 13 (9) (2017) 1722– 1727.
[21] X. Cheng, X. Xiao, K.-C. Chou, ploc-mvirus: predict subcellular local-ization of multi-location virus proteins via incorporating the optimal go information into general pseaac, Gene 628 (2017) 315–321.
470
[22] X. Cheng, X. Xiao, K.-C. Chou, ploc-mgneg: Predict subcellular localiza-tion of gram-negative bacterial proteins by deep gene ontology learning via general pseaac, Genomics.
ACCEPTED MANUSCRIPT
[23] X. Cheng, X. Xiao, K.-C. Chou, ploc-mhum: predict subcellular localiza-tion of multi-localocaliza-tion human proteins via general pseaac to winnow out
475
the crucial go information, Bioinformatics 1 (2017) 9.
[24] X. Cheng, S.-G. Zhao, W.-Z. Lin, X. Xiao, K.-C. Chou, ploc-manimal: predict subcellular localization of animal proteins with both single and multiple sites, Bioinformatics 33 (22) (2017) 3524–3531.
[25] X. Xiao, X. Cheng, S. Su, Q. Mao, K.-C. Chou, ploc-mgpos: incorporate
480
key gene ontology information into general pseaac for predicting subcellu-lar localization of gram-positive bacterial proteins, Natural Science 9 (09) (2017) 330.
[26] X. Cheng, X. Xiao, K.-C. Chou, ploc-meuk: Predict subcellular localiza-tion of multi-label eukaryotic proteins by extracting the key go informalocaliza-tion
485
into general pseaac, Genomics.
[27] P. Horton, K.-J. Park, T. Obayashi, N. Fujita, H. Harada, C. Adams-Collier, K. Nakai, Wolf psort: protein localization predictor, Nucleic acids research 35 (suppl 2) (2007) W585–W587.
[28] H. Chen, N. Huang, Z. Sun, Subloc: a server/client suite for protein
490
subcellular location based on soap, Bioinformatics.
[29] O. Emanuelsson, H. Nielsen, S. Brunak, G. Von Heijne, Predicting sub-cellular localization of proteins based on their n-terminal amino acid se-quence, Journal of molecular biology 300 (4) (2000) 1005–1016.
[30] A. Pierleoni, P. L. Martelli, P. Fariselli, R. Casadio, Bacello: a balanced
495
subcellular localization predictor, Bioinformatics 22 (14) (2006) e408– e416.
[31] T. Tamura, T. Akutsu, Subcellular location prediction of proteins using support vector machines with alignment of block sequences utilizing amino acid composition, BMC bioinformatics 8 (1) (2007) 466.
ACCEPTED MANUSCRIPT
[32] J.-M. Chang, E. C.-Y. Su, A. Lo, H.-S. Chiu, T.-Y. Sung, W.-L. Hsu, Psldoc: Protein subcellular localization prediction based on gapped-dipeptides and probabilistic latent semantic analysis, Proteins: Structure, Function, and Bioinformatics 72 (2) (2008) 693–710.
[33] K.-C. Chou, Impacts of bioinformatics to medicinal chemistry, Medicinal
505
chemistry 11 (3) (2015) 218–234.
[34] K.-C. Chou, Impacts of bioinformatics to medicinal chemistry, Medicinal chemistry 11 (3) (2015) 218–234.
[35] K.-C. Chou, H.-B. Shen, A new method for predicting the subcellular localization of eukaryotic proteins with both single and multiple sites:
510
Euk-mploc 2.0, PLoS One 5 (4) (2010) e9931.
[36] H.-B. Shen, K.-C. Chou, A top-down approach to enhance the power of predicting human protein subcellular localization: Hum-mploc 2.0, Ana-lytical biochemistry 394 (2) (2009) 269–274.
[37] K.-C. Chou, H.-B. Shen, Plant-mploc: a top-down strategy to augment
515
the power for predicting plant protein subcellular localization, PloS one 5 (6) (2010) e11335.
[38] H.-B. Shen, K.-C. Chou, Gneg-mploc: a top-down strategy to enhance the quality of predicting subcellular localization of gram-negative bacterial proteins, Journal of theoretical biology 264 (2) (2010) 326–333.
520
[39] H.-B. Shen, K.-C. Chou, Virus-mploc: a fusion classifier for viral protein subcellular location prediction by incorporating multiple sites, Journal of Biomolecular Structure and Dynamics 28 (2) (2010) 175–186.
[40] X. Xiao, Z.-C. Wu, K.-C. Chou, A multi-label classifier for predicting the subcellular localization of gram-negative bacterial proteins with both
525
ACCEPTED MANUSCRIPT
[41] K.-C. Chou, Z.-C. Wu, X. Xiao, iloc-hum: using the accumulation-label scale to predict subcellular locations of human proteins with both single and multiple sites, Molecular Biosystems 8 (2) (2012) 629–641.
[42] Z.-C. Wu, X. Xiao, K.-C. Chou, iloc-plant: a multi-label classifier for
530
predicting the subcellular localization of plant proteins with both single and multiple sites, Molecular BioSystems 7 (12) (2011) 3287–3297. [43] W.-Z. Lin, J.-A. Fang, X. Xiao, K.-C. Chou, iloc-animal: a multi-label
learning classifier for predicting subcellular localization of animal proteins, Molecular BioSystems 9 (4) (2013) 634–644.
535
[44] X. Xiao, Z.-C. Wu, K.-C. Chou, iloc-virus: A multi-label learning classi-fier for identifying the subcellular localization of virus proteins with both single and multiple sites, Journal of Theoretical Biology 284 (1) (2011) 42–51.
[45] K.-C. Chou, Prediction of protein cellular attributes using pseudo-amino
540
acid composition, Proteins: Structure, Function, and Bioinformatics 43 (3) (2001) 246–255.
[46] X. Wang, H. Li, Q. Zhang, R. Wang, Predicting subcellular localization of apoptosis proteins combining go features of homologous proteins and distance weighted knn classifier, BioMed research international 2016.
545
[47] Y. Xu, X. Wang, Y. Wang, Y. Tian, X. Shao, L.-Y. Wu, N. Deng, Pre-diction of posttranslational modification sites from amino acid sequences with kernel methods, Journal of theoretical biology 344 (2014) 78–87. [48] W. Chen, H. Lin, Recent advances in identification of rna modifications,
Non-Coding RNA 3 (1) (2016) 1.
550
[49] W. Chen, P.-M. Feng, E.-Z. Deng, H. Lin, K.-C. Chou, itis-psetnc: a sequence-based predictor for identifying translation initiation site in hu-man genes using pseudo trinucleotide composition, Analytical biochem-istry 462 (2014) 76–83.
ACCEPTED MANUSCRIPT
[50] L. Nanni, A. Lumini, Genetic programming for creating chous pseudo
555
amino acid based features for submitochondria localization, Amino acids 34 (4) (2008) 653–660.
[51] E. Altman, K. Young, J. Garrett, R. Altman, R. Young, Subcellular lo-calization of lethal lysis proteins of bacteriophages lambda and phix174., Journal of virology 53 (3) (1985) 1008–1011.
560
[52] I. Dubchak, I. B. Muchnik, S.-H. Kim, Protein folding class predictor for scop: approach based on global descriptors., in: Ismb, 1997, pp. 104–107. [53] Z.-C. Li, X.-B. Zhou, Z. Dai, X.-Y. Zou, Prediction of protein structural classes by chous pseudo amino acid composition: approached using con-tinuous wavelet transform and principal component analysis, Amino acids
565
37 (2) (2009) 415.
[54] Y. Liu, W. Gu, W. Zhang, J. Wang, Predict and analyze protein glycation sites with the mrmr and ifs methods, BioMed research international 2015. [55] A. Sharma, K. K. Paliwal, A. Dehzangi, J. Lyons, S. Imoto, S. Miyano, A strategy to select suitable physicochemical attributes of amino acids for
570
protein fold recognition, BMC bioinformatics 14 (1) (2013) 233.
[56] M. Rahimi, M. R. Bakhtiarizadeh, A. Mohammadi-Sangcheshmeh, Ooge-nesis pred: A sequence-based method for predicting oogeOoge-nesis proteins by six different modes of chou’s pseudo amino acid composition, Journal of theoretical biology 414 (2017) 128–136.
575
[57] B. Liu, H. Wu, K.-C. Chou, Pse-in-one 2.0: An improved package of web servers for generating various modes of pseudo components of dna, rna, and protein sequences, Natural Science 9 (04) (2017) 67.
[58] A. Dehzangi, S. Karamizadeh, Solving protein fold prediction problem us-ing fusion of heterogeneous classifiers, International Information Institute
580
ACCEPTED MANUSCRIPT
[59] A. Dehzangi, K. Paliwal, A. Sharma, O. Dehzangi, A. Sattar, A combina-tion of feature extraccombina-tion methods with an ensemble of different classifiers for protein structural class prediction problem, IEEE/ACM transactions on computational biology and bioinformatics 10 (3) (2013) 564–575.
585
[60] K. K. Paliwal, A. Sharma, J. Lyons, A. Dehzangi, Improving protein fold recognition using the amalgamation of evolutionary-based and structural based information, BMC bioinformatics 15 (S16) (2014) S12.
[61] A. Dehzangi, S. Phon-Amnuaisuk, O. Dehzangi, Enhancing protein fold prediction accuracy by using ensemble of different classifiers, Australian
590
Journal of Intelligent Information Processing Systems 26 (4) (2010) 32–40. [62] W.-R. Qiu, B.-Q. Sun, X. Xiao, Z.-C. Xu, J.-H. Jia, K.-C. Chou, ikcr-pseens: Identify lysine crotonylation sites in histone proteins with pseudo components and ensemble classifier, Genomics.
[63] W.-R. Qiu, S.-Y. Jiang, B.-Q. Sun, X. Xiao, X. Cheng, K.-C. Chou,
irna-595
2methyl: Identify rna 2’-o-methylation sites by incorporating sequence-coupled effects into general pseknc and ensemble classifier, Medicinal Chemistry 13 (8) (2017) 734–743.
[64] B. Liu, F. Yang, K.-C. Chou, 2l-pirna: A two-layer ensemble classifier for identifying piwi-interacting rnas and their function, Molecular
Therapy-600
Nucleic Acids 7 (2017) 267–277.
[65] B. Liu, F. Yang, D.-S. Huang, K.-C. Chou, ipromoter-2l: a two-layer predictor for identifying promoters and their types by multi-window-based pseknc, Bioinformatics 34 (1) (2017) 33–40.
[66] A. Ehsan, K. Mahmood, Y. Khan, S. Khan, K. Chou, A novel
model-605
ing in mathematical biology for classification of signal peptides, Scientific Reportsdoi:10.1038/s41598-018-19491-y.
ACCEPTED MANUSCRIPT
[67] K.-C. Chou, Some remarks on protein attribute prediction and pseudo amino acid composition, Journal of theoretical biology 273 (1) (2011) 236– 247.
610
[68] S. F. Altschul, T. L. Madden, A. A. Sch¨affer, J. Zhang, Z. Zhang, W. Miller, D. J. Lipman, Gapped blast and psi-blast: a new generation of protein database search programs, Nucleic acids research 25 (17) (1997) 3389–3402.
[69] R. Heffernan, K. Paliwal, J. Lyons, A. Dehzangi, A. Sharma, J. Wang,
615
A. Sattar, Y. Yang, Y. Zhou, Improving prediction of secondary structure, local backbone angles, and solvent accessible surface area of proteins by iterative deep learning, Scientific reports 5 (2015) 11476.
[70] Y. Yang, R. Heffernan, K. Paliwal, J. Lyons, A. Dehzangi, A. Sharma, J. Wang, A. Sattar, Y. Zhou, Spider2: A package to predict secondary
620
structure, accessible surface area, and main-chain torsional angles by deep neural networks, Prediction of Protein Secondary Structure (2017) 55–63. [71] A. Dehzangi, A. Sharma, J. Lyons, K. K. Paliwal, A. Sattar, A mixture of physicochemical and evolutionary–based feature extraction approaches for protein fold recognition, International journal of data mining and
bioin-625
formatics 11 (1) (2014) 115–138.
[72] A. Dehzangi, K. Paliwal, J. Lyons, A. Sharma, A. Sattar, A segmentation-based method to extract structural and evolutionary features for protein fold recognition, IEEE/ACM Transactions on Computational Biology and Bioinformatics 11 (3) (2014) 510–519.
630
[73] G. Huang, Y. Zhou, Y. Zhang, B.-Q. Li, N. Zhang, Y.-D. Cai, Prediction of carbamylated lysine sites based on the one-class k-nearest neighbor method, Molecular BioSystems 9 (11) (2013) 2729–2740.
[74] C. Huang, J. Yuan, Using radial basis function on the general form of chou’s pseudo amino acid composition and pssm to predict subcellular
ACCEPTED MANUSCRIPT
cations of proteins with both single and multiple sites, Biosystems 113 (1) (2013) 50–57.
[75] K.-C. Chou, H.-B. Shen, et al., Cell-ploc 2.0: An improved package of web-servers for predicting subcellular localization of proteins in various organisms, Natural Science 2 (10) (2010) 1090.
640
[76] K.-C. Chou, H.-B. Shen, Cell-ploc: a package of web servers for predicting subcellular localization of proteins in various organisms, Nature protocols 3 (2) (2008) 153–162.
[77] H.-B. Shen, K.-C. Chou, Gpos-ploc: an ensemble classifier for predicting subcellular localization of gram-positive bacterial proteins, Protein
Engi-645
neering Design and Selection 20 (1) (2007) 39–46.
[78] E. Pacharawongsakda, T. Theeramunkong, Predict subcellular locations of singleplex and multiplex proteins by semi-supervised learning and dimension-reducing general mode of chou’s pseaac, IEEE transactions on nanobioscience 12 (4) (2013) 311–320.
650
[79] J. Lyons, A. Dehzangi, R. Heffernan, A. Sharma, K. Paliwal, A. Sattar, Y. Zhou, Y. Yang, Predicting backbone cα angles and dihedrals from protein sequences by stacked sparse auto-encoder deep neural network, Journal of computational chemistry 35 (28) (2014) 2040–2046.
[80] R. Heffernan, A. Dehzangi, J. Lyons, K. Paliwal, A. Sharma, J. Wang,
655
A. Sattar, Y. Zhou, Y. Yang, Highly accurate sequence-based prediction of half-sphere exposures of amino acid residues in proteins, Bioinformatics (2015) btv665.
[81] G. Taherzadeh, Y. Yang, T. Zhang, A. W.-C. Liew, Y. Zhou, Sequence-based prediction of protein–peptide binding sites using support vector
660
ACCEPTED MANUSCRIPT
[82] G. Taherzadeh, Y. Zhou, A. W.-C. Liew, Y. Yang, Sequence-based predic-tion of protein–carbohydrate binding sites using support vector machines, Journal of chemical information and modeling 56 (10) (2016) 2115–2122. [83] Y. L´opez, A. Dehzangi, S. P. Lal, G. Taherzadeh, J. Michaelson, A.
Sat-665
tar, T. Tsunoda, A. Sharma, Sucstruct: Prediction of succinylated lysine residues by using structural properties of amino acids, Analytical Bio-chemistry.
[84] S. Y. Chowdhury, S. Shatabda, A. Dehzangi, Idnaprot-es: Identification of dna-binding proteins using evolutionary and structural features, Scientific
670
Reports 7 (2017) 14938.
[85] Y. Taguchi, M. M. Gromiha, Application of amino acid occurrence for discriminating different folding types of globular proteins, BMC bioinfor-matics 8 (1) (2007) 404.
[86] A. Dehzangi, K. K. Paliwal, A. Sharma, J. G. Lyons, A. Sattar,
Pro-675
tein fold recognition using an overlapping segmentation approach and a mixture of feature extraction models., in: Australasian Conference on Ar-tificial Intelligence, Springer, 2013, pp. 32–43.
[87] A. Sharma, J. Lyons, A. Dehzangi, K. K. Paliwal, A feature extraction technique using bi-gram probabilities of position specific scoring matrix for
680
protein fold recognition, Journal of theoretical biology 320 (2013) 41–46. [88] A. Dehzangi, S. Phon-Amnuaisuk, Fold prediction problem: The appli-cation of new physical and physicochemical-based features, Protein and Peptide Letters 18 (2) (2011) 174–185.
[89] A. Dehzangi, K. Paliwal, J. Lyons, A. Sharma, A. Sattar, Enhancing
pro-685
tein fold prediction accuracy using evolutionary and structural features, in: IAPR International Conference on Pattern Recognition in Bioinfor-matics, Springer, 2013, pp. 196–207.
ACCEPTED MANUSCRIPT
[90] A. Dehzangi, A. Sattar, Ensemble of diversely trained support vector ma-chines for protein fold recognition., in: ACIIDS (1), 2013, pp. 335–344.
690
[91] S. Wold, J. Jonsson, M. Sj¨orstr¨om, M. Sandberg, S. R¨annar, Dna and pep-tide sequences and chemical processes multivariately modelled by principal component analysis and partial least-squares projections to latent struc-tures, Analytica Chimica Acta 277 (2) (1993) 239–253.
[92] Y. Guo, M. Li, M. Lu, Z. Wen, Z. Huang, Predicting g-protein coupled
695
receptors–g-protein coupling specificity based on autocross-covariance transform, Proteins: structure, function, and bioinformatics 65 (1) (2006) 55–60.
[93] Y. Guo, L. Yu, Z. Wen, M. Li, Using support vector machine combined with auto covariance to predict protein–protein interactions from protein
700
sequences, Nucleic acids research 36 (9) (2008) 3025–3030.
[94] Q. Dong, S. Zhou, J. Guan, A new taxonomy-based protein fold recog-nition approach based on autocross-covariance transformation, Bioinfor-matics 25 (20) (2009) 2655–2662.
[95] J. Wu, M.-L. Li, L.-Z. Yu, C. Wang, An ensemble classifier of support
705
vector machines used to predict protein structural classes by fusing auto covariance and pseudo-amino acid composition, The protein journal 29 (1) (2010) 62–67.
[96] Y.-h. Zeng, Y.-z. Guo, R.-q. Xiao, L. Yang, L.-z. Yu, M.-l. Li, Using the augmented chou’s pseudo amino acid composition for predicting protein
710
submitochondria locations based on auto covariance approach, Journal of theoretical biology 259 (2) (2009) 366–372.
[97] T. Liu, X. Zheng, C. Wang, J. Wang, Prediction of subcellular location of apoptosis proteins using pseudo amino acid composition: an approach from auto covariance transformation, Protein and peptide letters 17 (10)
715
ACCEPTED MANUSCRIPT
[98] G. Taherzadeh, Y. Zhou, A. W.-C. Liew, Y. Yang, Structure-based pre-diction of protein–peptide binding regions using random forest, Bioinfor-matics.
[99] K.-C. Chou, An unprecedented revolution in medicinal chemistry driven
720
by the progress of biological science, Current topics in medicinal chemistry 17 (21) (2017) 2337–2358.
[100] W. Chen, T.-Y. Lei, D.-C. Jin, H. Lin, K.-C. Chou, Pseknc: a flexible web server for generating pseudo k-tuple nucleotide composition, Analytical biochemistry 456 (2014) 53–60.
725
[101] B. Liu, F. Liu, X. Wang, J. Chen, L. Fang, K.-C. Chou, Pse-in-one: a web server for generating various modes of pseudo components of dna, rna, and protein sequences, Nucleic acids research 43 (W1) (2015) W65–W71. [102] W. Chen, H. Lin, K.-C. Chou, Pseudo nucleotide composition or pseknc: an effective formulation for analyzing genomic sequences, Molecular
730
BioSystems 11 (10) (2015) 2620–2634.
[103] V. Vapnik, The nature of statistical learning theory, Springer science & business media, 2013.
[104] C.-C. Chang, C.-J. Lin, Libsvm: a library for support vector machines, ACM transactions on intelligent systems and technology (TIST) 2 (3)
735
(2011) 27.
[105] X. Cheng, X. Xiao, K.-C. Chou, ploc-meuk: Predict subcellular localiza-tion of multi-label eukaryotic proteins by extracting the key go informalocaliza-tion into general pseaac, Genomicsdoi:doi:10.1016/j.ygeno.2017.08. [106] X. Cheng, S.-G. Zhao, X. Xiao, K.-C. Chou, iatc-misf: a multi-label
clas-740
sifier for predicting the classes of anatomical therapeutic chemicals, Bioin-formatics 33 (3) (2016) 341–346.
ACCEPTED MANUSCRIPT
[107] X. Cheng, S.-G. Zhao, X. Xiao, K.-C. Chou, iatc-mhyb: a hybrid multi-label classifier for predicting the classification of anatomical therapeutic chemicals, Oncotarget 8 (35) (2017) 58494.
745
[108] W.-R. Qiu, B.-Q. Sun, X. Xiao, Z.-C. Xu, K.-C. Chou, iptm-mlys: iden-tifying multiple lysine ptm sites and their different types, Bioinformatics 32 (20) (2016) 3116–3123.
[109] K.-C. Chou, Some remarks on predicting multi-label attributes in molec-ular biosystems, Molecmolec-ular Biosystems 9 (6) (2013) 1092–1100.
750
[110] Y. Xu, X.-J. Shao, L.-Y. Wu, N.-Y. Deng, K.-C. Chou, isno-aapair: incor-porating amino acid pairwise coupling into pseaac for predicting cysteine s-nitrosylation sites in proteins, PeerJ 1 (2013) e171.
[111] W. Chen, P.-M. Feng, H. Lin, K.-C. Chou, irspot-psednc: identify re-combination spots with pseudo dinucleotide composition, Nucleic acids
755
research 41 (6) (2013) e68–e68.
[112] W. Chen, H. Tang, J. Ye, H. Lin, K.-C. Chou, irna-pseu: Identifying rna pseudouridine sites, Molecular TherapyNucleic Acids 5 (7) (2016) e332. [113] P. Feng, H. Ding, H. Yang, W. Chen, H. Lin, K.-C. Chou, irna-psecoll:
Identifying the occurrence sites of different rna modifications by
incor-760
porating collective effects of nucleotides into pseknc, Molecular Therapy-Nucleic Acids 7 (2017) 155–163.
[114] W. Chen, P. Feng, H. Yang, H. Ding, H. Lin, K.-C. Chou, irna-ai: identi-fying the adenosine to inosine editing sites in rna sequences, Oncotarget 8 (3) (2017) 4208.
765
[115] B. Liu, S. Wang, R. Long, K.-C. Chou, irspot-el: identify recombination spots with an ensemble learning approach, Bioinformatics 33 (1) (2016) 35–41.
ACCEPTED MANUSCRIPT
[116] Y. Xu, Z. Wang, C. Li, K.-C. Chou, ipreny-pseaac: identify c-terminal cysteine prenylation sites in proteins by incorporating two tiers of sequence
770
couplings into pseaac, Medicinal Chemistry 13 (6) (2017) 544–551. [117] L.-M. Liu, Y. Xu, K.-C. Chou, ipgk-pseaac: identify lysine
phosphoglyc-erylation sites in proteins by incorporating four different tiers of amino acid pairwise coupling information into the general pseaac, Medicinal Chemistry 13 (6) (2017) 552–559.
775
[118] A. Dehzangi, S. Sohrabi, R. Heffernan, A. Sharma, J. Lyons, K. Paliwal, A. Sattar, Gram-positive and gram-negative subcellular localization using rotation forest and physicochemical-based features, BMC bioinformatics 16 (4) (2015) S1.
[119] K.-C. Chou, H.-B. Shen, Recent advances in developing web-servers for
780
EvoStruct-Sub: An Accurate Gram-positive Protein Subcellular
Localization Predictor Using Evolutionary and Structural Features
Md. Raihan Uddin, Alok Sharma, Dewan Md Farid,
Md. Mahmudur Rahman, Abdollah Dehzangi, Swakkhar Shatabda
PII:
S0022-5193(18)30055-9
DOI:
10.1016/j.jtbi.2018.02.002
Reference:
YJTBI 9345
To appear in:
Journal of Theoretical Biology
Received date:
30 December 2017
Revised date:
18 January 2018
Accepted date:
3 February 2018
Please cite this article as: Md. Raihan Uddin, Alok Sharma, Dewan Md Farid, Md. Mahmudur Rahman,
Abdollah Dehzangi, Swakkhar Shatabda, EvoStruct-Sub: An Accurate Gram-positive Protein
Subcel-lular Localization Predictor Using Evolutionary and Structural Features,
Journal of Theoretical Biology
(2018), doi:
10.1016/j.jtbi.2018.02.002
This is a PDF file of an unedited manuscript that has been accepted for publication. As a service
to our customers we are providing this early version of the manuscript. The manuscript will undergo
copyediting, typesetting, and review of the resulting proof before it is published in its final form. Please
note that during the production process errors may be discovered which could affect the content, and
all legal disclaimers that apply to the journal pertain.