School of Economics
UNSW, Sydney 2052
Australia
http://www.economics.unsw.edu.au ISSN 1323-8949 ISBN 978 0 7334 2538 7The Dynamic Effects of Skilled Labour Targeting in Immigration
Programs
Richard G. Harris and Peter E. Robertson
School of Economics Discussion Paper: 2007/21
The views expressed in this paper are those of the authors and do not necessarily reflect those of the School of Economic at UNSW.
The Dynamic Effects of Skilled Labour
Targeting in Immigration Programs
Draft 23 May 07
Richard G. Harris Simon Fraser University
Peter E. Robertson* University of New South Wales
Abstract
We consider the impact of the recent trend in immigration policies towards selecting migrants on the basis of skills. The analysis uses an inter-temporal general equilibrium model with endogenous skill formation. The model is calibrated to a steady state benchmark that represents Australia in 2000-2001. We then consider the impact of the increase in skilled migrants of approximately 20 thousand per year, which corresponds to the increase in flows of migrant Professionals in Australia since 2000. We find that this generates substantial crowding out of the higher Education sector in Australia. Moreover we show that, when this shock is anticipated as a permanent policy change, there is very little net increase in the stock of skilled labour due to falling student enrollments of 12%. Paradoxically, in this case, the decline in students increases the number of unskilled workers in the economy such that the ratio skilled to unskilled workers in the economy actually falls and the skill premium increases.
Keywords Immigration, Human Capital, Computable General Equilibrium Models.
*
Corresponding Author: Peter Robertson, School of Economics, John Goodsell Building, UNSW, Sydney 2052. Email [email protected], Phone. (02) 93853367.
1. Introduction
According to Hatton and Williamson (2006) there is a major difference between the current era of globalization and the Globalization experience of the late 19th Century. Then the focus was on labour flows, whereas now it is mainly about trade. Nevertheless, over the last decade, flows of skilled labour from developing to developed countries have increased dramatically. The increase in labour flows is in part related to increased global supply of labour - particularly with the opening of China, India and the former Eastern Bloc (IMF 2007, Freeman 2006, Salt 1997). In addition, however, there has also been a sharp shift in demand for skilled immigrants in developed market economies. Many developed countries, including Australia, Canada, U.K. and Germany, have sought to take advantage of the foreign supply of skilled workers by tailoring their immigration programs to attract workers with skills (Cobb-Clarke 2004).1 Moreover the USA appears to be moving towards skilled migrants with the Kennedy-Rodino Immigration Act of 1990 and immigration reform currently being considered at various levels of governments in the USA (Antecol et al 2003, The Economist 2007).
An extensive literature exists on the effects of skilled migration exists both from the host and source country perspectives. With respect to the hst country much of the focus is on the effects on factor returns. There is relatively little literature on the effects of the increase in skilled labour inflows on the dynamics effects such as economic growth and the incentives for human capital accumulation. The aim of this paper is to consider these dynamic effects in a general equilibrium setting. In particular we focus on Australia where there has been a dramatic increase in skilled visa migrants in the last decade. The model emphasizes the effects on the accumulation of skills in Australia and other distributional impacts, such as wages and inter-sectoral effects.
We find that a change in the composition of migration towards high skilled labour has a substantial crowding out effect on the education sector in the Host country. Moreover, in the case of a permanent increase in skilled migration, there is almost full crowding out. We find that the inflow of professionals in Australia reduces student enrollments by a similar number resulting in very little increase in the supply of skilled workers. Paradoxically the fall in student enrollments causes an increase in the supply of unskilled labour. Hence an increase in
1
According to Antecol et al (2003) a “points system” for screening a substantial portion of immigrant applicants was introduced in Canada in the late 1960s and a similar system was introduced in Australia in the early 1970s,
skilled labour migrant flows reduces the skill intensity of the economy and raises the skil premium
2. Background
The US literature on immigration has been quite tentative in endorsing skilled immigration as beneficial to the US. In particular Borjas (2006) emphasizes some negative impacts of skilled immigration on skilled wages and crowding out of university places by foreign students.2 Borjas (1995) also emphasizes that the national welfare gains from immigration are very small. However Chellaraj et al (2004) have found evidence that skilled immigrants stimulate innovation in the USA. Likewise Ottaviano and Peri, (2006) and Peri, (2006) argue that, empirically, immigrants in the USA tend to have different skills to domestic labour and hence do not directly compete in the same labour market.
In Australia, however, where the points system has been in place since the 1970s, the literature on skill based immigration is more sanguine. In particular a number studies have indicated that the points system has contributed to better labour market outcomes for migrants (see Withers 1987, Miller 1999, Cobb-Clarke and Connolly 1997).3
Within the broad immigration literature, however, there is relatively little discussion on the longer term effects on the human capital supply in the host country.4 As an interesting point of contrast standard models in the “Brain Drain” literature recognize that the outflow of migrants increases the incentive for human capital investment among workers in the source country,
2
Borjas (2006) such as finds that foreign students studying in the US reduces expected earnings on domestic students by 3-4%. Borjas, (2004) finds that foreign students crowd out domestic student enrollments across institutions.
3
As Cobb-Clarke and Connolly (1997) the skill level under the points system also depends on external factor also and in particular the immigration policies of other countries. See also Withers 1987 and
4
For example in a recent reports by The Productivity Commission (PC) and by the department of Immigration and Multicultural Affairs (2006) into skilled immigration in Australia is perhaps representative of the literature by modeling the accumulation of physical capital as endogenous, but leaving the accumulation of skills as an endogenous variable.
(Bagwati and Hamada 1974 and McCulloch and Yellen 1977).5 The flip side of this – that higher skilled immigrant inflows may crowd out education in the host country – has received very little attention.6 Clearly however it is an important issue in terms of understanding how the mix of skilled workers in the immigration programme affects the structure of the economy and the distribution of factor incomes.
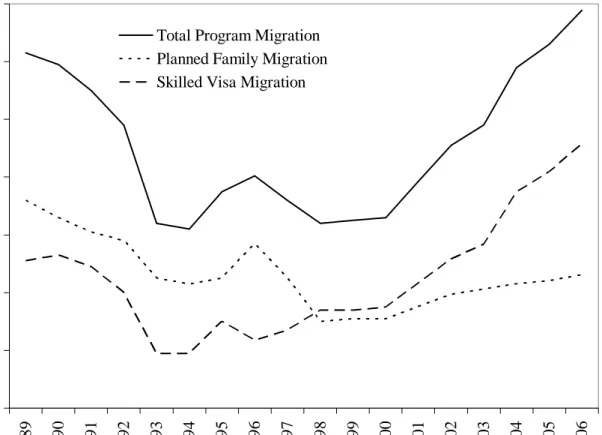
2.1 The skilled visa Programme in Australia
Between 1990 and 1995 Australia halved the intake of permanent migrants from 120 thousand per year to around 60 thousand. Between 2000 and 2006, however, the intake more than doubled to 140 thousand immigrants per year. The remarkable feature of this change is that, while the number of Family Visa entrants stayed roughly constant at the 1999 level, the number of people entering under the skilled migrant quota increased dramatically (Productivity Commission 2006). This change in composition can be seen in Figure 1.7
The expansion of Skilled Visa’s implies an increase in the average skill level of immigrants. According to the Productivity Commission (2006) approximately 65% percent of those entering under this visa category have a bachelors degree, or equivalent, or higher. Although this is a high fraction it is clear that the total intake of skilled visa migrants overstates the impact on domestic skill levels on the ratio of skilled workers in the labour force. To gain a clearer picture of this we consider the net flow of migrants who stated a skilled occupation.
5
More recent models such as Mountford (1997), Beine, Docquier and Rapaport (2001) and Stark and Wang (2002) include human capital externalities such that the expansion of education investment in the home country may have positive net positive benefits. For a survey of this literature see Commander, Kangasniemi and Winters (2002)
6
The possibility of crowding out has been acknowledged in the literature however. Examples in clued Chapman and Withers (2002) and Corden (2003). A rare empirical study is Baker and Wooden (1992). They investigate, but dismiss, the proposition that immigration acts as a deterrent to employer sponsored training programmes for domestic workers in Australia.
7
The official reason given for this policy - to address the so called “skills-shortage” - has been widely commented in Australia. Alternative explanations include political economy motives, such a response to the growth lobby. As discussed above however, there is a general view that skilled immigrants are more desirable as they contribute more to the Australian economy. It is widely argued however that the aggregate gains form natives from immigration are likely to be very small, Borjas (1995). Thus it is perhaps more interesting to consider the distributional impacts of skilled immigration. In particular what effect does it have on wages of skilled natives, on sectoral output shares and in particular, the education sector.
This data, presented in Figure 2 reveals that the increase in net inflow of skilled migrants has almost all been due to a net increase in Professional occupations. 8
In terms of the impact on the labour supply in the economy this represents an increase in the annual intake from 0.10-0.15 % of the labour force in the mid 1990s to 0.28% of the labour force in 2004-2005. This represents an increase of the annual flow of professionals of 15 thousand per year from 1996-2005, or an increase of 20 thousand per year from 1999-2005. As argued above, and shown in Figure 1, however this increase in Professionals mainly represents a change in the composition of immigration flows. In particular the total number of migrants between 1995 and 2006 has been relatively constant.
3. Immigration and Skill Formation
To consider the effect of a change in the skill composition of immigration on human capital formation we employ a multi-sector computable general equilibrium model of growth due to Harris and Robertson (2005). The model has been employed elsewhere to quantify the interactions between trade and economic growth. In particular it incorporates endogenous skill formation. This section describes the human capital dynamics of the model which we modify to incorporate skilled immigration.
First we let the working population, or labour force, at time t be denoted . The additions to the labour force have two sources, births and net immigrant flows. Let be the net immigration rate. Then allowing for retirements the net increase in the labour force is
t P t t t M P m = / t t t t t b m d P P+1 =(1+ + − ) (1.)
where is the birth rate, is the retirement rate. Thus once migrants enter the economy they form part of the representative household. At a point in time the labour force is defined in terms of skilled labour, LS, unskilled labour LU, and students, H.
t b dt t t t t LS LU H P = + + (2.) 8
As stated by Birrell et all, this will exclude the onshore immigrants - students who undertook education in Australia and subsequently obtained a visa as most of these (93%) did not state an occupation when they applied for their visa.
The stock of skilled labour depends on past schooling decisions by unskilled workers and the skill level of past migrant flows. We denote the number of migrants who are skilled as γt Mt, where γt is the fraction of skilled migrants and is assumed to be an exogenous policy instrument. Thus increasing the skilled migrant intake can be interpreted as a change in γt .
The second source of skilled labour is the flow of students graduating each year and entering the skilled labour force. Thus we have Et =Ht/ζ where is the stock of students, is the flow of graduates and
t
H Et
ζ is number of years in school. The updating equation for skilled labour is then t t t t t LS H M d LS LS t + + − = +1 /ζ γ (3.)
3.1 The Steady State
It is useful to briefly consider the steady state constraints on migration and schooling flows. The ratio of skilled labour to population λ =LSt /Pt must be constant on steady state and
hence must grow at the log run population growth rate. Likewise on a steady state the birth rate, b, retirement rate, d, and net migration rate, m, must be constant. Thus dividing (
t
LS
3.) by LSt and re-arranging gives
m b LS M H + = +γ ζ / (4.)
which shows that on a steady state the growth rate of human capital, LS, from migration and education must be constant. From this we can see that on a stead state path an increase in the skill intensity of the migrant population, γ, and no change in the total population growth rate
b+m, then either (i) there must be an increase in LS or (ii) the annual flow of graduates, H/ζ must fall.
This holds irrespective of the nature of the dynamics, ie whether they are forward looking or recursive. Essentially any model of skill accumulation that permits a steady state, must exhibit a similar relationship between skilled labour inflows and education, as long as both types of skilled labour produce the same factor services.9
9
It is worth noting that some recent literature has emphasized the differences in factor services supplied by immigrant labour and domestic labour. This literature mainly refers to unskilled labour however There is no
Noting that M/LS =m/λ is also constant on a steady state we can determine the required investment in schooling for any given demographic and policy variables.
σ ζ λ γ ≡ − + =(b m m/ ) LS H (5.)
3.2 The Stock of Skilled Labour over a Transition
To model the transitional pattern of investment in schooling we consider a representative household who has members who are achieving schooling domestically and abroad. The foreign educated immigrants arrive exogenously from the household view since this is determined by the government’s immigration quota.
Given this arrival of skilled (and unskilled) immigrants the household maximizes the present value of total labour incomes subject to on the job training costs faced by skilled labour. This is given by
[
st t t t t ut t et t t]
t tt u , LS u C H LS u , LU p , AH 0 ) , ( 1 1 − + − +∑
∞ = ρ (6.)where is the after tax skilled wage, is the after tax unskilled wage, is the price of education, is a technology parameter determining the quantity of education required to produce a skilled graduate,
t s
u , uu,t ps,t
t
A
ρ is the households rate of time preference, and is the training costs function which plays the same rule as installation costs in the more general neoclassical model of investment..
) , (Ht LSt
C
We assume initially that on-the-job training costs apply only to domestic graduates and not to immigrants. This might be justified on the basis that skilled immigrants are selected according to particular “skills shortages” and will often have work experience. On the other hand it can be argued that immigrants also face significant training costs associate with language barriers and achieving local certification. An alternative assumption, that both immigrants and local graduates face symmetric on-the-job training costs, is considered below.
Noting that on a steady state we have H =σ LS we initially we assume that the adjustment costs function takes the form
evidence to suggest that, for example, immigrant Doctors perform different services than domestically trained Doctors.
t t t LS LS H C 2 ) ( σ 2 α − = (7.)
Thus the size of the raining costs depend on deviations from the steady state growth path. The Household’s objective is to maximize (6.) subject to (1.), (2.) and (3.). As show in the Appendix this gives the following demand function for education, which express as a demand for the stock of students relative to the current stock of skilled labour.
σ α ζ + ⎟ ⎟ ⎠ ⎞ ⎜ ⎜ ⎝ ⎛Π − − = t s t s t s t u t t t u A p u LS H , , , , / ˆ (8.)
where α is a parameter of the training cost function and is the Lagrange multiplier associated with the constraint (
t
Πˆ
3.) and can be interpreted as the value of an additional unit of skilled labour.
Equation (8.) shows thus shows that, on a transition, variations in demand for students due to immigration will depend only on prices. In particular it will depend on the asset value of skilled labour relative to the current wage rate / , the relative unskilled wage, / , and the costs of education.
t
Πˆ
t s
u , uu,t us,t
Further it may be noted that the adjustment cost parameter α enters in the dominator. Thus if the level of adjustment costs is large the term in brackets will tend to be smaller and
will tend to be constant. Conversely if α is small may deviate a long way from the steady state level during a transition.
t t LS H / t t LS H /
On the supply side education services are produced by a non-traded competitive industry which supplies these services at a supply price . Education can be treated as a non-traded good or traded good. The production function for domestic education services is given by
e p
[
, ( )]
min e e e e M f v y = (9.)This production function is constant returns in the vector of domestic factors and in intermediate good input aggregate
e v e M which is defined by ⎥ ⎥ ⎦ ⎤ ⎢ ⎢ ⎣ ⎡ = = ji ji n j i a Y M ,.. 1 min (10.)
Dual to the value added function is a unit cost function . Factor demands are given by Shepherd's lemma applied to , which are then multiplied by the level of educational output to give total demand. Note that in equilibrium price equal cost in the education sector so that
) ( e e v f ce(w) ) (w ce e y (11.) ⎟⎟ ⎠ ⎞ ⎜⎜ ⎝ ⎛ + − =
∑
j j je e e e s c w a p p (1 ) ( )where the demand price is net of any education subsidy provided at rate . The total amount of educational output is given by
e
p se
H A
ye = s (12.)
Thus the output of the educational sector is measured in units of person schooling per year (or students per year) efficiency adjusted. As economy wide technical change occurs more schooling output is required to produce skilled workers. This is to conform with the dynamic equations relating changes in schooling into units of skilled labour supply.
4. Experiment Design
To broadly capture the changes in Australian immigration policy over the last decade we consider the implications of an increase of 20000 immigrants. This is approximately the difference between the number of skilled immigrants arriving in 2006 and 1999. The change represents and increase of γm = 0.19% of the labour force in 2006. As discussed above, over the longer term this increase has come at the expense of the family visa programme with little change in the total flow of immigrants. Thus the experiments we consider the total migration rate, m, is assumed to be constant since we focus on the skill composition of immigrants rather than the total number of immigrants. The experiment is therefore to increase the fraction of skilled immigrants γ while holding the migration rate, m, and birth rate b constant
It is useful to consider these changes in proportion to the relative stocks of students and skilled workers in Australia. The model is calibrated to an assumed steady state path in 2000. One stylized fact regarding Australian stocks of graduates is that it is not on a steady state. As documented by Dolman, Parham and Zheng (2006) LS/P in Australia is approximately 20% while in the USA it is 30%. In Australia’s case however the stock is growing with more younger aged workers having bachelor degrees than older workers. With retirements Australia
should reach a steady state similar to that of the USA in about 2030. This means that the ratio
H/LS in Australia is falling as the stock is accumulating. Thus the steady state ratios in the benchmark are calibrated using current USA ratios which differ slightly from the current Australian ratios.
It is unclear whether the increase in immigrant flows represents a temporary or a permanent policy change. We therefore first consider the implications of a temporary increase in γm and latter consider the implications of a permanent change. We begin by exploring the impactions of an unannounced increase in skilled immigrants which lasts 15 years, and is phased out by year 20.
5. Results
5.1 Unanticipated increases in skilled migrant quota.
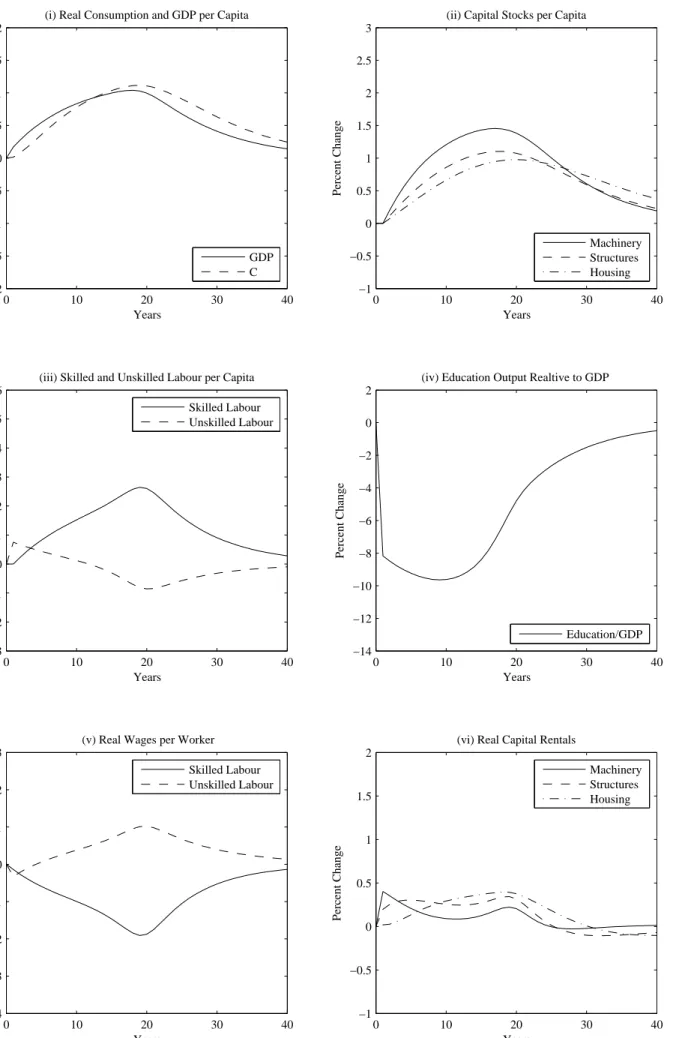
Table 2 reports the effects of an unanticipated increase in skilled immigrants, but with no population change, for a variety of key variables. Further summary graphs showing the full transitional responses are presented in Figure 3. It can be seen that the increase has a fairly substantial effect on consumption and GDP, with GDP rising by 2% over 10 years and consumption by 2.5%. It is widely recognized that these are poor welfare measures however since they average over the impact on natives and the immigrants. In particular much of the “gains” in GDP will be captured by the migrants as payments to their labour services. Likewise it has often been pointed out that the gains to natives will also depend upon the composition of foreign debt and the structure of the tax system and distribution of public assets and public debt. The aim of the current analysis is therefore not to consider the welfare impacts but to consider the impacts different groups within the economy.
Bearing these factors in mind it can be seen that, nevertheless, the impact on GDP mainly reflects the increase in factor supplies. First note that there is a 5% increase in the supply of skilled labour. This is presumably the aim of policy and this increase reflects the skill level of the migrants, all of whom may be thought of as Professionals in this experiment relative to the domestic labour force. Following Krusell et al (2000) we assume a relatively high degree of capital skill complementarity based on their estimates. Hence exogenous increases in the supply of skilled labour are assumed to raise the marginal product of each type of capital. It can be seen in Figure 3 that the 5% increase in skilled workers results in a 2.5-3% increase in
reflects substantial accumulation decisions of domestic residents. Thus while it is difficult to make welfare inferences it is clear that skilled immigration generates economic growth.
This accumulation of capital delivers benefits to skilled and unskilled labour in the longer term. In particular unskilled wages rise by 2% over the twenty year period, though skilled wages fall by 3.5%. This is very much in line with studies such as the Productivity Commission (2006) and EconTech (2006). For example the Productivity Commission found that a doubling of the skilled visa intake would call a 10% fall in the wages of Professionals. The experiment carried out here differences in a number of respects the broad number of skilled immigrants relative to the labour force base is similar.
However there is a very important difference. In this experiment the expansion of skilled immigration does not raise the skilled labour supply proportionally. For example the cumulative effect of the skilled migration increase is to introduce approximately 260 thousand professionals after 20 years. In this experiment however the skilled labour supply has increased only by 187 thousand workers above what it would have been otherwise. This shortfall is due to the cumulative effect of the fall in education investment with student enrollments falling. As can been seen in Figure 3 thee is, upon announcement of the policy, an immediate fall in enrollments of approximately 5% which represents approximately 30 thousand students or 7 ½ thousand graduates per year.
Thus although there is still substantial accumulation of human capital and only a modest “crowding out” of domestic human capital formation this still represents a substantial adjustment for the education sector. 10
5.2 Adjustment costs in the Skilled labour Market.
For the education sector the story from here on only gets worse. The preceding results suggest a small crowding out effect of education. This depends significantly on the on-the-job-training costs that occur in integrating newly skilled workers into their professions. The adjustment process is assumed to be relative to a steady state normal. Thus under normal working conditions flow of graduate recruits is planned for each year, If the there is a large flow however then there are real costs in dealing with the excess. Intuitively, if these training costs
10
The analysis has only considered the arrival of offshore migrants. Recently there has also been a large increase in onshore migrants, most of which are foreign students studying in Australian universities. Thus the increase in foreign students in Australian universities is likely to be an important mitigating factor for the education sector.
are large, firms will be resist having large changes in their graduate recruitment programme. If these adjustment costs are small however firms will be more willing to undertake transitional adjustments. These costs are fully anticipated by households in the educations decisions. In Figure 4 and Table 3 we report the results when the level of adjustment costs is reduced by a ¼ of the preceding results. With lower adjustment costs there is much more adjustment. Hence it can be seen that the effects with respect to education and the stock of skilled workers is now very substantial. In the low adjustment cost case there is a 8% fall in the stock of students on impact which falls to over 9.5% after 10 years. Consequently the effect on skilled labour stocks is now only half as much - 2.5% increase relative to the 5% increase in Figure 1. Likewise there is less accumulation of capital and much smaller changes in returns to labour. That is, with smaller adjustment cots the factor supplies tend to adjust more rather than factor returns.
The overall economy wide results are similar therefore except for the education sector which now bears the brunt of the redistribution impacts of immigration, as opposed to the incomes of skilled workers (professionals). Given the reduction in education outputs the wages of skilled workers only falls approximately 2.3 percent relative to 4.3 percent in the high adjustment cost scenario. Nevertheless the loss of enrollments of nearly 10% represents a truly massive adjustment for the education sector
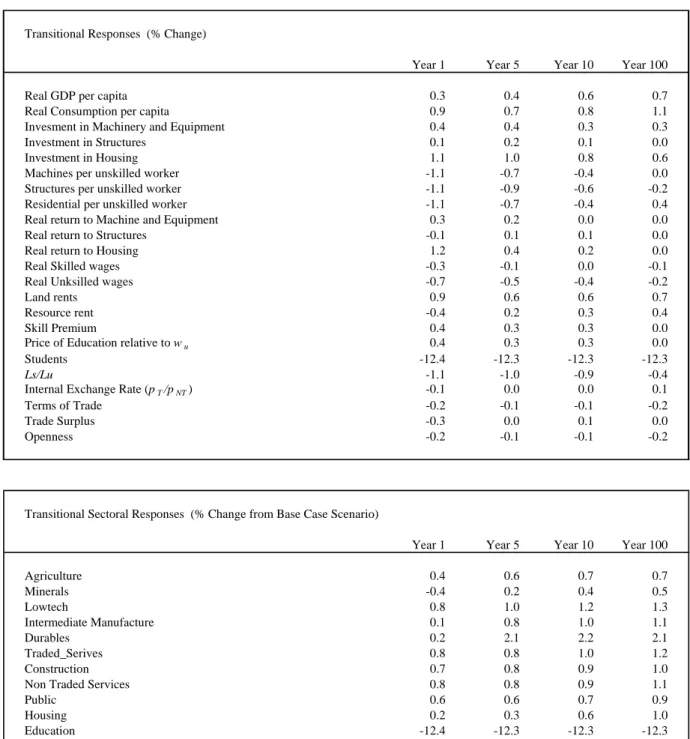
5.3 A Permanent increase in Skilled Migration.
An alternative way to model the increase in migration flows is to consider a permanent increase in the volume of skilled migrants. In particular this is perhaps a more reasonable way to model expectations in so far as there is no announced plan to limit immigration flows in the future.
With a permanent change however the steady state value of σ, in equation (5.), will change. Thus, given an increase in the skilled worker fraction of the labour force of γ m, there will be a long run reduction in H/LS by the amount −γ Mζ . This is an important difference to the preceding temporary cases where the temporary increase in immigration had no impact on the parameters of the adjustment costs function. In this case the function itself must shift. The questions remain however as to whether H adjusts or LS adjusts and how quickly the economy reaches this long run target.
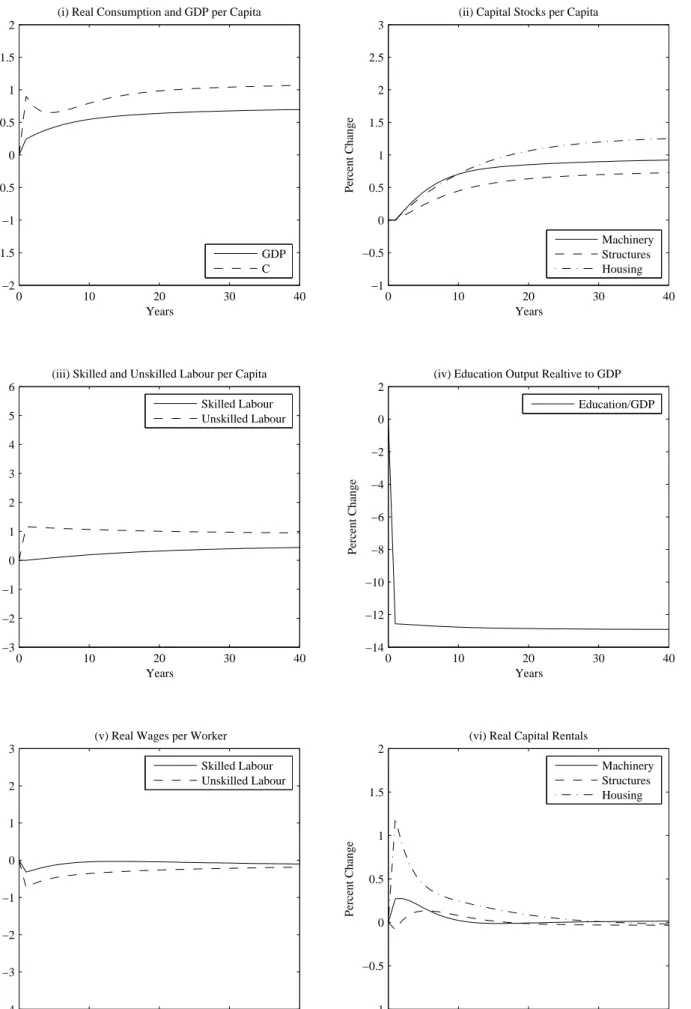
Figure 5 and Table 4 report summary results for the case of a permanent immigration shock. For this experiment we again assume that adjustment costs are relatively large, as in the case 1 presented in Figure 1. It be seen that there is substantial crowding out of the education sector which falls by 12%, and very little change in LS. Moreover this 12% fall is almost all attained on impact! Essentially this is because the adjustment costs cannot be avoided and are incurred immediately due to the shift in the adjustment cost function. Hence there is nothing to gain by delaying the adjustment of the size of the education sector.
A second notable feature of this result is that, whereas the previous experiments revealed a small fall in the relative supply of unskilled workers (because the increased inflow of skilled immigrants is assumed to occur at the expense of unskilled immigrants) that there is now 1.2 percent increase in the stock of skilled labour on impact. This apparent paradox is explained by the fall in student enrollments. All of the students who decide not to undertake domestic education end up as unskilled workers thus increasing the unskilled labour force. Figure 5 thus shows that a rise in skilled immigration reduces the ratio of skilled to unskilled workers and this occurs immediately. In short there is full crowding of the education sector and the decline in higher education enrollments raises the stock of skilled labour and increases in the skill premium. In short the plan to raise skill levels and reduce demand pressure on wages in professional occupations is a spectacular failure.
5. Conclusion
To summarize we have examined the effects of a change in the composition of the flow of immigrants. The data reflect the increase in professionals entering Australia under the expansion of the skilled visa programme that has occurred since 2000. Our focus has been on the effects on factor markets and the accumulation of factor supplies. The main question of inters is, who bears the burden of adjustment to this policy change?
We found that in each case there is substantial crowing out of the domestic education sector. Intuitively skilled immigrants depress wages of skilled occupations. The dynamic analysis shows however that this also reduces the incentive to attain higher education.
In the case of a permanent policy change the increase in skilled migrant flows led to a 12% fall in the education enrollments, a decrease in the ratio of skilled to unskilled workers and an increase in the skill premium. These results contrast with the initial temporary migration policy
changes which indicated much more modest levels of crowding out of education, though even these represent substantial, adjustment costs to the education sector.
In each case the aggregate benefits of immigration are positive. In particular in the case of a permanent shock, there are large consumption gains initially. These essentially reflect the consumption of the savings from higher education tuition by domestic residents. The theme of this analysis however has been on the distributional impacts of skilled immigration as is well known that the redistributive effects are large relative to net welfare gains.
Our results contrast with the existing literature which emphasizes the effects of immigration on wages. The results here show that, with endogenous supplies of skilled labour, the effects of skilled immigration on skilled wages are mitigated. Rather there is a supply response with a reduction in domestic production of skilled labour. This implies however that the burden of adjustment falls on the education sector. Moreover we have found shows that this “crowding out” effect may be very large and represents a very large negative impact on the education sector. Indeed with a permanent shock this “crowding-out” may be so large that skilled immigration effectively reduces the skill intensity of the labour force.
The analysis indicates that skilled immigration programs may not have the desired effect of raising the skill intensity of the labour force, or may only do so in a limited way. Moreover it suggests that, in the absence of other policies, the burden of adjustment falls on the Education
Appendix 1: Symmetric Adjustment Costs.
As suggested above, the model of of-the job training so far assumes that graduates face training costs whereas migrants do not. An alternative assumption is that an increase in any skilled labour in to the Australian labour market, irrespective of whether the new worker is a migrant or a graduate, induces the same type of on-the-job training costs. This gives an adjustment cost function equal to,
t t t LS LS m b M H C 2 ) ) ( ( + − + 2 =α ζγ ζ . (13.)
Thus we now regard the level of training costs as dependent on the flow of graduates and immigrants relative to the flow required for skilled labour stocks to balance with population growth, b+m. In many respects this is a more natural approach than the former one. The demand function becomes
) ( / ˆ , , , , m b LS M u A p u LS H t t s t ed t ed t u t t t − + + ⎟ ⎟ ⎠ ⎞ ⎜ ⎜ ⎝ ⎛Π − − = γ ζ ζ α ζ (14.)
Equation (14.) is the same as (8.) except that in (14.) transitory changes in skilled migration now also shift the demand for schooling function. Moreover for a permanent an unchanging shock to γ will have the same effect on both demand functions. We therefore restrict attention to a temporary shock. The results for a temporary skilled migration with the symmetric adjustment cost function increase are presented in Figure 6. Further results are given in Table 5.
It can be seen that the effect on the Education sector is similar to the case above where the shock was assumed to be permanent, as shown in Figure 5. This reflects the fact that in both cases the influx of skilled migrants has a similar effect on the demand for schooling. Thus the Education sector again contracts approximately 12 percent on impact reflecting the fall in demand by the household for Education. This lasts until the influx ceases after 15 years. As in the case of the permanent shock there is an immediate increase in unskilled labour due to the fall in university enrollments and a mild fall in wages and an increase in the skill premium. Thus allowing for symmetric adjustment costs tends to strengthen the conclusion that the Education sector bears most of the burden of adjustment from skilled migration.
Appendix 2: The Optimal Education Decision
The Household’s objective is to maximize (6.) subject to (1.), (2.) and (3.) .The Lagrangian is
[
st t t t st t s st t t t t t t]
t tt u LS C H LS u LU p A H (LS E M (1 d)LS ˆ )) , ( 1 ( 1 1 1 , , , 0 − − − − Π − − + − + + ∞ =∑
γ ρwhere is the direct cost of schooling. The household takes the relevant prices and wage rates as given. These are determined in a general equilibrium model taking account of inter-temporal preferences, optimal investment decisions and factor supplies, trade flows and world prices. This appendix thus describes the optimal education investment decision part of this general equilibrium model.. A full description of the model is given in Harris and Robertson (2007). t t s t s A H p , ,
The first order conditions associated with the preceding Lagrangian are:
0 ˆ ) , ( , , , − − +Π = − = ∂ ∂ t s t s t u t t H t s t t t tC H LS u p A u E L ζ ζ ζ (15.)
(
(1 ( , )) (1 )ˆ)
0 1 1 ˆ 1 1 , 1 1 1 , − − + − Π = + + Π − = ∂ ∂ + + + + + LS t t ut t t s t t d u LS E C u LS L t t ζ ρ (16.)The adjustment costs depend on deviations from the steady state level of schooling investment.
t t t LS LS H C 2 ) ( σ 2 α − = (17.) This gives ) / ( σ α − = H LS CH (18.)
Rearranging the first FOC gives,
t s s t u H t s t A p u C u , , , ˆ + + = Π ζ (19.)
Now we substitute for CH to get,
σ α ζ + ⎟ ⎟ ⎠ ⎞ ⎜ ⎜ ⎝ ⎛Π − − = t s t s t s t u t t t u A p u LS H , , , , / ˆ (20.)
Steady state
On a balanced growth path the wage rates, , and hence will be growing at the growth rate of productivity. To make the system stationary we define . Equation ( t u u , uu,t Πˆt t s t t A, ˆ ≡Π Π 16.) becomes
(
, 1 , 1 1 1 , 1 , 1 , 1 1)
,tΠt(1+ )= st+ st+ (1− LS( t+ , t+ ))− ut+ ut+ +(1− ) st+ Πt+ s A u C E LS A u d A A t t ζ ρ (21.)On a steady state we have Πt =Πt+1, us,t =us,t+1, uu,t =uu,t+1 and CLS =0. Let the ratio of
efficiency units of unskilled to skilled labour be Au /As ≡τ . Further note that . Hence g A As,t+1/ s,t =1+ * * * * ) 1 )( 1 ( ) 1 ( ) 1 ( + = + − + − + Π Π ρ g us τuu d g Re-arranging gives
[
* *]
* ) 1 )( 1 ( ) 1 ( 1 u s u u g d g τ ρ − − + − + + = Π (22.) or Π* =Δ[
u*s −τu*u]
(23.) where ) 1 )( 1 ( ) 1 ( 1 g d g + − − + + ≡ Δ ρ (24.)Similarly in a steady state, using (19.) or (8.) and (5.) we show that 0 / − , − , = Πt ζ τuut pst (25.) so that (26.) ) ( * * * s u p u + = Π ζ τ
Combining these expressions gives the steady state relationship between the skill premium and the price of education.
(27.) * * * ) ( s u s u p u Δ− τ Δ−ζ =ζ
* * * * ( ) u s u s u p u u + Δ + = ζ (28.)
Thus the skill premium depends on the number of years of schooling it takes to be become “skilled” and the market price of education, which reflects firm’s unit costs and government taxes and subsidies, and the value Δ.
References
Antecol, H., D. A. Cobb-Clark, and S. J. Trejo. 2003. "Immigration Policy and the Skills of Immigrants to Australia, Canada and the United States." Journal of Human Resources 38: 192-218.
Baker, M. and Mark Wooden, (1992) Imigration and Its Impact Australian Economic Review, 25, 2
Beine, M., F. Docquier and Hillel Rapoport (2001): Brain Drain and Economic Growth: Theory and Evidence, Journal of Development Economics, 64, 1: 275-89.
Bhagwati, J. N. and K. Hamada (1974): The brain drain, international integration of markets for professionals and unemployment, Journal of Development Economics, 1, 1: 19-42.
Birrell, Bob, Virginia Rapson and T. Fred Smith Australia’s Net Gains from International Skilled Movement: Skilled Movements in 2004-05 and earlier years, Centre for Population and Urban Research, Monash University, May 2006.
Borjas, George J. (2004) Do Foreign Students Crowd Out Native Students from Graduate Programs? NBER Working Paper No. 10349.
Borjas, George J. (2006) Immigration in High-Skill Labor Markets: The Impact of Foreign Students on the Earnings of Doctorates NBER Working Paper No. 12085.
Chapman, Bruce and Glen Withers, Human Capital Accumulation: Education and Immigration, Australian National University, Center For Economic Policy Research, Working paper 452, 2002.
Corden, W. M. 2003, 40 Million Aussies? The Immigration Debate Revisited, Inaugural Richard Snape Lecture, 30 October 2003, Productivity Commission, Melbourne.
Chellaraj, G., K. E. Maskus, and A. Mattoo The contribution of skilled immigration and International graduate students to u.s. innovation G., Mimeo University Of Colorado 2004 Cobb - Clark, Deborah A. and Connolly, Marie D. “The Worldwide Market for Skilled Immigrants: Can Australia Compete?” International Migration Review, Fall 1997, 31(3), pp. 670-90.
Cobb-Clark, Deborah A., 2004. "Selection Policy and the Labour Market Outcomes of New Immigrants," IZA Discussion Papers 1380, Institute for the Study of Labor (IZA).
Commander, S., M. Kangasniemi et L.A. Winters (2004): The brain drain: curse or boon? A survey of the literature, in R. Badlwin and L.A.Winters, eds.: Challengesto Globalization, The University of Chicago Press, Chapter 7.
Dixon, Peter B., B. R Parmenter, Alan A. Powell and Peter J. Wilcoxin, (1992) Notes and Problems in Applied General Equilibrium Economics, North Holland.
Freeman, R.B., E. Jin, E. and C-Y. Shen. 2004. “Where do New US-Trained Science-
Freeman, Richard B. (2006), “Labor Market Imbalances: Shortages, or Surpluses, or Fish Stories?” paper presented at the Boston Federal Reserve Economic Conference,“Global Imbalances—As Giants Evolve,” Chatham, Massachusetts, June 14–16.
Grubel, H. G. and A. Scott (1966): The international flow of human capital, American Economic Review, 56: 268-74.
Hatton, Timothy J. and Jeffrey G. Williamson (2006) What Determines Immigration's Impact? Comparing Two Global Centuries, NBER Working Paper No. 12414.
Heather Antecol & Deborah A. Cobb-Clark & Stephen J. Trejo, 2004. "Selective Immigration Policy in Australia, Canada and the United States," Brussels Economic Review/Cahiers Economiques de Bruxelles, Editions du DULBEA, Université libre de Bruxelles, Department of Applied Economics (DULBEA), 47 1, 45-56.
Hertel, T. (ed) (1997) Global Trade Analysis, Modeling and Applications, Cambridge University Press, Cambridge UK.
In--ternational Monetary Fund, (2007) World Economic Outlook: Spillovers and Cycles in the Global Economy, International Monetary Fund Publishing Service Washington DC.
Krusell, Per, Lee Ohanian , José-Víctor Ríos-Rull, and Giovanni Violante (2000) “Capital-Skill Complementarity and Inequality”, Econometrica, 68:5 (2000).
McCulloch, Rachel, Yellen, Janet L., (1975) Consequences of a Tax on the Brain Drain for Unemployment and Income Inequality in Less Developed Countries. Journal of Development Economics 2, 3, 249-64.
Miller, Paul W., (1999) Immigration Policy and Immigrant Quality: The Australian Points System. American Economic Review, 89, 2, 192-197.
Mountford, A. (1997): Can a brain drain be good for growth in the source economy?, Journal of Development Economics, 53, 2: 287-303.
Ottaviano, Gianmarco I.P. and Giovanni Peri, (2006) Rethinking the Effects of Immigration on Wages NBER Working Paper No. 12497
Peri, Giovanni (2007) “Immigrants' Complementarities and Native Wages: Evidence from California” NBER Working Paper No. 12956
Productivity Commission, (2006) Economic Impacts of Migration and Population Growth, Productivity Commission, Research Report, 2006
Salt, John, (1997) International movements of the highly skilled. OECD, International Migration Unit, Occasional paper no. 3.
Stark O., Wang Y., (2002). "Inducing Human Capital Formation: Migration as a Substitute for Subsidies". Journal of Public Economics vol. 86(1), 29-46.
Wilcoxen, Peter J. The Effects Of Environmental Regulation And Energy Prices On US Economic Performance, PhD Thesis, Harvard University,1988.
Withers, Glenn. "Immigration and Australian Economic Growth," in Paul Miller and Lyle Baker, eds.. The economics of immigration. Canberra: Australian Govemment Publishing Service, 1987, pp. 29-55.
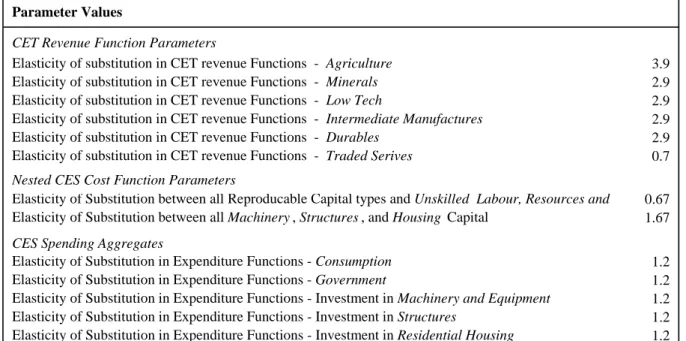
Table 1: Key Parameter Values Parameter Values
CET Revenue Function Parameters
Elasticity of substitution in CET revenue Functions - Agriculture 3.9
Elasticity of substitution in CET revenue Functions - Minerals 2.9
Elasticity of substitution in CET revenue Functions - Low Tech 2.9
Elasticity of substitution in CET revenue Functions - Intermediate Manufactures 2.9
Elasticity of substitution in CET revenue Functions - Durables 2.9
Elasticity of substitution in CET revenue Functions - Traded Serives 0.7
Nested CES Cost Function Parameters
Elasticity of Substitution between all Reproducable Capital types andUnskilled Labour, Resources and 0.67 Elasticity of Substitution between all Machinery, Structures, and Housing Capital 1.67 CES Spending Aggregates
Elasticity of Substitution in Expenditure Functions -Consumption 1.2
Elasticity of Substitution in Expenditure Functions - Government 1.2
Elasticity of Substitution in Expenditure Functions - Investment in Machinery and Equipment 1.2
Elasticity of Substitution in Expenditure Functions - Investment in Structures 1.2
Table 2: Temporary Increase in Skilled Migrant Flows – Low Adjustment Costs
Transitional Responses (% Change)
Year 1 Year 5 Year 10 Year 100
Real GDP per capita 0.1 0.6 1.1 0.1
Real Consumption per capita 0.0 0.1 0.6 0.1
Invesment in Machinery and Equipment 1.2 1.5 1.6 0.0
Investment in Structures 1.2 1.4 1.4 0.0
Investment in Housing 0.5 0.6 0.6 0.0
Machines per unskilled worker -0.5 1.0 2.7 0.1
Structures per unskilled worker -0.5 0.8 2.3 0.2
Residential per unskilled worker -0.5 0.4 1.5 0.1
Real return to Machine and Equipment 0.2 0.2 0.2 0.0
Real return to Structures 0.1 0.3 0.4 0.0
Real return to Housing 0.0 -0.1 0.2 0.0
Real Skilled wages -0.1 -1.0 -1.9 -0.1
Real Unksilled wages -0.2 0.5 1.2 0.1
Land rents -0.1 0.1 0.4 0.0
Resource rent 0.1 0.5 0.8 0.0
Skill Premium 0.2 -1.5 -3.1 -0.2
Price of Education relative to wu 0.2 -0.9 -2.0 -0.1
Students -5.4 -5.0 -4.2 0.1
Ls/Lu -0.5 1.6 3.9 0.2
Internal Exchange Rate (pT/pNT) 0.1 0.2 0.3 0.0
Terms of Trade -0.1 -0.1 -0.1 0.0
Trade Surplus 0.0 0.1 0.1 0.0
Openness 0.1 -0.1 -0.3 0.0
Transitional Sectoral Responses (% Change from Base Case Scenario)
Year 1 Year 5 Year 10 Year 100
Agriculture -0.1 -0.3 -0.5 0.0 Minerals 0.0 0.4 0.6 0.0 Lowtech 0.6 1.2 1.9 0.1 Intermediate Manufacture 0.2 1.0 1.6 0.1 Durables 1.4 3.9 5.3 0.1 Traded_Serives 0.2 0.7 1.4 0.1 Construction 0.7 1.2 1.6 0.1
Non Traded Services 0.2 0.5 1.0 0.0
Public 0.1 0.8 1.7 0.1
Housing 0.0 0.2 0.4 0.1
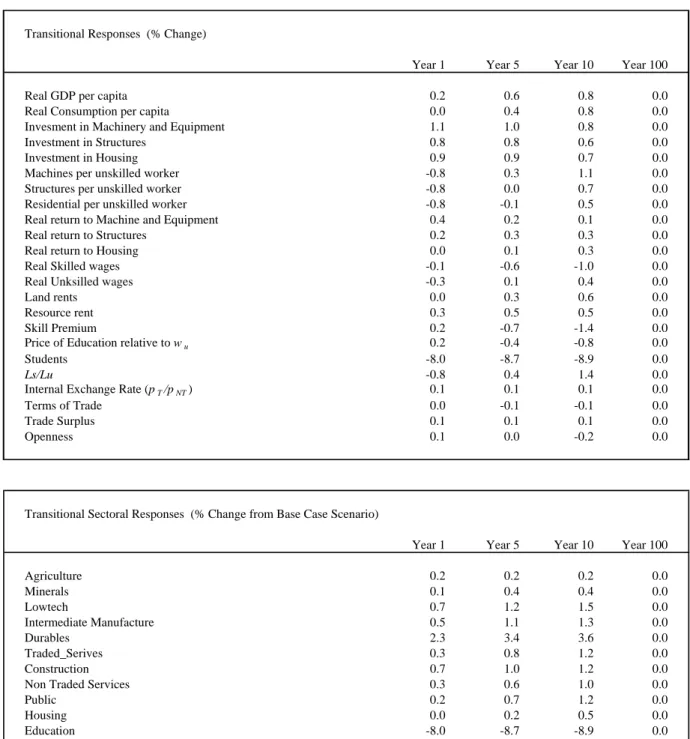
Table 3: Temporary Increase in Skilled Migrant Flows – Low Adjustment Costs
Transitional Responses (% Change)
Year 1 Year 5 Year 10 Year 100
Real GDP per capita 0.2 0.6 0.8 0.0
Real Consumption per capita 0.0 0.4 0.8 0.0
Invesment in Machinery and Equipment 1.1 1.0 0.8 0.0
Investment in Structures 0.8 0.8 0.6 0.0
Investment in Housing 0.9 0.9 0.7 0.0
Machines per unskilled worker -0.8 0.3 1.1 0.0
Structures per unskilled worker -0.8 0.0 0.7 0.0
Residential per unskilled worker -0.8 -0.1 0.5 0.0
Real return to Machine and Equipment 0.4 0.2 0.1 0.0
Real return to Structures 0.2 0.3 0.3 0.0
Real return to Housing 0.0 0.1 0.3 0.0
Real Skilled wages -0.1 -0.6 -1.0 0.0
Real Unksilled wages -0.3 0.1 0.4 0.0
Land rents 0.0 0.3 0.6 0.0
Resource rent 0.3 0.5 0.5 0.0
Skill Premium 0.2 -0.7 -1.4 0.0
Price of Education relative to wu 0.2 -0.4 -0.8 0.0
Students -8.0 -8.7 -8.9 0.0
Ls/Lu -0.8 0.4 1.4 0.0
Internal Exchange Rate (pT/pNT) 0.1 0.1 0.1 0.0
Terms of Trade 0.0 -0.1 -0.1 0.0
Trade Surplus 0.1 0.1 0.1 0.0
Openness 0.1 0.0 -0.2 0.0
Transitional Sectoral Responses (% Change from Base Case Scenario)
Year 1 Year 5 Year 10 Year 100
Agriculture 0.2 0.2 0.2 0.0 Minerals 0.1 0.4 0.4 0.0 Lowtech 0.7 1.2 1.5 0.0 Intermediate Manufacture 0.5 1.1 1.3 0.0 Durables 2.3 3.4 3.6 0.0 Traded_Serives 0.3 0.8 1.2 0.0 Construction 0.7 1.0 1.2 0.0
Non Traded Services 0.3 0.6 1.0 0.0
Public 0.2 0.7 1.2 0.0
Housing 0.0 0.2 0.5 0.0
Table 4: Permanent Increase in Skilled Migrant Inflows
Transitional Responses (% Change)
Year 1 Year 5 Year 10 Year 100
Real GDP per capita 0.3 0.4 0.6 0.7
Real Consumption per capita 0.9 0.7 0.8 1.1
Invesment in Machinery and Equipment 0.4 0.4 0.3 0.3
Investment in Structures 0.1 0.2 0.1 0.0
Investment in Housing 1.1 1.0 0.8 0.6
Machines per unskilled worker -1.1 -0.7 -0.4 0.0
Structures per unskilled worker -1.1 -0.9 -0.6 -0.2
Residential per unskilled worker -1.1 -0.7 -0.4 0.4
Real return to Machine and Equipment 0.3 0.2 0.0 0.0
Real return to Structures -0.1 0.1 0.1 0.0
Real return to Housing 1.2 0.4 0.2 0.0
Real Skilled wages -0.3 -0.1 0.0 -0.1
Real Unksilled wages -0.7 -0.5 -0.4 -0.2
Land rents 0.9 0.6 0.6 0.7
Resource rent -0.4 0.2 0.3 0.4
Skill Premium 0.4 0.3 0.3 0.0
Price of Education relative to wu 0.4 0.3 0.3 0.0
Students -12.4 -12.3 -12.3 -12.3
Ls/Lu -1.1 -1.0 -0.9 -0.4
Internal Exchange Rate (pT/pNT) -0.1 0.0 0.0 0.1
Terms of Trade -0.2 -0.1 -0.1 -0.2
Trade Surplus -0.3 0.0 0.1 0.0
Openness -0.2 -0.1 -0.1 -0.2
Transitional Sectoral Responses (% Change from Base Case Scenario)
Year 1 Year 5 Year 10 Year 100
Agriculture 0.4 0.6 0.7 0.7 Minerals -0.4 0.2 0.4 0.5 Lowtech 0.8 1.0 1.2 1.3 Intermediate Manufacture 0.1 0.8 1.0 1.1 Durables 0.2 2.1 2.2 2.1 Traded_Serives 0.8 0.8 1.0 1.2 Construction 0.7 0.8 0.9 1.0
Non Traded Services 0.8 0.8 0.9 1.1
Public 0.6 0.6 0.7 0.9
Housing 0.2 0.3 0.6 1.0
Table 5: Temporary Increase in Skilled Migrant Flows – Symmetric Adjustment Costs
Transitional Responses (% Change)
Year 1 Year 5 Year 10 Year 100
Real GDP per capita 0.3 0.5 0.5 0.0
Real Consumption per capita 0.1 0.6 0.9 0.0
Invesment in Machinery and Equipment 0.9 0.4 0.1 0.0
Investment in Structures 0.4 0.1 -0.2 0.0
Investment in Housing 1.2 1.0 0.7 0.0
Machines per unskilled worker -1.1 -0.6 -0.4 0.0
Structures per unskilled worker -1.1 -0.8 -0.7 0.0
Residential per unskilled worker -1.1 -0.7 -0.3 0.0
Real return to Machine and Equipment 0.7 0.1 0.0 0.0
Real return to Structures 0.4 0.2 0.1 0.0
Real return to Housing 0.1 0.4 0.4 0.0
Real Skilled wages -0.3 -0.1 -0.1 0.0
Real Unksilled wages -0.5 -0.4 -0.4 0.0
Land rents 0.2 0.5 0.7 0.0
Resource rent 0.5 0.3 0.2 0.0
Skill Premium 0.2 0.3 0.3 0.0
Price of Education relative to wu 0.3 0.3 0.2 0.0
Students -12.2 -12.3 -12.3 0.0
Ls/Lu -1.1 -1.0 -0.8 0.0
Internal Exchange Rate (pT/pNT) 0.1 0.0 0.0 0.0
Terms of Trade 0.0 -0.1 -0.1 0.0
Trade Surplus 0.2 0.1 0.0 0.0
Openness 0.2 0.0 -0.1 0.0
Transitional Sectoral Responses (% Change from Base Case Scenario)
Year 1 Year 5 Year 10 Year 100
Agriculture 0.5 0.6 0.7 0.0 Minerals 0.4 0.3 0.2 0.0 Lowtech 1.0 1.1 1.1 0.0 Intermediate Manufacture 1.0 1.0 0.9 0.0 Durables 3.6 2.5 1.8 0.0 Traded_Serives 0.5 0.8 1.0 0.0 Construction 0.8 0.9 0.8 0.0
Non Traded Services 0.4 0.8 0.9 0.0
Public 0.4 0.6 0.7 0.0
Housing 0.0 0.3 0.6 0.0
Figure 1. Program Immigration Flows 0 20000 40000 60000 80000 100000 120000 140000 1989 1990 1991 1992 1993 1994 1995 1996 1997 1998 1999 2000 2001 2002 2003 2004 2005 2006
Total Program Migration Planned Family Migration Skilled Visa Migration
Figure 2. Net Flows of Skilled Immigrants stating an Occupation 0 0.001 0.002 0.003 0.004 0.005 1996 1997 1998 1999 2000 2001 2002 2003 2004 2005
Net Arrivals Stating an Occupation
Net Addition Of Professionals
0 10 20 30 40 −2 −1.5 −1 −0.5 0 0.5 1 1.5 2
(i) Real Consumption and GDP per Capita
Years Percent Change GDP C 0 10 20 30 40 −1 −0.5 0 0.5 1 1.5 2 2.5 3
(ii) Capital Stocks per Capita
Years Percent Change Machinery Structures Housing 0 10 20 30 40 −3 −2 −1 0 1 2 3 4 5 6
(iii) Skilled and Unskilled Labour per Capita
Years Percent Change Skilled Labour Unskilled Labour 0 10 20 30 40 −14 −12 −10 −8 −6 −4 −2 0 2
(iv) Education Output Realtive to GDP
Years Percent Change Education/GDP 0 10 20 30 40 −4 −3 −2 −1 0 1 2 3
(v) Real Wages per Worker
Years Percent Change Skilled Labour Unskilled Labour 0 10 20 30 40 −1 −0.5 0 0.5 1 1.5 2
(vi) Real Capital Rentals
Years
Percent Change
Machinery Structures Housing