SRI International
1100 Wilson Boulevard, Suite 2800 ! Arlington, VA 22209-3915 ! 703-524-2053 ®
•
May 2003
Effects of Using Instructional Technology in Elementary
and Secondary Schools: What Controlled Evaluation
Studies Say
Final Report
Prepared by:
James A. Kulik
Consultant to SRI International
This literature review was prepared by James A. Kulik of the University of
Michigan, as a consultant to the Science and Technology Policy Program
of SRI International, Arlington, Virginia.
Funding was provided by the National Science Foundation. Any opinions,
findings, and conclusions or recommendations expressed in this material
are those of the author and do not necessarily reflect the views of the
National Science Foundation.
This report and related issue briefs are available at:
http://www.sri.com/policy/csted/reports/sandt/it
Copyright © 2003 SRI International
Questions or comments may be addressed to:
James Kulik, at
[email protected]
, or
Lori Thurgood, at
[email protected]
ii
Contents
CONTENTS ... II TABLES... III EXECUTIVE SUMMARY ... IV INTRODUCTION... 1BACKGROUND AND METHODS... 6
INTEGRATED LEARNING SYSTEMS ... 16
LEARNING TO READ BY WRITING ... 27
READING MANAGEMENT ... 34
WORD PROCESSING AND COMPUTER ENRICHMENT ... 39
MICROCOMPUTER–BASED LABORATORIES ... 47
TUTORIALS AND SIMULATIONS... 52
CONCLUSION ... 60
Tables
Table 1. Achievement effect sizes for computer-based applications of different types at different instructional levels, as reported in 8 meta-analytic studies published before 1990 ... 8 Table 2. Achievement effect sizes for 6 types of computer-based applications, calculated from
evaluation studies published before 1990 ... 10 Table 3. Achievement effects for 8 categories of instructional innovations, calculated from
meta-analytic reports published before 1990... 12 Table 4. Number of evaluation studies reviewed in this report, by program type... 15 Table 5. Study features and effect sizes in 7 evaluation reports on integrated learning systems
(ILSs) in mathematics ...18 Table 6. Study features and effect sizes in 9 evaluation reports on integrated learning systems
(ILSs) in mathematics and reading ... 21 Table 7. Study features and effect sizes in 12 evaluation reports on Writing to Read (WTR) ... 29 Table 8. Study features and effect sizes in 6 evaluation reports on the Accelerated Reader (AR)
reading management program ... 36 Table 9. Study features and effect sizes in 10 reports on word processing and computer enrichment
effects on student writing ...43 Table 10. Study features and effect sizes in 8 evaluation reports on microcomputer-based
laboratories (MBLs) ... 49 Table 11. Study features and effect sizes in 9 evaluation reports on computer tutorials ... 54 Table 12. Study features and effect sizes in 6 evaluation reports on computer simulations... 57
iv
Executive Summary
Access to technology has grown rapidly in American schools during the last decade. Today, nearly all schools own computers and have access to Internet resources, and students are using school computers in more ways than ever before. And yet controversy still swirls around the use of computers in schools. At the eye of the storm are questions about effectiveness. Are schools doing a better job because of their embrace of technology? Can schools improve their teaching effectiveness by investing more heavily in technology? How can schools best use technology? Questions spring up on all sides.
To answer these questions, this report reviews findings from controlled evaluations of technology applications in elementary and secondary schools. Not reviewed in this report are theoretical works, case studies, policy and cost analyses, and other studies that investigate
learning processes or social dimensions of technology without measuring learning outcomes. The report uses two different review methods for the literature covered, one method for evaluation studies published since 1990 and another for earlier evaluation studies. Reviewers have not often visited the instructional technology literature of the 1990s, and they have not yet given the studies from this decade the careful scrutiny they deserve. This report, therefore, provides information on features and results in studies published since 1990 located through computer searches of library databases. There is little need, however, to take a magnifying glass to the evaluation literature of the 1970s and 1980s. More than a dozen individuals or groups have already written reviews of this literature, and these reviews provide a firm ground for conclusions about
evaluation results of the 1970s and 1980s. Overall, therefore, this report focuses on studies published since 1990 and on reviews of studies published before 1990.
Like most recent reviews on technology applications in education, this report uses effect-size measures to summarize findings. An effect effect-size specifies the number of standard deviation units separating the outcome scores of treatment and control groups in a study. Effect sizes can therefore be used to express results from different studies on a single uniform scale of
effectiveness. Effect sizes may be positive or negative. An effect size is positive when the treatment group in a study outperforms the control group, and it is negative when the control group comes out on top. Effect sizes of around 0.2 are usually considered to be small, 0.5 to be moderate, and 0.8 to be large in size (Cohen, 1977). When effect sizes in education are above 0.25, results are considered large enough to be educationally meaningful (Slavin, 1990a).
Reading
Reviewed in this report are 27 controlled evaluation studies on instructional technology and reading. The 27 studies focused on three major applications of technology to reading instruction: (a) integrated learning systems; (b) writing-based reading programs; and (c) reading management programs.
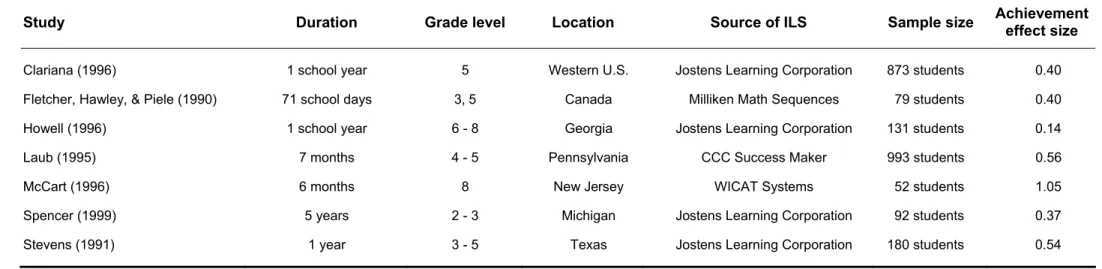
Integrated learning systems. The term integrated learning system (ILS) is used to describe software programs that provide sequential instruction for students over several grades while keeping extensive records of student progress. Most ILS programs use tutorial instruction as a basic teaching methodology, and most provide instruction in the basic skill areas of reading
and mathematics. The Computer Curriculum Corporation and Compass (formerly Jostens Learning Corporation) are among the best known commercial sources for these systems.
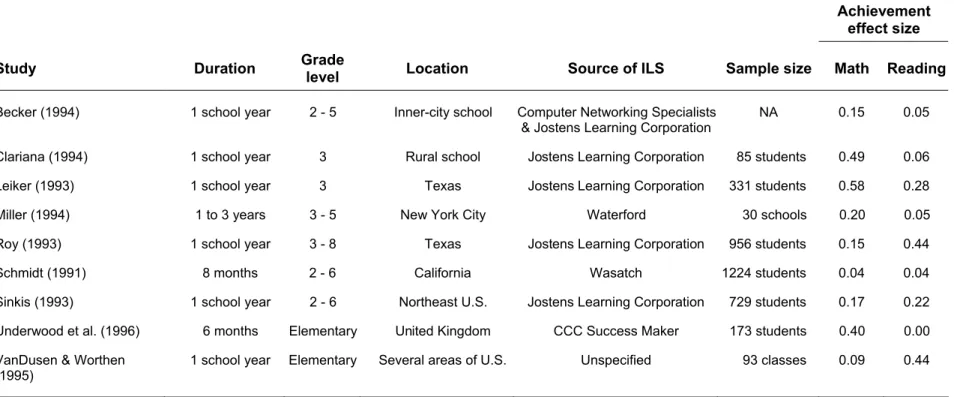
Nine controlled studies conducted during the last decade suggest that ILSs have done little to improve teaching effectiveness of reading programs. In each study, reading scores of children learning with ILSs were as high as reading scores of those studying in traditional classrooms, but results for ILS instruction were significantly better in only three of the nine studies. The median effect of ILS instruction in the nine studies was to raise students reading scores by 0.06 standard deviations, a trivial increment. This means that in a typical study, reading scores of ILS and control groups were nearly identical at the end of the experiment.
These results are consistent with those in Becker’s (1992) review on ILS effectiveness. Becker’s report reviewed results from 32 early studies of ILS effectiveness in basic skills
instruction. Ten of the studies presented reading results separately from other results. The studies included both controlled evaluations and studies without control groups. The median effect size in the ten studies was 0.18. Although this median is slightly higher than the median effect size in recent evaluations of ILS effects on reading, the effect is still too small to be considered
educationally meaningful.
Controlled studies of ILS effects on reading achievement carried out over a period of three decades suggest, therefore, that ILSs do not usually make meaningful contributions to reading improvement in elementary schools. Two points are worth keeping in mind, however. The first is that students do as well with ILS instruction as they do with traditional instruction. In every study, reading performance of ILS students was as good as reading performance of control students. Although ILS instruction did not improve reading results, it did not have a negative effect on student progress in reading. Second, it is possible that ILS effects in reading would be stronger if ILS implementations were better. Research suggests that in typical implementations students spend only 15% to 30% of the recommended amount of time on ILS instruction and that ILS effects would be greater if schools would allot more time to ILS instruction (Van Dusen & Worthen, 1995). Research also suggests that ILS effects would be greater if students worked on computers in pairs rather than as single learners.
Writing-based reading programs. Writing to Read (WTR) is a program that attempts to teach young children to read by stimulating them to write. The program is based on the premise that young children can learn to write in some fashion whatever they can say, and having learned to write, the children can then learn to read what they and others have written. The IBM
Corporation became a major developer of the program during the 1980s, and in 1984 IBM released the first version of WTR. IBM released the current version of the program, called Writing to Read 2000, in 1991.
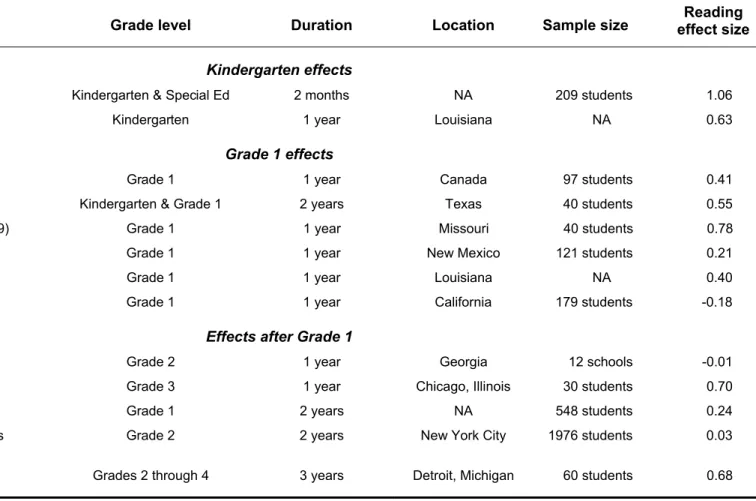
Twelve evaluation studies conducted during the past decade found that WTR effects were large in kindergartens, moderate in size in Grade 1, and small in grades beyond Grade 1.
• Two studies that investigated WTR effects at the end of kindergarten found strong
positive results. The average effect of WTR in the two studies was to increase scores on reading tests by 0.84 standard deviations, equivalent to a boost from the 50th to the 80th percentile.
• Grade 1 implementations produced medium-size effects. The average effect of WTR in six studies was to increase reading scores in the first grade by 0.40 standard deviations, equivalent to a boost in scores from the 50th to the 66th percentile.
vi
• Five studies examined WTR effects in grades beyond Grade 1. Two of the studies found
strong positive WTR effects, but three studies reported small or trivial effects. The median effect of WTR in the five studies was to increase reading scores by 0.25 standard deviations, equivalent to a boost in scores from the 50th to the 60th percentile.
A very different picture emerged from a review of WTR evaluations conducted a decade ago by Slavin (1990a). Slavin examined 21 studies of kindergarten effects, 13 studies of Grade 1 effects, and 4 follow-up studies of effects beyond Grade 1. The review was notable for its lack of positive conclusions. Overall, Slavin found no credible evidence for WTR effects in
kindergartens, in first grades, or in grades beyond first.
It is impossible to say with certainty why early and later evaluation results on WTR differ so strikingly. One possibility is that later implementations of WTR were more adequate than earlier implementations. Another possibility is that later evaluations were better designed and analyzed. Whatever the explanation for the failure to find strong results in early evaluations of WTR, the fact remains that WTR has a good record of effectiveness in recent evaluation studies.
Reading management programs. Reading management programs, such as Accelerated Reader (AR), help students make book selections and then test the students on their
understanding of what they have read. Evaluators have carried out both statewide correlational studies and controlled studies of AR during the past decade.
Three statewide correlational studies showed that reading scores were higher at schools that owned AR. The three studies examined reading scores in (a) 6000 schools in Texas; (b) 740 schools in Tennessee; and (c) 500 schools in Illinois. The significant correlation between AR-ownership and reading achievement does not prove that use of AR causes reading scores to go up. Mathematics and science scores were also higher at AR-owning schools, and so it is possible that some other factor produced the correlation between AR-ownership and school achievement. For example, AR purchases might be more frequent and test scores higher at schools with high parental involvement.
Results of three controlled comparisons, however, also suggest that AR has positive effects on students’ reading development. One of the studies found a strong AR effect; one found a moderate-size effect; and one found a trivial effect. Median AR effect in the three studies was an increase in reading test scores of 0.43 standard deviations, equivalent to an increase from the 50th to the 67th percentile. These results suggest that AR helps students improve their reading skills, but the results are not conclusive. Too few controlled studies of AR are available for firm conclusions, and further controlled evaluation studies of AR are needed.
Writing
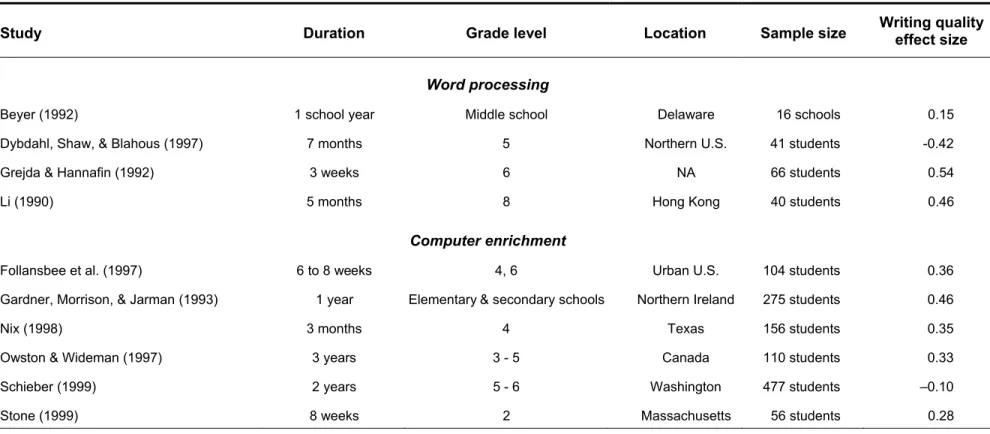
Also reviewed in this report are 12 controlled studies of technology effects on student writing. The 12 studies fall into three categories: (a) word processing studies; (b) studies of computer writing prompts; and (c) studies of computer enrichment.
Word processing. Studies of word processing effects on writing began to appear in the education literature during the 1980s. In a typical study, students in an experimental group wrote their compositions on word processors while control students wrote with paper and pencil. After several months of this experimental treatment, students in both groups wrote compositions under common conditions.
In 1993 Bangert-Drowns wrote the first meta-analytic review of studies of word
processing. The review covered 20 studies of overall writing quality. Ten of these studies were conducted in elementary and secondary schools. The median effect of word processing in these 10 studies was an increase in ratings of writing quality of 0.28 standard deviations. Four
evaluation studies from the past decade also examined word processing effects on writing skills. In three out of the four studies, word processing produced significant positive effects on student writing skills. In the remaining study, however, writing with word processors had a significant negative effect on student writing skills. The median effect in the four studies was to increase writing skill, as measured by ratings of quality of their compositions, by 0.30 standard deviations.
For two decades, then, evaluation studies have been reporting that students who use word processors for writing compositions demonstrate superior writing skills in later follow-up tests of writing skills. Still, word processing effects are usually small. In a typical study, word
processing raises writing scores by around 0.3 standard deviations, equivalent to an increase from the 50th to the 62nd percentile. In addition, increases in writing skill are not an invariable effect of word processor use. Overall, therefore, schools have usually, but not always, helped students to develop better writing skills by teaching them to write their compositions with word processors.
Computer writing prompts. Researchers have modified standard word processing programs to provide writing prompts while students are composing with the programs. The prompts may focus on writing mechanics, or they may provide guidance in development of new ideas. In his 1993 review of word processing research, Bangert-Drowns described two studies that suggested that these processing-plus-prompting programs might be more useful in instruction than standard word processing programs are. Both studies found positive effects from prompting, and Bangert-Drowns concluded that prompts could amplify the benefits of ordinary word
processing.
Two studies carried out during the past decade advanced our knowledge of computer writing prompts. In one of the studies, students who received unsolicited prompts wrote better essays than control students did, but students who received prompts only when they asked for them performed at the same level as control students. In the second study, students received prompts only when they asked for them and did not improve in writing skill as a result of prompting. Together, the studies suggest that the effectiveness of writing prompts may depend on how the writing prompts are presented. Prompting seems to be effective when students receive unsolicited writing prompts, but prompting seems to be ineffective when students must ask the computer for prompts. Clearly, more research is needed to confirm this conclusion.
Computer enrichment. Schools provide students with enriched computer access in a variety of ways. They may let students work on a variety of relatively unstructured exercises in the classroom, including games, simulations, and tutorial programs. Or they may extend student access to Internet resources, or they may provide students with anytime-anywhere laptop access to computers. A common goal in enrichment programs is to help students develop as writers by giving them more opportunities for authentic writing and research.
Evaluators seldom examined the effectiveness of programs of computer enrichment during the 1970s and 1980s. Out of 96 studies described in James A. Kulik’s (1994) review of the literature on instructional technology in elementary and secondary schools, only five
examined effects of computer enrichment. In three of the studies, student test scores were lower in the group that had such computer access. The median effect of computer enrichment in the five studies was to decrease posttest scores by 0.14 standard deviations. An effect size of -0.14 is equivalent to a drop in test scores from the 50th to the 44th percentile.
viii
helped students to improve their writing skills. In the remaining study, computer enrichment had a small, statistically significant, negative effect on student writing. The median effect size of computer enrichment programs in the six studies was an increase in writing scores of 0.34 standard deviations, equivalent to an increase from the 50th to the 63rd percentile.
Mathematics and Science
Also reviewed in this report are 36 controlled studies of technology effects on
mathematics and science learning. The 36 studies covered computer applications in four areas: (a) integrated learning systems in mathematics; (b) computer tutorials; (c) computer simulations; and (d) microcomputer-based laboratories.
Integrated learning systems in mathematics. Sixteen controlled studies conducted during the last decade reported on the effectiveness of integrated learning systems (ILSs) in mathematics. Each of the 16 studies found that mathematics test scores were at least slightly higher in the group taught with an ILS, and in nine of the studies, the ILS effect was large enough to be considered both statistically significant and educationally meaningful. The median ILS effect in the 16 studies was to increase mathematics test scores by 0.38 standard deviations, or from the 50th to the 65th percentile.
In seven of the studies, students received ILS instruction in mathematics only; in the remaining nine studies, students received ILS instruction in both mathematics and reading. ILS effects were greater in the seven studies in which the ILSs were used exclusively for mathematics instruction. ILS effects were lower in the nine studies in which the ILSs were used for both mathematics and reading instruction. It seems possible that students received too little ILS instruction in mathematics when ILS instruction was split between reading and mathematics.
Becker’s 1992 review of studies of ILS effectiveness reported similar results. Becker’s report reviewed results from 32 early studies of ILS effectiveness in basic skills instruction. Eleven of the studies presented mathematics results separately from other findings. The median effect on mathematics achievement in these 11 studies was an increase in test scores of 0.40 standard deviations. An effect size of 0.40 is equivalent to an increase in test scores from the 50th to the 66th percentile. This median is virtually identical to the median ILS effect on mathematics tests in recent evaluations.
Computer tutorials. Teachers have been using computer tutorials in science instruction since the early 1970s. The tutorials usually focus on specific science topics taught in specific courses. These focused programs have proved to be effective in both earlier and more recent evaluation studies.
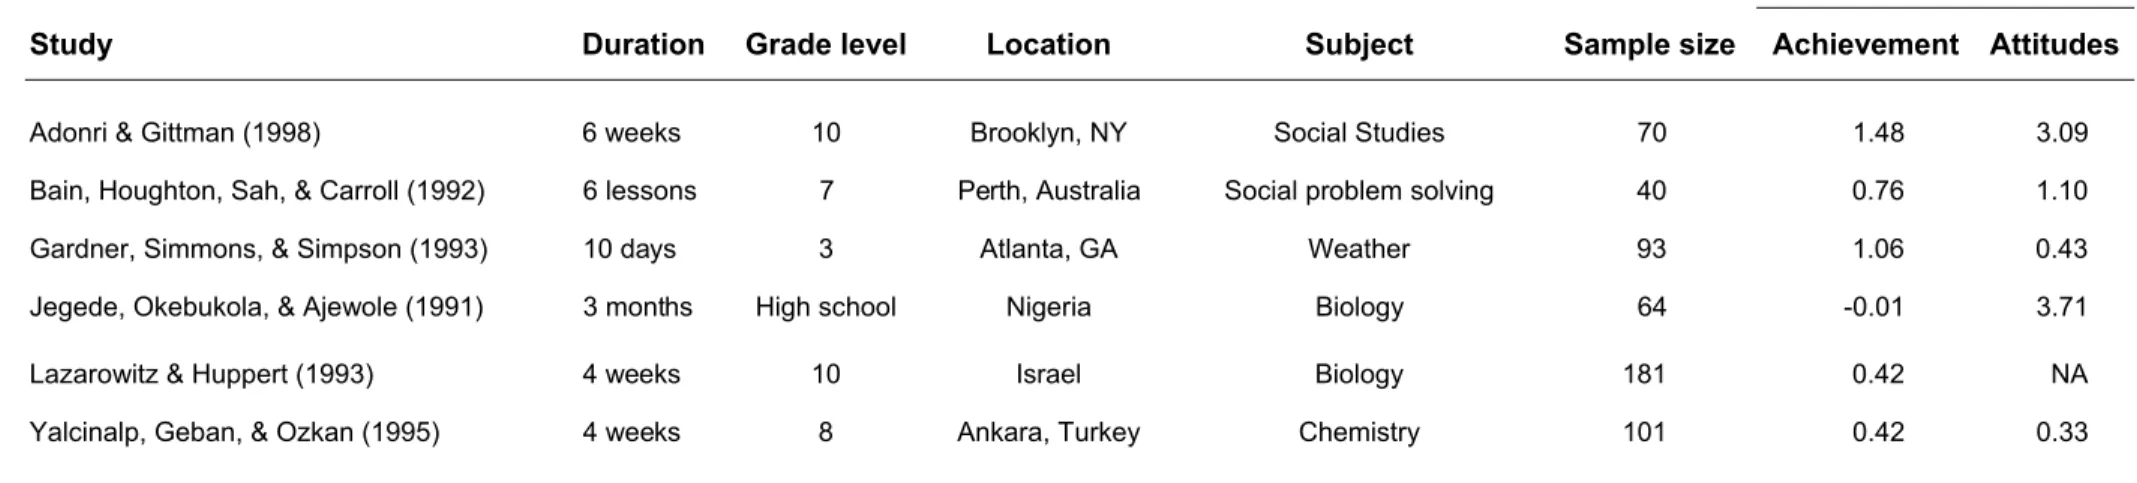
Six studies conducted during the past decade paint a positive picture of computer tutorials in the natural and social sciences. In all but one of the six cases, the effect of computer tutoring was large enough to be considered both statistically significant and educationally meaningful. In the remaining study, the boost from computer tutoring was near zero. In the median case, the effect of computer tutorials was to raise student achievement scores by 0.59 standard deviations, or from the 50th to the 72nd percentile. Tutorial effects on student attitudes toward instruction and subject matter were also strong and positive. In all cases, computer tutoring produced significant positive effects on attitudes. In the median study, the effect of computer tutorials was to raise attitude scores by 1.10 standard deviations.
Evaluation studies carried out during the 1970s and 1980s also found that computer tutoring has positive effects on student learning. A major meta-analytic review (J. Kulik, 1994), for example, reported that the average effect of computer tutorials was to raise student test scores
by 0.36 standard deviations. This is equivalent to a boost in test scores from the 50th to the 64th percentile. These 58 studies included many evaluations of computer tutorials in mathematics and reading but very few evaluations of computer tutorials in science. Too few studies were available in science education, in fact, to warrant separate conclusions about the effectiveness of computer tutorials in natural and social sciences.
Computer simulations. Computer simulations provide science students with theoretical or simplified models of real-word phenomena—for example, a frictionless world where the laws of Newtonian physics are more apparent—and they invite students to change features of the models so that they can observe the results. Science teachers can use simulations to prepare students for future learning, to supplement or replace other expositions of a topic, or to help students integrate facts, concepts, and principles that they learned separately.
Many science educators consider simulation programs to be a real advance over tutorial programs because simulation programs seem to focus on higher-level instructional objectives. Early evaluation studies, however, provided little evidence of improved learning with
simulations. A major meta-analytic review (J. Kulik, 1994) described six simulation studies carried out during the 1970s and 1980s, none of which found a significant positive effect from instructional simulations. Simulation results were negative as often as positive, and were small in size in each of the studies. The median effect size in the six studies was –0.06. This means that students learning with and without simulations scored at nearly identical levels on the relevant tests of science learning.
Six studies published since 1990 painted a more positive picture of simulation effects. Four of the studies found positive effects on student learning, and two studies found negative effects. In the median case, the effect of computer tutorials was to raise student achievement scores by 0.32 standard deviations, or from the 50th to the 63rd percentile.
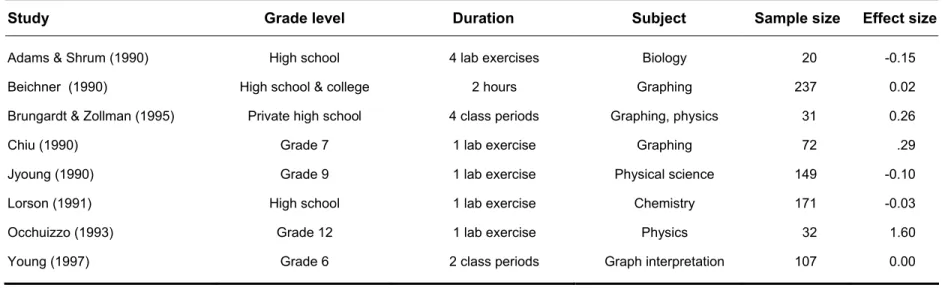
Microcomputer-based laboratories. Microcomputer-based laboratories (MBLs) use electronic sensors to collect data on physical systems, immediately convert the analog data into digital input, and concurrently transform the digital data to a graphical system. As a result, learners in MBLs are able to witness a phenomenon in the laboratory while concurrently viewing the development of a graph describing the phenomenon.
Reviewers who examined the early evaluation literature had a hard time finding studies that showed learning advantages for MBL instruction, however. Mixed evaluation results were a common finding. Eight reports from the last decade confirm the earlier findings. Seven of the eight studies found either small negative or small positive effects of MBL instruction on student learning. The remaining study found a very strong effect of MBL instruction, but the study had a design flaw that might account for the anomalous result. The median of the eight effect sizes was 0.01, a trivial effect. This means that students who learned in MBLs typically performed no better on tests than did students who learned in conventional laboratories.
Conclusion
It is not yet clear how much computer-based programs can contribute to the improvement of instruction in American schools. Although many researchers have carried out controlled evaluations of technology effects during the last three decades, the evaluation literature still seems patchy. For most technologies, results are available only at selected grade levels, in selected subjects, and on selected instructional outcomes. The literature is too uneven for sweeping conclusions about the effectiveness of instructional technology. Nonetheless, results
x
Evaluation studies of the past decade have consistently found, for example, that ILSs make little or no contribution to the improvement of reading programs. Other research suggests, however, that ILSs are usually incompletely implemented. The job for future evaluators is to determine whether fully implemented ILSs will make more of a contribution. Questions also surround WTR programs. WTR has a good record of effectiveness in evaluation studies carried out during the past decade, but WTR has a rather poor record in earlier evaluation studies. Researchers and analysts still have to find an explanation for the difference in results of early and later evaluations of WTR. Finally, several studies found that the reading management program Accelerated Reader may be very helpful to students in both elementary and secondary schools. However, too few experimental studies are available at this point for firm conclusions.
It has become clear during the past decade that computers can be valuable tools in
improving writing skills. Evaluation studies from the 1980s usually found that students who were required to compose on word processors improved in writing skills more than control students did, and evaluation studies from the last decade found similar results. Although effects in most studies of word processing were only moderate in size, the effects were nonetheless large enough to be considered educationally meaningful. In addition, a few studies have found that word processing programs would have greater instructional effects if they could provide writing tips for the students who were using them. Studies from the last decade also show that simply giving students greater access to computers and Internet resources often results in gains in writing skill. Evaluators during the 1980s often reported that such computer enrichment produced only
indifferent results. The failure to find positive effects may have been due to the limited amount of enrichment in the programs of the 1980s or to weaknesses in the evaluation designs in these early studies. Whatever the reason for the poor findings in earlier studies, the picture changed dramatically during the last decade. Most studies carried out during the last decade found that enrichment programs have positive effects on student writing skills.
It is also clear that instructional technology often improves teaching programs in mathematics and the natural and social sciences. ILS programs, which usually rely heavily on tutorial instruction, have been producing positive results in mathematics programs for decades. Computer tutorials in natural and social science classes also have an almost uniformly positive record of effectiveness in the1970s, 1980s, and 1990s. Science educators often think of
simulation programs and microcomputer-based laboratories as advances over tutorial programs. Evaluation results from simulations and MBLs, however, are weaker and less consistent than are the results from tutorial programs. Although simulation programs sometimes improve the effectiveness of science teaching, a number of studies conducted during the 1980s and 1990s found negative effects from simulations. Teachers therefore have to use some care in deciding when to use simulations, which simulations to use, and how to use them. Results from MBLs are usually small, and they are negative as often as positive.
Overall, however, evaluation studies suggest that schools have been more successful in using instructional technology during the past decade than they were in earlier years. The
growing effectiveness of instructional technology should not come as a great surprise. Computers have improved dramatically since they were first used in instruction. Today’s computers are faster, friendlier, and more visually and aurally sophisticated than yesterday’s models. In addition, students are more computer-literate today than they were in years past, and many teachers have become sophisticated users of instructional software. Recent evaluation studies suggest that instructional technology is thriving in this climate and that computers—which have transformed society in so many ways—can also make teaching more effective in elementary and secondary schools.
Introduction
There is no question that access to technology has been growing rapidly in American schools and that we are now at a point where nearly all schools own computers and have access to Internet resources. It is also clear that schools are using instructional technology in more ways than ever before. The statistics on these points are convincing, and no one seriously questions them. And yet controversy continues to swirl around the use of technology in schools. At the eye of the storm are questions about effectiveness. Are schools doing a better job because of their embrace of technology? Can schools improve their teaching effectiveness by investing more heavily in technology? Or are schools misusing technology? Are they using it inequitably? Questions spring up on all sides.
To answer these questions, this report reviews findings from controlled evaluations of technology applications in elementary and secondary schools. Not reviewed in this report are theoretical works, case studies, policy and cost analyses, and other studies that investigate learning processes or social dimensions of technology without measuring learning outcomes. Two different review methods are used for the literature covered—one for evaluation studies of the past decade and another for prior evaluation studies. For the past decade, individual studies are examined closely. For the earlier literature, reviews of earlier reviews are used.
Given the number of reviews already written on effectiveness of instructional technology, it seemed reasonable to adopt this dual methodology. More than a dozen individuals or groups have already written careful reviews of the evaluation literature of the 1970s and 1980s, and one of the reviews alone describes results from more than 100 controlled and quantitative studies (J. Kulik, 1994). There is little need to take a magnifying glass to an area that has already been examined and re-examined in detail. The report's approach therefore is to survey the earlier literature on instructional technology from the shoulders of earlier reviewers.
Studies of instructional technology published since 1990 are as numerous and scattered as earlier studies are, but reviewers have not visited this more recent literature so often. It still requires careful scrutiny. This report therefore examines individual studies published since 1990, not reviews. The report uses an approach that is similar to the meta-analytic approach developed by Glass and his colleagues (Glass, McGaw, & Smith, 1981) to locate studies and describe results. Meta-analytic reviewers use objective procedures to locate as many studies of an issue as possible. They describe features and outcomes of the studies using objective and quantitative methods. Finally, meta-analysts use statistical methods to describe overall findings and to chart the relationships between study features and outcomes.
School Access to Technology
The effectiveness studies that are reviewed in this report were carried out during a decade of rapid growth in school computing (Market Data Retrieval, 1999; Quality Education Data, 1998; U.S. Department of Education, 2002). By 1999 nearly all schools in America owned computers, and more than half of the computers were multimedia models with sound cards and CD-ROM capabilities. In 1999 the ratio of students to computers was at an all-time low of 5.7 to 1. In contrast the ratio of students to computers was 125 to 1 in 1984; 25 to 1 in 1989; 14 to 1 in
2
during the past decade. In 2000, 98% of American schools had Internet access. In contrast, Internet access was available in only 3% of schools in 1989; 7% of schools in 1992; 78% in 1997; 89% in 1998; 95% in 1999; and 98% in 2000.
It would be a mistake to infer from these statistics that students do a lot of their work on computers in American schools. According to the National Center for Education Statistics (U.S. Department of Education, 1998), for example, 11% of fourth graders, 23% of eighth graders, and 16% of eleventh graders reported never using a computer in school in 1996. And only a small percentage of students used computers frequently. Only 10% of fourth graders, 18% of eighth graders, and 18% of twelfth graders reported using a computer every day in their schoolwork. It would also be a mistake to conclude that all students have access to up-to-date computer
technology. While the ratio of students to computers in 1999 was 5.7 to 1, the ratio of students to multimedia computers was 9.8 to 1 and the ratio of students to Internet-wired computers was 13.6 to 1.
Although the computer bandwagon has been rolling steadily along during the last decades, data collected at the end of the century suggest that there is still room for growth in school computing. The majority of students do not use computers regularly in schools. The nation has not reached the Department of Education’s goal of one multimedia microcomputer to five students in every classroom in the nation. Nor has it reached the Department of Education’s goal of having every classroom in every school connected to the Internet. The question of effectiveness therefore still weighs heavily on the minds of policy experts. Will further growth improve school effectiveness? Data on effectiveness can help to guide decisions about future investments in technology.
Student Use of Technology
The growth in school computing since the 1980s is not just a matter of an increase in number of machines. How computers are used in schools has also been changing. At the end of the 1980s, schools were using computers as tutorial devices for basic skills instruction and as objects for study in computer literacy courses. At the end of the 1990s, students were most often using computers as tools for word processing and reference. The shift from computer-as-tutor and computer-as-topic toward computer-as-tool is one of the important developments in the recent story of instructional technology in schools. No single study provides a definitive account of how students have been using computers in schools over time, but a number of surveys provide relevant data. Becker, Ravitz, and Wong’s report (1999) on their recent national survey is one of the key documents. In response to one question in the survey, teachers listed their main
objectives for student use of computers. The objective chosen by most teachers (51%) was to have students find out about ideas and information. The next most popular objectives were to help students express themselves in writing (44%), to help students master skills (37%), and to improve students’ computer skills (32%). Thus teacher objectives emphasized, in order of importance, reference work, word processing, basic skills tutorials, and development of computer literacy. In Becker’s surveys of a decade ago (e.g., Becker, 1991), teachers said that they most often used computers for basic skills training and computer literacy.
In their 1999 survey, Becker and his associates also asked teachers to identify the categories of software that their students were using in school. Word processing and reference software were the most popular categories. About 50% of all teachers reported that their students were using word processing software. Other popular types of software used in schools were CD-ROM (36% of teachers reported student use), World Wide Web (29%), skill practice games (28%), and simulations (23%). Teacher reports on the specific software that they considered
most valuable gave a similar picture of student use of computers. Becker and his colleagues found in 1999 that ClarisWorks (now AppleWorks), an integrated office application, is the program most widely viewed by teachers as valuable for students. Other programs singled out by teachers as especially valuable included another integrated office application (Microsoft Works), a word processing program (Microsoft Word), and a Web browser (Netscape). Other programs that found adherents among a substantial percentage of elementary teachers were the multimedia authoring program Hyperstudio and the reading management program Accelerated Reader.
Another survey asked college-bound seniors about their computer-related experiences (Coley, Cradler, & Engel, 1997). Most students (72%) reported using computers for word processing in schools. About half of the students (51%) reported coursework or experience in computer literacy. Nearly half (44%) had used a computer in an English course. A smaller percentage (27%) used computers to solve math problems. Like Becker’s data, the data of Coley and his associates suggest that computers are today used more often as tools than as tutors.
These data on computer use remind us again of the importance of knowing about the effectiveness of various technological applications. If computers are to be used in schools, they should be used in ways that are helpful to students. But what are the best ways to use computers in teaching? Should students use computers as tutors or as tools? What are the best ways to use computers in tutorial instruction? Which computer tools are most useful? It is difficult to answer such questions without knowing what the evaluation literature says about computer effectiveness.
Equity in Access and Use
It is impossible to discuss instructional technology without raising the question of equity. School access to technology may be increasing rapidly, but is access increasing equally rapidly for rich and poor students and for minority and other students? Are poor and minority students tracked into ineffective uses of computers while affluent, nonminority students use computers in more productive ways?
Recent reports suggest that students from different socioeconomic strata and different racial and ethnic groups have different access to computers. The U.S. Department of
Commerce’s National Telecommunications and Information Administration (NTIA), for
example, has issued several reports recently on a digital divide that separates the information-rich and the information-poor segments of American society (e.g., National Telecommunications and Information Administration, 1995, 1998, 1999, 2000). Information-rich groups include whites, Asians/Pacific Islanders, the more affluent, the more highly educated, and those in dual-parent households. The information-poor include blacks and Hispanics, those with lower incomes and education levels, and those in rural areas or central cities. According to the NTIA’s most recent report Falling Through the Net: Toward Digital Inclusion, the information-poor have recently begun making greater gains, and the digital divide is beginning to narrow.
Nonetheless, the divide is still disturbingly wide. NTIA data reveal, for example, that Internet access was available to 46% of households earning $35,000 to $49,000, to 61% of households earning $50,000 to $74,999, and to 78% of households earning above $75,000. There is also a racial and ethnic divide. Asians and Pacific Islanders have the highest level of home Internet access at 57%. Blacks and Hispanics have the lowest level of access at 24%. There is also a large gap in computer ownership for different income groups and racial and ethnic groups.
4
computer, compared to 6.2 for schools in less affluent areas (Market Data Retrieval, 1999). Schools in affluent areas also have greater Internet access (U.S. Department of Education, 2002). In 2000 Internet access was available in 94% of schools with a high percentage of students qualifying for the free lunch program and in 99% of schools with few students eligible for the free lunch program. This gap appears to be closing, however. In 1998, 79% of schools with high student need had Internet access, compared to 92% of schools with low student need. In 1999, 89% of schools with high need had Internet access, compared to 95% of schools with low need. The relationship is less clear between school computer usage and such factors as student gender, socioeconomic status, and minority status. On the one hand, U.S. Census data from households suggest that inequities exist (U.S. Department of Education, 2002). According to census data, students in higher-income families are more likely to use computers in schools; white students are more likely than black and Hispanic students to use computers; and male students are somewhat more likely than females to use computers in school. Teacher data from the National Assessment of Educational Progress (NAEP) show the same pattern (Coley et al., 1997). Student data from the NAEP, however, show the opposite pattern of relationships. For example, Coley and his colleagues summarized what students said about their computer use in a recent NAEP reading assessment. Students from low-income families were more likely than students from high-income families to report frequent computer use in schools. Black and Hispanic students were more likely than white and Asian students to report frequent computer use in schools.
A report from the Educational Testing Service (ETS), authored by ETS researcher Harold Wenglinsky (1998), suggests that the greatest inequities occur in how students use computers in schools rather than in how often they use them. The report presents a correlational analysis of data from the 1996 NAEP mathematics assessment for fourth and eighth graders. Wenglinsky found that the following variables were significantly intercorrelated: mathematics achievement, minority status, and student-reported use of computers in lower- vs. higher-order tasks.
Wenglinsky classified drill-and-practice programs as lower-order activities. He classified mathematics learning games as a higher-order activity for fourth graders and simulations and applications as higher-order activities for eighth graders.
Wenglinsky found, for example, that black, poor, urban, and rural eighth graders were less likely than other eighth graders to engage in higher-order uses of computers, and they were more likely to engage in lower-order uses. Black, poor, urban, and rural students were also less likely to be high performers on the mathematics assessments. Wenglinsky suggested that white students from affluent homes may get an extra boost from the way computers are used in their classes, whereas minority students from less affluent homes may get short-changed.
This conclusion should be considered suggestive rather than definitive. First,
Wenglinsky’s report is based on a correlational analysis, and it is hazardous to draw inferences about causes from correlational data. Wenglinsky himself wrote that a correlation between type of computer use and mathematics achievement is open to several interpretations. The correlation may indicate, as Wenglinsky supposes, that higher-order computer programs promote higher levels of achievement in children, but the correlation may also indicate that high-achieving students are more likely than low-achievers to use school computers for higher-order tasks. Second, Wenglinsky’s analysis is based on children’s self-reports on their use of computers in schools. Self-report data from children on this topic do not agree in important ways with reports from parents and teachers. Wenglinsky’s analysis does not take into account this anomaly in his data.
Overall, the data show that schools with minority and less affluent students have fewer computers and less Internet access than other schools have. Although the inequities are not so strong as those existing in homes, the inequities are nonetheless real and significant. The data on how often children use computers in school are less clear. Survey data from parents and teachers
suggest that inequities exist in amount of computer use, but self-report data from students do not agree. Finally, it is possible that inequities exist in the way that students experience school computers. White students from affluent homes may use computers for open-ended problem solving, while minority students from poor homes use computers for drill-and-practice and rote learning. The data on inequities in the way that students use computers is suggestive only.
Like discussions of technology access and use, discussions of equity lead eventually to the question of effectiveness. If computer technology improves educational effectiveness, then it is important that technology be distributed equally among schools in rich and poor areas and among schools with many and few minority children. It is clearly inequitable for poor and minority children to have less access to a valuable resource than other children do. Equity also demands that students from information-rich and information-poor homes be able to use school computers in the same ways.
Purpose
The purpose of this report is to describe the current state of knowledge provided by controlled evaluations studies of instructional technology in elementary and secondary schools. The report is based on individual studies of instructional technology published during the 1990s and on reviews of studies published before 1990. The next section of this report gives an
overview of findings from studies carried out before 1990. The six sections that follow then look in greater depth at specific technological applications evaluated during the 1990s. Finally, a concluding section summarizes the review results.
It is important to note that this review will not cover all evaluation studies of instructional technology. Nor will it cover all studies that have been called evaluations. The focus throughout this report will be on controlled and quantitative evaluation studies. Such studies do not address all questions relevant for an assessment of the promise of new technologies. Theoretical works, qualitative case studies, policy studies, and anecdotal reports may address interesting evaluation questions, but it is beyond the scope of this report to review such works. In addition, it is
important to note that the controlled studies reviewed in this report—indeed, virtually all research studies in all fields—are partial studies. They do not capture completely the larger context within which each study is done, and so few studies provide definitive answers. Research to date is only the latest chapter in a continuing story.
6
Background and Methods
Researchers have long been aware of the need for organizing the vast educational
literature so that it will be useful to policymakers, administrators, teachers, and other researchers. But no one has made a better case for the importance of research syntheses than Gene V. Glass did in his 1976 presidential address to the American Educational Research Association.
Before what has been found can be used, before it can persuade skeptics, influence policy, affect practice, it must be known. Someone must organize it, extract the message . . . We face an abundance of information. Our problem is to find the knowledge in the information. We need methods for the orderly summarization of studies so that knowledge can be extracted from the myriad individual researches (Glass, 1976, p. 4).
For Glass, the chronologically arranged descriptions of research in most narrative reviews do not transform information into knowledge. Most narrative reviews are too selective, too subjective, and too imprecise to do the job.
Glass advocated the use of sophisticated techniques of measurement and statistical analysis in reviews, and he developed a quantitative methodology for reviewers to follow. Glass’s method is meta-analysis, the statistical analysis of a collection of results from individual studies for the purpose of integrating the findings (Glass, McGaw, & Smith, 1981). More simply, it is the statistical analysis of analyses. Reviewers who carry out meta-analyses first locate studies of an issue by clearly specified procedures. They then characterize the outcomes and features of the studies in quantitative or quasi-quantitative terms. Finally, meta-analysts use multivariate techniques to relate characteristics of the studies to outcomes.
During the 1980s meta-analysis became the method of choice for reviews of the
effectiveness of instructional technology. At least eight separate meta-analyses were carried out during the 1980s to answer questions about the effectiveness of instructional technology in elementary and secondary schools (J. Kulik, 1994). Research teams at six different research centers produced these reviews. Because meta-analysis dominated the review literature on instructional technology during the 1980s and remains a potent influence on research reviews today, it is important to be clear about some of its central features.
One of the major innovations in meta-analysis was the use of measures of effect size to summarize study results. Researchers had used effect sizes in designing studies long before meta-analysis was developed, but they failed to see the contribution that effect sizes could make to research reviews. Glass saw that results from a variety of different studies could be expressed on a common scale of effect size. After making such transformations, reviewers could carry out statistical analyses that were as sophisticated as those carried out by experimenters.
Size of effect can be measured in several ways, but the measure of effect size most often used is the standardized mean difference. This index gives the number of standard deviation units that separate outcome scores of experimental and control groups. Reviewers calculate it by subtracting the average control group outcome score from the average experimental group score and then dividing the remainder by the standard deviation of the outcome measure. For example, if a group that receives computer-based coaching on the SAT obtains an average score of 550 on the test, whereas a group that receives conventional teaching averages 500, the effect size for the coaching treatment is 0.5 since the standard deviation on the SAT is 100.
Effect sizes can be negative or positive. They are positive when an experimental or treatment group outperforms a control group. They are negative when the control group comes out on top. Effect sizes can be large or small. Cohen (1977) suggested rough guidelines for classifying effect sizes. Effects are small, he said, when effect sizes are around 0.2, medium when they are around 0.5, and large when they are around 0.8. Looking specifically at
educational effects, Slavin (1990a) suggested that effect sizes of +0.25 or more are large enough to be considered to be educationally meaningful.
The meaning of effect sizes can be grasped by relating them to other measures, such as percentile scores and standard scores. Suppose, for example, that a study finds an effect size of 1.00 for an SAT coaching program. Using what we know about SAT norms (i.e., average score approximately 500 and standard deviation approximately 100), we can say that a typical coached student would score 550 on the SAT, whereas a typical uncoached student would score 500. Using areas of the normal curve, we can also say that a typical coached student would score at the 84th percentile, whereas a typical uncoached student would score at the 50th percentile.
Review Findings from the 1980s
The meta-analyses of the 1980s yielded the conclusion that programs of computer-based instruction have a positive record in the evaluation literature (J. Kulik, 1994). The following are the major points emerging from these meta-analyses:
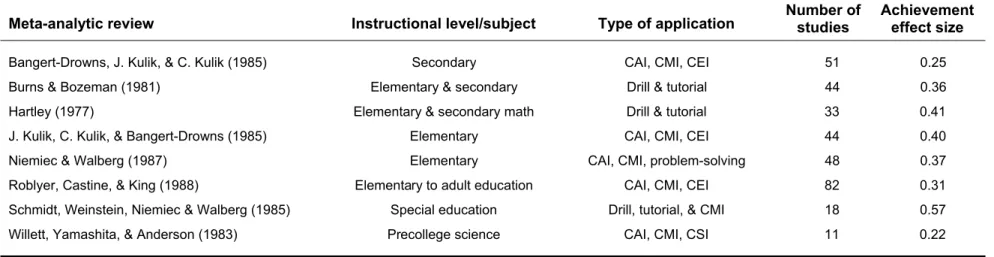
1. Students usually learned more in classes in which they received computer-based instruction (Table 1). The eight reviews that examined effects of computer-based instruction on student learning produced somewhat different estimates of the magnitude of the effects, but all the estimates were positive. At the low end of the estimates was an average effect size of 0.22 in 22 studies conducted in elementary and high school science courses (Willett, Yamashita, & Anderson, 1983). At the other end of the scale, Schmidt, Weinstein, Niemiec, & Walberg (1985) found an average effect size of 0.57 in 18 studies conducted in special education classes. The median effect size in the eight meta-analyses was 0.36. This means that the average effect of computer-based instruction was to raise examination scores by 0.36 standard deviations, or from the 50th to the 64th percentile.
2. Students also liked their classes more when they received computer help in them. The average effect of computer-based instruction in 22 studies was to raise attitude- toward-instruction scores by 0.28 standard deviations (C. Kulik & J. Kulik, 1991). 3. Students developed more positive attitudes toward computers when they received help
from them in school. The average effect size in 19 studies on attitude toward computers was 0.34 (C. Kulik & J. Kulik, 1991).
4. Computers did not, however, have positive effects in every area in which they were studied. The average effect of computer-based instruction in 34 studies of attitude toward subject matter was near zero (C. Kulik & J. Kulik, 1991).
8
Table 1. Achievement effect sizes for computer-based applications of different types at different instructional levels,
as reported in 8 meta-analytic studies published before 1990
Meta-analytic review Instructional level/subject Type of application Number of studies Achievement effect size
Bangert-Drowns, J. Kulik, & C. Kulik (1985) Secondary CAI, CMI, CEI 51 0.25
Burns & Bozeman (1981) Elementary & secondary Drill & tutorial 44 0.36
Hartley (1977) Elementary & secondary math Drill & tutorial 33 0.41
J. Kulik, C. Kulik, & Bangert-Drowns (1985) Elementary CAI, CMI, CEI 44 0.40
Niemiec & Walberg (1987) Elementary CAI, CMI, problem-solving 48 0.37
Roblyer, Castine, & King (1988) Elementary to adult education CAI, CMI, CEI 82 0.31
Schmidt, Weinstein, Niemiec & Walberg (1985) Special education Drill, tutorial, & CMI 18 0.57
Willett, Yamashita, & Anderson (1983) Precollege science CAI, CMI, CSI 11 0.22
Note: CAI = computer-assisted instruction; CEI = computer-enriched instruction; CMI = computer-managed instruction; CSI = computer-simulated instruction. In CAI programs, the computer provides either drill-and-practice exercises or tutorial instruction. In CMI programs, the computer evaluates test performance and guides students to appropriate instructional resources. In CEI applications, the computer provides relatively unstructured exercises (including games and game-like lessons) to stimulate and motivate students. In CSI programs, the computer serves as a simulator, generating data that meet student specifications to illustrate relations in models of social or physical reality.
During the 1980s, therefore, meta-analytic reviewers agreed that computer-based instruction had positive effects on students. The literature said that adding computer-based instruction to a school program, on the average, improved the results of the program. But the meta-analyses differed somewhat on the size of the gains to be expected. It is necessary to look more closely at the studies to find out which factors were related to the variation in meta-analytic results.
Specific Computer Approaches
The computer was used in conceptually and procedurally different ways in studies examined in these meta-analyses. A plausible hypothesis is that some applications produced results that were better than average, whereas other approaches produced below-average results. To test this hypothesis, James A. Kulik’s 1994 review looked carefully at 97 studies carried out in elementary schools and secondary schools. Each of the studies was a controlled quantitative study, in which achievement outcomes in a class taught with computer-based instruction were compared to achievement outcomes in a class taught without computer-based instruction. Some of the studies measured achievement outcomes on nationally standardized tests and some measured outcomes on locally developed tests.
The review classified the 97 studies into six types and calculated average effect size for the studies in each category. The six approaches to computer-based instruction were as follows:
1. Tutoring. The computer presents material, evaluates responses, determines what to present next, and keeps records of progress.
2. Managing. The computer evaluates students either on-line or off-line, guides students to appropriate instructional resources, and keeps records.
3. Simulation. The computer generates data that meet student specifications and presents the data numerically or graphically to illustrate relations in models of social or
physical reality.
4. Enrichment. The computer provides relatively unstructured exercises of various types—games, simulations, tutoring, etc.—to enrich the classroom experience and stimulate and motivate students.
5. Programming. Students write short programs in such languages as Basic and Algol to solve mathematics problems. The expectation is that this experience in programming will have positive effects on students' problem-solving abilities and conceptual understanding of mathematics.
6. Logo. Students give the computer Logo instructions and observe the results on computer screens. From this experience students are expected to gain in ability to solve problems, to plan, to foresee consequences, and so on.
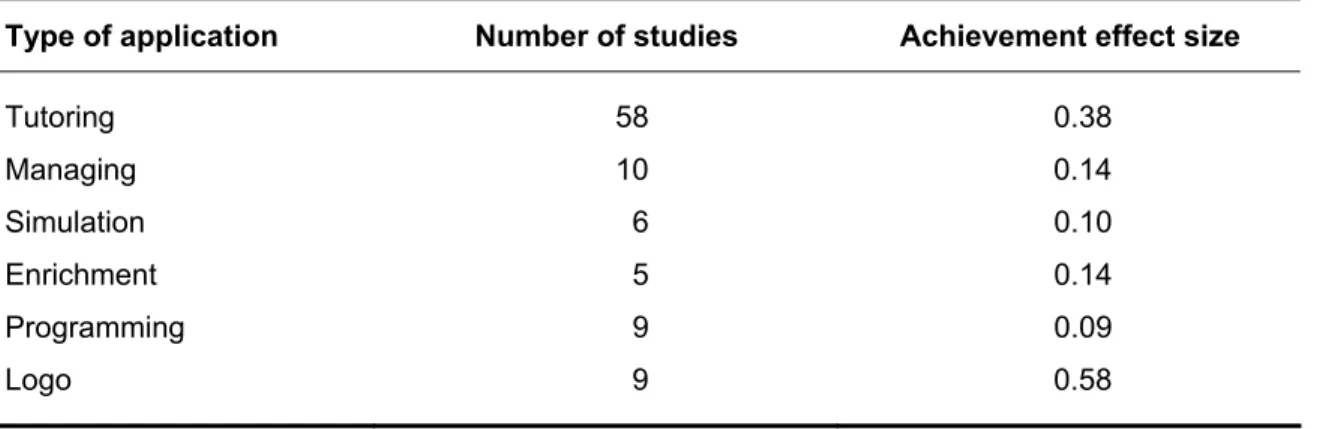
Table 2 gives the average effect sizes for these categories. The table shows that results of computer-based teaching depend on the way in which computers are used.
10
Table 2. Achievement effect sizes for 6 types of computer-based applications,
calculated from evaluation studies published before 1990
Type of application Number of studies Achievement effect size
Tutoring 58 0.38 Managing 10 0.14 Simulation 6 0.10 Enrichment 5 0.14 Programming 9 0.09 Logo 9 0.58 Source: J. Kulik (1994).
Results for three categories of computer use are especially noteworthy: results for computer tutoring, results for Logo programming, and other results. Computer tutoring usually produced positive results in elementary and high schools. Students usually learned more in classes that included computer tutoring. Results of Logo evaluations were impressive on average, but Logo results were also variable. Logo evaluations that measured gains on individually administered tests reported strong positive results. Logo evaluations that employed group administered tests reported indifferent results. Results were unimpressive for several other computer applications: managing, simulations, enrichment, and programming.
Other Instructional Innovations
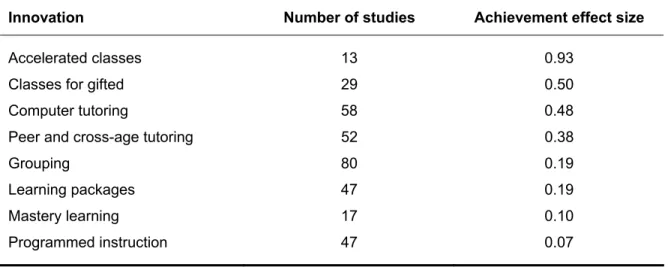
Kulik’s 1994 review also looked at the evaluation records of instructional innovations that did not involve technologies. Listed in Table 3 are seven instructional areas and the number of effectiveness studies found in each area. Also given is the average effect size in each area. This is the average increase in examination scores that is produced by use of the innovation, where the increase is measured in standard deviation units. The effect sizes are based on studies that (a) were reported in journal articles or technical reports, (b) used standardized rather than locally developed tests as outcome measures, and (c) were at least one month in duration.
The table suggests that the innovations that made the biggest difference for student learning involved curricular change for high-achieving individuals. Schools dramatically improved their effectiveness by developing programs that provided greater curricular challenge for their high-aptitude learners. The next most potent innovations involved individual tutoring by computers or by other students. During the 1980s computer tutoring seemed to be slightly more effective than peer and cross-age tutoring. Instructional technologies that relied on paper and pencil were at the bottom of the scale of effectiveness.
Review Methods for Recent Literature
In the 1980s computers were still a recent arrival in school classrooms. Technological applications were relatively homogeneous. And the question for most reviewers was a
straightforward one: Do students learn better with or without the help of technology? Today this question seems overly simple. In today’s schools, students use computers in too many ways for a simple thumbs-up or thumbs-down on instructional technology. Reviewers need to focus on specific technological applications rather than on technology in general.
Slavin’s (1990b) analysis of levels of instructional innovation may be useful here. Slavin wrote that innovations can be defined with different degrees of precision, and he specified three different levels of innovations. At Level I, innovations are defined vaguely. According to Slavin, such broad categories as open-education and whole-language instruction suggest only fuzzy models for instructional practice. The terms cover a variety of procedures that do not have a distinct conceptual basis. Level II innovations are more clearly specified. They usually have a conceptual basis that is easy to describe, but in practice, Level II approaches are implemented in different ways. Slavin's examples are cooperative learning, direct instruction, mastery learning, and individualized instruction. Level III approaches are precisely defined. They include specific instructional materials, well-developed training procedures for teachers, and detailed prescriptive manuals. Slavin's examples are DISTAR and Man: A Course of Study.
12
Table 3. Achievement effects for 8 categories of instructional innovations,
calculated from meta-analytic reports published before 1990
Innovation Number of studies Achievement effect size
Accelerated classes 13 0.93
Classes for gifted 29 0.50
Computer tutoring 58 0.48
Peer and cross-age tutoring 52 0.38
Grouping 80 0.19
Learning packages 47 0.19
Mastery learning 17 0.10
Programmed instruction 47 0.07
Computer-based instruction, the focus of meta-analysts in the 1980s, should probably be thought of as a Level I category. Instructional technology and computer-based instruction refer to a variety of procedures with a variety of conceptual bases. They are chapter headings rather than technical terms. At the end of the decade, meta-analysts were focusing more directly on Level II categories. James A. Kulik's 1994 review, for example, examined computer tutoring, managing, simulation, enrichment, programming, and Logo. These can be thought of as Level II categories of computer use. Computer applications within these categories may share common conceptual roots, but in practice the applications vary. Today, a decade later, it should be possible to focus on both Level II and Level III innovations.
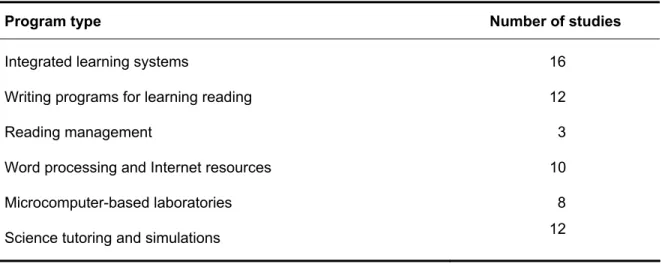
Preliminary searches of three library databases revealed that viable evaluation literatures existed in six areas: (a) integrated learning systems; (b) reading management systems; (c) writing programs for teaching reading; (d) word processing and Internet resources; (e) microcomputer-based laboratories; and (f) science tutoring and simulations. Innovations in two of these areas, reading management systems and writing programs for teaching reading, fall at Level III on Slavin’s scale of specificity. Like other Level III innovations, these programs use precisely defined methods and materials, including specific instructional materials, well-developed training procedures for teachers, and detailed prescriptive manuals. The remaining innovations seem to fall at Level II on Slavin’s scale.
After defining these areas, the project located relevant evaluation studies by computer searching three library databases: the ERIC database of the U.S. Department of Education’s Office of Educational Research and Improvement; the Dissertation Abstracts International (DAI) of Bell and Howell Information and Learning; and the Road Maps database of the National Science Foundation’s Division of Science Resources Statistics. Use of the first two databases needs little justification. The ERIC database is a comprehensive depository for research
documents published in journals or presented at professional conferences and meetings. The DAI database contains a record of virtually every doctoral dissertation written in American universities during the last century. Although the NSF database is smaller than the ERIC and DAI databases, it has a unique strength. It contains references to Web documents as well as print documents. It therefore serves as a useful supplement to the ERIC and DAI databases.
The purpose of this review is to analyze evaluation findings not covered in earlier reviews, and so this review covers only studies published since 1990. Although the focus of this review is on recent evaluation studies, it is important to note that the evaluation literature lags behind the cutting edge in instructional technology, and even the most recent evaluation studies may not cover the most recent developments in technology. It takes time for people to implement ideas, establish school programs, evaluate programs, write reports on results, and publish the reports. As a result, today’s evaluation reports are not likely to focus on technologies in today’s headlines.
Evaluation studies also had to meet some basic methodological standards to be included in this review. First, the studies had to be actual field implementations in which students received for-credit instruction. Laboratory studies with paid or volunteer subjects were not included in the pool of studies analyzed for this project. Second, the studies had to provide quantitative results on outcome variables measured in the same way in both experimental and comparison groups. Third, the studies had to be free from such crippling methodological flaws as substantive
differences on pretests or on other aptitude measures, unfair teaching of the criterion test to one of the comparison groups, and differential rates of subject attrition from the groups being compared. This project located a total of 61 controlled evaluation studies in these six areas. Table 4
14
program of instruction. Very few studies carried out controlled comparisons of other
instructional outcomes: performance on follow-up or retention examinations; attitudes toward instruction, computing, or subject matter; or time needed for instruction. Where controlled comparisons of these outcome measures were available, they are mentioned in this report.
This project calculated effect sizes for study outcomes from the statistics presented in the original reports. Glass’s guidelines for calculating these statistics (Glass et al., 1981) were followed. Effect sizes were calculated directly from the measurement provided in the original reports for those studies that reported means and standard deviations for both experimental and control groups. For less fully reported studies, this project calculated effect sizes from statistics such as t and F.
The application of the formulas given by Glass and his colleagues was straightforward in most cases. In some studies, however, more than one value was available for use in the
numerator of the formula for the effect size and more than one value was available for the denominator. For example, some investigators reported raw-score differences between groups as well as covariance-adjusted differences, and some reported differences on a postmeasure as well as differences in pre-post gains. In such cases, this project used as numerator in the effect-size formula the difference that gave the most accurate estimate of the true treatment effect. That meant using covariance-adjusted differences rather than raw-score differences, and differences in gains rather than differences on posttests. In addition, some reports contained several measures of variation that might be considered for use as the denominator of effect size. This project used the measure that provided the best estimate of the unrestricted population variation in the criterion variable.
The methodology used in preparing this review combines features of narrative and meta-analytic reviews. Specifically, this project followed clearly defined procedures for locating studies and expressed results from all studies in terms of effect sizes. This project did not carry out regression analyses between study features and outcomes as many meta-analysts have done in the past. Instead of focusing on such difficult-to-interpret correlational analyses, this project has focused on describing the studies to a fuller extent. This review thus incorporates both features of narrative and meta-analytic reviews.
The remaining sections of this report analyze study findings and present the results of the analyses. The next section of the report focuses on integrated learning systems, which have been used in both mathematics and reading instruction. Three sections of the report then review studies of technology-based programs for reading and writing instruction, including writing-based programs for teaching reading, reading management systems, word processing programs, and other computer enrichment programs. Two sections of the report focus on technology-based programs in science teaching, including tutorial programs, simulation programs, and
microcomputer-based laboratories. The report concludes with a brief summary of the main findings.
Table 4. Number of evaluation studies reviewed in this report, by program type
Program type Number of studies
Integrated learning systems 16
Writing programs for learning reading 12
Reading management 3
Word processing and Internet resources 10
Microcomputer-based laboratories 8