A New Extension to Kernel Entropy Component Analysis for Image-based
Authentication Systems
Sepehr Damavandinejadmonfared
Advanced Cyber Security Research Centre Dept. of Computing, Macquarie University Sydney, Australia
[email protected]Vijay Varadharajan
[email protected]Abstract
We introduce Feature Dependent Kernel Entropy Com-ponent Analysis (FDKECA) as a new extension to Kernel Entropy Component Analysis (KECA) for data transforma-tion and dimensionality reductransforma-tion in Image-based recogni-tion systems such as face and finger vein recognirecogni-tion. FD-KECA reveals structure related to a new mapping space, where the most optimized feature vectors are obtained and used for feature extraction and dimensionality reduction. Indeed, the proposed method uses a new space, which is fea-ture wisely dependent and related to the input data space, to obtain significant PCA axes. We show that FDKECA pro-duces strikingly different transformed data sets compared to KECA and PCA. Furthermore a new spectral clustering al-gorithm utilizing FDKECA is developed which has positive results compared to the previously used ones. More pre-cisely, FDKECA clustering algorithm has both more time efficiency and higher accuracy rate than previously used methods. Finally, we compared our method with three well-known data transformation methods, namely Principal Component Analysis (PCA), Kernel Principal Component Analysis (KPCA), and Kernel Entropy Component Analysis (KECA) confirming that it outperforms all these direct com-petitors and as a result, it is revealed that FDKECA can be considered a useful alternative for PCA-based recognition algorithms
1. Introduction
Fundamentally data transformation is of importance in machine learning and pattern analysis. The goal is to, al-ternatively, represent the high-dimensional data into a typi-cally lower dimensional form revealing the underlying for-mat and structure of the data. There is a large amount of literature on data transformation algorithms and meth-ods [1], [2]. A dominant research area in data
transforma-tion is known as the so-called spectral methods. In spec-tral methods, the bottom or top eigenvalues (spectrum) and their corresponding eigenvectors play the main role in fea-ture extraction and dimensionality reduction especially in constructed data matrixes. Some recent spectral methods include locally linear embedding [3], isometric mapping [4], and maximum variance unfolding [5], to name a few. See the recent review papers [6], [7] for thorough reviews of several spectral methods for dimensionality reduction. One of the most powerful and well known methods in the mentioned area is Principal Component Analysis (PCA) [8] which has been used in numerous applications and algo-rithms in data classification and machine learning[9],[10]. However, PCA [11] is a linear method which may not be beneficial when there might exist non-linear patterns hid-den in the data. Over the last few decades, there have been a number of advanced improvements on PCA trying to overcome the drawback of linearly transformation and make PCA influential when dealing with nonlinear data. A very well-known and influential method is Kernel Prin-cipal Component Analysis (KPCA) [12]. In Kernel PCA [13], PCA is performed in a kernel feature space which is non-linearly related to the input data. It is enabled using a positive semi-definite (psd) kernel function computing the inner products within the new space (kernel feature space). Therefore, constructing the so-called kernel matrix or the inner product matrix is vital. Then, using the top eigenval-ues and their corresponding eigenvectors to perform met-ric MDS [14] will lead to kernel PCA data transformation method. Kernel PCA has extensive use in many different contexts. For instance, kernel PCA has been used in ma-chine learning algorithms from data classification [15] to data denoising [16][17][18]. In [19], kernel PCA is intro-duced for face recognition systems. Kernel PCA also has been used in finger vein recognition algorithms [20]. In 2010 [21], R. Jenssen proposed Kernel Entropy Component Analysis KECA as a new extension to kernel PCA. Kernel
ECA is fundamentally different from other spectral methods in two ways explained as follows; (1): The data transforma-tion reveals structure related to the Renyi entropy of the in-put space data set and (2): The method does not necessarily use the top eigenvalues and eigenvectors of the kernel ma-trix. Shekar in 2012 [22], implemented KECA on face data base claiming KECA outperforms KPCA for face recog-nition purpose. In this paper, we develop a new spectral data transformation method, which is fundamentally differ-ent from Kernel ECA in the following important way:
• In FDKECA the dimension of the feature space is de-pendent on the dimension of the input data, not the number of input data. It means no matter how many data to analyze, the dimension of kernel matrix (kernel feature space) is fixed.
The mentioned difference will make the following ad-vantages FDKECA has over KECA:
• FDKECA is much less computationally expensive than KECA as the dimension of the feature space, where the optimal PCA axes are calculated, is just as high as the dimension of the input data. This leads to a much faster method than traditionally used KECA.
• FDKECA has lower error rate than KECA as the axes obtained from our proposed feature space will con-tribute to more efficiency and less dimension compared to KECA.
The reminder of this paper is organized as follows: Sec-tion 2 illustrates some examples of spectral data transfor-mation methods of importance. Feature Dependent Kernel Entropy Component Analysis (FDKECA) is developed in Section 3. The image reconstruction method and eigen-face analysis using FDKECA are developed in Section 4. A spectral clustering algorithm using FDKECA is developed in section 5. Experimental results are presented in section 6. Finally, section 7 concludes the paper.
2. Spectral Data Transformation
In this section, we explain the fundamentals of PCA, KPCA, and KECA with examples to comprehend spectral basic data transformation methods.
2.1. Principal Component Analysis (PCA)
A well-known spectral data transformation method is PCA. Let X = [x1, ..., xn] , where xt ∈ Rd and t =
[1, ..., N]. As PCA is a linear method, the following trans-formation is sought assumingAis[d×d]such thatyt∈Rd
andt= [1, ..., N]:Ypca=AXwhereYpca = [y1, ..., yn].
Therefore, the sample correlation matrix ofYpcaequals to:
1 NYpcaY T pca= 1 NAX(AX) T =A1 NXX T AT (1)
The sample correlation matrix ofX is 1 NXX
T.
Deter-miningAsuch that 1 NYpcaY
T
pca =Iis the goal.
Consider-ing eigen-decomposition, we will have 1 NXX
T =V4VT
,where4is a diagonal matrix of the eigenvaluesδ1, ..., δn
in descending order having the corresponding eigenvectors v1, ..., vn as the columns ofV.Substituting into (1), it can
be clearly observed thatA = 4−1/2VT leads to the goal
such thatYpca=4−1/2VTX.
Performing a dimensionality reduction fromdtol ≤ d is often achieved by the projection of data onto a subspace spanned by the eigenvectors (principal axes) corresponding to the largest topleigenvalues.
2.2. Kernel Principal Component Analysis (KPCA)
Scholkoft in 1998 proposed Kernel PCA which is a non-linear version of PCA operating in a new feature space called kernel feature space. This space is non-linearly re-lated to the input space. The nonlinear mapping func-tion (kernel funcfunc-tion) is given Φ : Rd → F such thatxt = Φ(xt), t = 1, ..., N andΦ = [Φ(x1), ...,Φ(xN)].
After performing such mapping in input data, PCA if im-plemented inF, we need an expression for the projection ofPUiofΦonto a subspace of feature space principal axes,
for example, topl principals. It can be given by a positive semi-definite kernel function or Mercer kernel [23] [24], kσ = Rd×Rd → R computes an inner product in the
Hilbert spaceF:
kσ(xt, x0t) =hφ(xt)φ(x0t)i (2)
The(N×N)kernel matrixKis defined such that ele-ment(t, t0)of the kernel matrix equals tokσ(xt, x0t).
There-fore,K = ΦTΦis the inner product matrix (Gram matrix) inF. Then, Eigen-decomposing the kernel matrix we have K = EDET whereE is the eigenvectorse0
1, ..., e0n
col-umn wise and their corresponding eigenvalues are inD -λ1, ..., λn- . Williams in [25] discussed that the equivalence
between PCA and KPCA holds in KPCA as well (kernel feature space). Hence, we have:
Φpca=PUiΦ =D
1/2
l E T
l (3)
Where Dl is the top large l eigenvalues of K andEl
is their corresponding eigenvectors stored in columns. It means that projectingΦonto spanned feature space (princi-pal axes) is given byPUiΦ =
√
Considering the analogy in (3),Φpca =D
1/2
l E T l is the
solution to the following optimization problem:
Φpca=D0 1/2 l E 0T l : min λ0 1,e 0 1,...,λ 0 N,e 0 N 1T(K−Kpca)2.1. (4)
Where Kpca = ΦTpcaΦpca. Therefore, this procedure
minimizes the norm ofK−Kpca.
2.3. Kernel Entropy Component Analysis
Selection of the subspace where the data is projected onto is of importance in spectral methods, which is achieved based on the top or bottom eigenvectors in PCA and KPCA. In KECA, however, this stage is based on entropy estimate. Using entropy estimate, the data transformation from higher dimension to lower dimension is obtained by projecting the input data onto the axes, which contribute to the entropy es-timate of input space. The procedure of entropy eses-timate in KECA is given as follows: The Renyi entropy function is defined by
H(P) =−lg
Z
p2(x)d(x) (5) Wherepis probability density of the input data. Consider-ing the monotonic nature of logarithmic function, (12) can be replaced by the following equation:
V(P) = Z p2(x)d(x) (6) EstimatingV(p), (14) is given: ˆ p(x) = 1/NX xtS kσ(x, xt) (7)
k(x, xt)is the kernel centred matrix, then:
ˆ V(p) = 1/NPp xtS(xt) 1/NX xtS 1/N X xtS kσ(x, xt) = 1/N21TK1 (8)
whereKiskσ(x, xt)and 1 is an(N×1)vector which
contains all ones. The Renyi entropy estimating can be cal-culated for eigenvalues and eigenvectors of the Kernel ma-trix. It is defined asK = EDET, whereDincludes the eigenvectors,λ1, λ2, ..., λN, andEconsists of eigenvalues,
α1, α2, ..., αN. Finally, rewriting (15), we have:
(p) = 1/N2 N X 1 (pλiαTi 1) 2 (9)
3. Feature Dependent Kernel Entropy
Compo-nent Analysis (FDKECA)
In this section, we will go through PCA and KECA fea-ture space in details and clarify our motivation to propose the new transformation method, and then FDKECA is in-troduced.
3.1. Defining the Feature Dependent Kernel
En-tropy transformation
Generally, in spectral data transformation methods, find-ing the most valuable principal axes (appropriate directions in the feature space) is of greatest importance. In PCA, for example, it is extracted linearly from the principal fea-ture space. In KECA, however, these axes are extracted from kernel Entropy feature space as discussed in previous subsection. We define Feature Dependent Kernel Entropy Component Analysis as a k-dimensional data transforma-tion method obtained by projecting input data onto a sub-space spanned by principal kernel axis contributing to the feature dependent kernel Entropy space. Feature dependent kernel Entropy space is defined as follows:
LetX= [x1, ..., xN], wherext∈Rdandt= [1, ..., N].
The nonlinear mapping function is given Φ : Rd → Fd
such thatx0t= Φ(x0t), t= 1, ..., dwherex0tis anN dimen-sional vector including all of thetth features fromN
in-put data. Explaining this, we haveΦ = [φ(x01), ..., φ(x0d)]. The use of a positive semi-definite kernel function or Mer-cer kernel computes an inner product in the new spaceFd:
kσ(x0t, x0t0) =hφ(x0t)φ(x0t0)i (10) The(N×N)kernel matrix-we define that asKF DKECA
-is now defined such that element(t, t0)of the kernel matrix iskσ(x0t, x0t0). Therefore,KF DKECAis the Gram matrix or
the inner product matrix inFd. The next stage in FDKECA
is to perform PCA on KF DKECA. Note that the kernel
matrix taken in FDKECA feature space (KF DKECA ) is
totally different from that of KPCA.
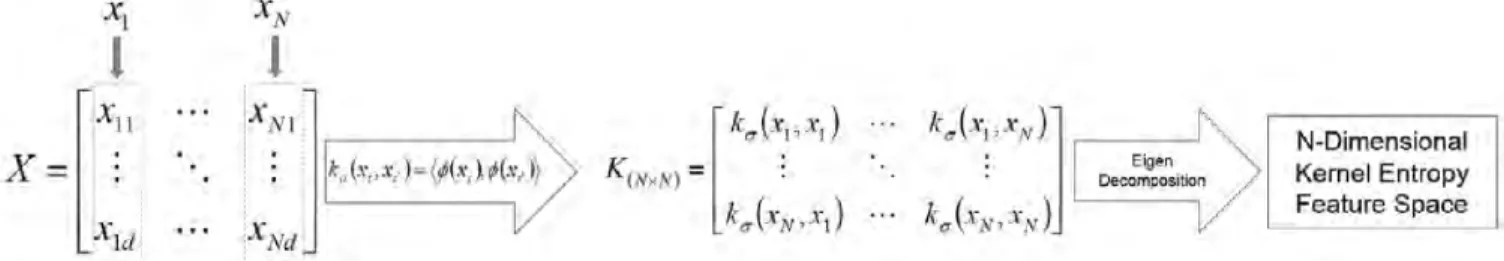
Fig. 1. illustrates a brief flow diagram of reaching kernel Entropy feature space from scratch. As it is shown in Fig. 1,N input data are first mapped into kernel space byφand then the Gram matrix (kernel matrix) is calculated using in-ner product. Note that the dimension of kernel matrix is equal to the number of input data-N. Eigen-decomposition is the next step where all eigenvalues and their correspond-ing eigenvectors are extracted and reordered in a descendcorrespond-ing manner from the greatest to the smallest value. After find-ing the kernel axes in this space, the kernel matrix, which represents the input data, is projected onto the kernel fea-ture vectors (eigenvectors). The drawback to KECA is that the dimension of feature space and kernel matrix could be-come too high and as a result data transformation could be computationally expensive. In addition, finding the most
Figure 1. Flow diagram of reaching Kernel Entropy Feature Space
Figure 3. Top 63 eigenvectors obtained by PCA
optimized sub-space in kernel feature space could be chal-lenging and sometimes inefficient.
Fig. 2. demonstrates FDKECA feature space where the input data is projected onto a subspace spanned by princi-pal kernel entropy axes contributing to the feature depen-dent kernel entropy space. As it is illustrated in Fig.2, FD-KECA considers all features having the same dimension from all input data in separate vectors first and then maps them into kernel space which is called FDKECA feature space. Then it computes the kernel matrix (Gram matrix) using inner products which is ad-dimensional space. Note that the input data has the dimension ofdwhich means there is no growth of dimension while computing FDKECA fea-ture space. Havingd-dimensional FDKECA feature space, the eigenvectors and their corresponding eigenvalues are de-composed in this step using the estimation of entropy. The original input data is projected onto a sub-space of FD-KECA feature vectors for the purpose of transformation and dimensionality reduction.
4. Eigenface Analysis on PCA and FDKECA
For more detailed comparison, we have performed PCA and FDKECA on the first individuals samples and visu-alized the first 63 feature vectors (eigenfaces) which are shown in Fig. 4 and 5.Figure 4. Top 63 eigenvectors obtained by FDKECA
In this analysis, we used 10 samples of the first subject of SCface database in PCA and FDKECA. In PCA, all samples were first converted into 1-D vectors. After calculating the mean vector (the mean image), the co-variance matrix is ob-tained and then, the Eigen-decomposition is performed on the co-variance matrix. The eigenvectors (PCA eigenfaces) were then reordered according to the greatness of their cor-responding eigenvalues (in descending order). Fig. 4 shows the top 63 eigenvectors obtained by PCA. As it was ex-pected, the top eigenvector carries the most information and the amount of information being carried by the feature vec-tors reduces as the eigenvector gets farther from the top one and closer to the bottom one. Another expectation is that only the first 9 or 10 top eigenvectors have some valuable information and the rest of the axes (eigenvectors) seem not to be useful as almost no related information can be seen in them. In terms of FDKECA, however, it is different.
In FDKECA, we used the polynomial kernel function with the degree of two. Firstly, all samples were con-verted into 1-D vectors. After calculating the mean vector (the mean image), all samples were mapped by the poly-nomial kernel function (as described in section III). Then, the Eigen-decomposition was performed onKF DKECAto
achieve the feature vectors and finally the axes were re-ordered based on entropy estimate. Fig. 5 illustrates the
Figure 2. Flow diagram of reaching Feature Dependent Kernel Feature Space
top 63 eigenvectors obtained by FDKECA. Same as PCA, it was expected that the top eigenvector carries the most in-formation and the amount of inin-formation drops as the num-ber of the eigenvector gets closer to the bottom one. How-ever, there is a considerable discrepancy between the shown eigenfaces obtained by PCA and FDKECA. In FDKECA, all eigenfaces carry relevant information except for the last 12 while in PCA only the first 9 or 10 ones have informa-tion related to the original face images. This analysis shows that FDKECA finds more informative and valuable feature vectors compared to PCA (as shown in Fig. 3 and4).
5. Spectral Clustring Algorithm Using
FD-KECA
In this section, a spectral clustering algorithm is devel-oped using FDKECA transformation. The proposed algo-rithm, actually, is suitable for image classification which works in a supervised system as there are some samples to train the system and then using different samples, the sys-tem is tested. We first introduce the FDKECA clustering algorithm and then compare it with other algorithms such as PCA, KPCA and KECA in next section. As FDKECA can be considered as an extension to 1-D PCA, in our clus-tering algorithm all samples are converted into vectors. The goal is to propose a clustering system which not only is fast enough (not as computationally expensive as KECA), but also outperforms PCA, KPCA and KECA in terms of clus-tering image samples. Such an algorithm can be used in recognition systems like face, finger print, finger vein, palm vein etc.
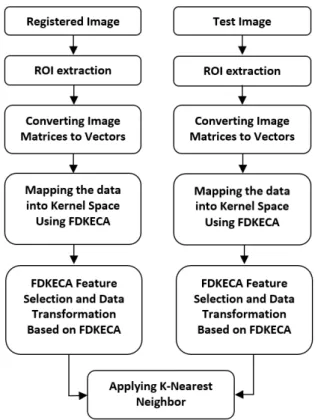
Fig.5 indicates the flow diagram of the proposed cluster-ing algorithm for image classification. We believe this al-gorithm can be applied in image-based recognition systems such as face and finger vein recognition. Moreover, this algorithm is much faster than normal KECA as its dimen-sion of feature vector is fixed and it does not become too computationally expensive when analyzing a huge number of data. In addition to having a high speed, this algorithm is believed to be more appropriate than PCA, KPCA and KECA as it was shown in previous section. We have con-ducted different experiments on two different databases to have a complete analysis on the proposed algorithm. Next
Figure 5. Flow diagram of the proposed clustring algorithm using FDKECA
section gives experimental results on face and finger vein database.
6. Experimental Results
In this section, the performance of FDKECA is evaluated and compared with PCA, KPCA, and Kernel Entropy Com-ponent Analysis (KECA) on two different databases- finger vein and face. The experiments are conducted on Surveil-lance Camera Face Database (SCface database) and Finger vein database which are explained in two experimental se-tups in the following part of this section.
6.1. Experimental setup-1
The first part of the experiments is on finger vein database. The finger vein samples are collected using our own designed scanner. We will not go through the detailed discussion on how the data is collected and prepared as it might not be totally relevant to this work, See [27] for more information on the database.
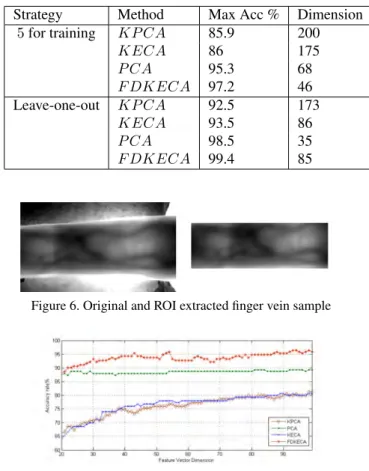
10 samples were used from each of 200 individuals which results in a finger vein database consisting of 2000 samples. Region of Interest is detected and extracted from each sample automatically. Fig. 6 shows an original and cropped sample from the database. Two independent exper-iments have been conducted on this database. Firstly, the performance of FDKECA is compared with PCA, KPCA, and KECA where 5 randomly selected samples were used to train the algorithm and the remaining 5 to test. Then we used leave-one-out strategy to have a better comparison. Gaussian kernel is used in FDKECA, KPCA, and KECA algorithms in this stage. As in PCA-based image analysis the size of the samples is of importance, all finger vein sam-ples have been normalized to the size of(10×20)to have a balance between speed and efficiency. In one-dimensional PCA-based algorithms, the first step is to convert the data from matrices into vectors which leads into vectors with the dimension of(1×200). It means there could be 200 dif-ferent implementations of FDKECA on the data using 200 different feature vectors to project the data onto. However, it is totally different in KPCA and KECA as it is depen-dent on the number of input data being transferred into nel space. For the sake of comparison, the first 200 ker-nel feature vectors were used in our implementations. In each single experiment, the implementation is repeated 200 times and the maximum accuracies and their corresponding dimension of feature vector are gathered and shown in Ta-ble 1. As it is observed from this taTa-ble, KPCA and KECA achieve their maximum accuracy in a much higher dimen-sion of feature vector in comparison with PCA. It is because feature space in KPCA and KECA is very high dimensional. more precisely, if 9 image from each category is used to train, it leads to a total number of 1800 train samples as there are 200 individuals. Having 1800 input samples in KPCA and/or KECA will result in a feature space with the dimension of(1800×1800), while in PCA the dimension is fixed and equal to 200 in this experiment. The FDKECA, however, results in having the highest accuracy rate while its dimension of feature vector is almost as high as PCA, which means this method is not computationally as expen-sive as KPCA and KECA. Moreover, there is a dramatic gap between FDKECA and KECA which is more than 10 percent in the first experiment.
Table 1. Comparison of FDKECA with Other Methods Using the finger vein Database
Strategy Method Max Acc % Dimension
5for training KP CA 85.9 200 KECA 86 175 P CA 95.3 68 F DKECA 97.2 46 Leave-one-out KP CA 92.5 173 KECA 93.5 86 P CA 98.5 35 F DKECA 99.4 85
Figure 6. Original and ROI extracted finger vein sample
Figure 7. SCface classification using images of 4 cameras for train-ing and 1 to test
6.2. Experimental setup-2
In the second experimental setup, we chose SCface database which is already explained in section 4. There are five different cameras located in three different distances from the individuals to collect the face data. In this part, we conducted the experiment using the images of 4 ran-domly selected cameras for training and the remaining 1 camera for testing. For each algorithm, the experience was repeated 100 times using the first 100 different eigenvectors to project the data onto and the results were gathered and visualized in Fig. 7. It is observed that Like the previous setup, FDKECA outperforms PCA, KPCA, and KECA in all experiments. As Fig.7 indicates, FDKECA reaches the highest accuracy of almost %98 while PCA, KPCA, and KECA get the accuracy of %89, %79 and %81 respectively.
7. Conclusion
We introduced a new data transformation method in this research work for dimensionality reduction in image-based recognition systems. Feature Dependent Kernel Entropy
Component Analysis (FDKECA) is an extension to both 1D-PCA and 1D-KECA. In FDKECA, all data is mapped into kernel space feature-wisely which results in having a constant dimension of data as well as being able to extract more valuable feature vectors in FDKECA feature space. Eigenface analysis showed that the feature vectors in FD-KECA feature space are more informative than PCA. To examine FDKECA in practical clustering and classification methods and to be able to have a complete comparison with PCA, KPCA, and KECA, we proposed a clustering algo-rithm using FDKECA which was examined in two differ-ent areas- face recognition and finger vein recognition. Ex-perimental results showed that FDKECA outperforms PCA, KPCA, and KECA which shows the reliability of FDKECA to be applied in image classification and recognition sys-tems.
References
[1] R.O. Duda, P. E. Hart, and D.G. StorkPattern Classification., John
Wiley and Sons, 2001.
[2] S. Theodoridis and K. Koutroumbas,Pattern Recognition.Academic
Press, 1999.
[3] S. Roweis and L. Saul,Nonlinear Dimensionality Reduction by
Lo-cally Linear Embedding,Science, vol. 290, pp. 2323-2326, 2000.
[4] J. Tenenbaum, V. de Silva, and J.C. Langford,A Global Geometric
Framework for Nonlinear Dimensionality Reduction,Science, vol. 290, pp. 2319-2323, 2000.
[5] K.Q. Weinberger and L.K. Saul,Unsupervised Learning of Image
Manifolds by Semidefinite Programming,Intl J. Computer Vision, vol. 70, no. 1, pp. 77-90, 2006.
[6] L.K. Saul, K.Q. Weinberger, J.H. Ham, F. Sha, and D.D. Lee,
Spec-tral Methods for Dimensionality Reduction,Semisupervised Learn-ing, O. Chapelle, B. Scholkopf, and A. Zien, eds., chapter 1, MIT Press, 2005.
[7] C.J.C. Burges,Geometric Methods for Feature Extraction and
Di-mensional Reduction,Data Mining and Knowledge Discovery Hand-book: A Complete Guide for Researchers and Practitioners, O. Mai-mon and L. Rokach, eds., chapter 4, Kluwer Academic Publishers, 2005.
[8] Jolliffe, I. 2005.Principal Component Analysis. Encyclopedia of
Statistics in Behavioral Science.
[9] L. Sirovich and M. Kirby,Low-Dimensional Procedure for
Charac-terization of Human Faces,J. Optical Soc. Am., vol. 4, pp. 519-524, 1987.
[10] M. Kirby and L. Sirovich,Application of the KL Procedure for the
Characterization of Human Faces,IEEE Trans. Pattern Analysis and Machine Intelligence, vol. 12, no. 1, pp. 103-108, Jan. 1990.
[11] I.T. Jolliffe,Principal Component Analysis. Springer Verlag, 1986.
[12] B. Scholkopf, A.J. Smola, and K.-R. Mu ller,Nonlinear Component
Analysis as a Kernel Eigenvalue Problem,Neural Computation, vol. 10, pp. 1299-1319, 1998.
[13] Schlkopf, Bernhard, Alexander Smola, and Klaus-Robert Mller. ”Kernel principal component analysis.”Artificial Neural Network-sICANN’97. Springer Berlin Heidelberg, 1997. 583-588.
[14] H. Hotelling,Analysis of a Complex of Statistical Variables into
Prin-cipal Components,J. Educational Psychology, vol. 24, pp. 417- 441, 1933.
[15] M.L. Braun, J.M. Buhmann, and K.-R. Mu ller,On Relevant
Dimen-sions in Kernel Feature Spaces,J. Machine Learning Research, vol. 9, pp. 1875-1908, 2008.
[16] J.T. Kwok and I.W. Tsang,The Pre Image Problem in Kernel
Meth-ods,IEEE Trans. Neural Networks, vol. 15, no. 6, pp. 1517- 1525,
2004.
[17] S. Mika, B. Scholkopf, A. Smola, K.R. Mu ller, M. Scholz, and G.
Ratsch,Kernel PCA and Denoising in Feature Space,Advances in
Neural Information Processing Systems, 11, pp. 536-542, MIT Press, 1999.
[18] B. Scholkopf, S. Mika, C.J.C. Burges, P. Knirsch, K.-R. Mu ller, G.
Ratsch, and A.J. Smola,Input Space versus Feature Space in
Kernel-Based Methods,IEEE Trans. Neural Networks, vol. 10, no. 5, pp. 1299-1319, 1999.
[19] Kim, Kwang In, Keechul Jung, and Hang Joon Kim.”Face
recog-nition using kernel principal component analysis.”Signal Processing Letters, IEEE 9.2 (2002): 40-42.
[20] Damavandinejadmonfared, Sepehr, et al.”Finger Vein Recognition
using PCA-based Methods.”World Academy of Science, Engineer-ing and Technology 6.6 (2012): 1079-1081.
[21] Jenssen, Robert.”Kernel entropy component analysis.”Pattern
Anal-ysis and Machine Intelligence, IEEE Transactions on 32.5 (2010): 847-860.
[22] Shekar, B. H., et al.”Face recognition using kernel entropy
compo-nent analysis.”Neurocomputing 74.6 (2011): 1053-1057.
[23] J. Mercer,Functions of Positive and Negative Type and Their
Con-nection with the Theory of Integral Equations,Philosophical Trans. Royal Soc. London, vol. A, pp. 415-446, 1909.
[24] K.R. Mu ller, S. Mika, G. Ratsch, K. Tsuda, and B. Scholkopf,An
In-troduction to Kernel-Based Learning Algorithms,IEEE Trans. Neural Networks, vol. 12, no. 2, pp. 181-201, Mar. 2001.
[25] C.K.I. Williams,On a Connection between Kernel PCA and
Met-ric Multidimensional Scaling,Machine Learning, vol. 46, pp. 11-19, 2002.
[26] Grgic, Mislav, Kresimir Delac, and Sonja Grgic.
”SCfacesurveil-lance cameras face database.”Multimedia tools and applications 51.3 (2011): 863-879.
[27] S.Damavandinejadmonfared, and V.Varadharajan. Finger Vein
Recognition in Row and Column Directions Using Two Dimensional Kernel Principal Component AnalysisProceedings of the 2014 Inter-national Conference on Image Processing, Computer Vision Pattern Recognition, IPCV14, July 2014, USA.