Workload Leverage and the Effect on Audit Quality
Abstract:
Practitioners and regulators suggests audit quality is negatively associated with auditor workloads (PCAOB 2015). We examine the association between office-level workload leverage and an office’s audit quality from 2004-2015 for all accelerated filers. The increase in workloads during busy season can instigate cognitive fatigue (Cohen 1980) if not appropriately mitigated by adequately preparing audit professional’s expectations (Glass and Singer 1972). Our findings indicate that increased busy-season workloads are associated with lower audit quality for accelerated clients of Non-Big 4 audit firms, whereas Big 4 auditors with higher workload leverage provide lower audit quality for non-accelerated filers. These results provide support for cognitive fatigue for all audit firm sizes; however, different sized audit firmsexperience cognitive fatigue at different points during busy season. Our findings contribute to the literature examining workload leverage and auditor burnout by providing empirical evidence of office workload influencing the audit process differently for different office sizes.
Keywords: Workload leverage, audit quality, audit quality indicator, busy season, cognitive fatigue
1
I. INTRODUCTION
A number of stressors in the professional setting can overstimulate individuals and affect their performance. In particular, within the accounting profession, one of the most prevalent stressors is the increased workload during busy season. The audit profession experiences seasonal stress resulting from temporary increases in workloads, “busy season”, in order to accommodate financial reporting deadlines for calendar yearend publicly traded companies.1 In the extreme instance, the overstimulation from high workloads can result in cognitive fatigue (Cohen 1980). However, this cognitive fatigue can be mitigated by the predictability and expectations of the increase on workload, which may cognitively prepare professionals and prevent cognitive fatigue (Glass and Singer 1972). The PCAOB and Center for Audit Quality (CAQ) have expressed concerns regarding audit workloads and whether they affect audit quality because audit personnel are audit firms’ largest asset and time is finite (Pfeffer 1998; Hanson 2013; CAQ 2014). Using the ratio of total assets per audit personnel in an audit office, we examine the association between busy season audit workloads and audit quality at the office level.
Survey and experimental studies indicate a negative relationship between audit quality and employee workloads (Persellin, Schmidt, and Wilkins 2015; Jones, Norman, and Wier 2010; Sweeney and Summers 2002; Fogarty, Singh, Rhoads, and Moore 2000; Sanders 1998). For example, Persellin et al. (2015) survey audit practitioners regarding busy season and the
workload requirements and quote one practitioner saying, “I believe that after a couple of months of working 60+ hours, employees begin to get burned out, which results in reduced work quality. From my experience, when you are over worked, in a high stress environment, and you are not
2
getting enough sleep or exercise, and this continues for months on end, there is no possible way for you to be as productive, efficient, or sharp as you would be under normal circumstances. In this environment, decrease in quality of work is inevitable.” The PCAOB proposed auditor’s work leverage as an audit quality indicator because when resources are spread thin, it directly affects the inputs available for audits within an office (PCAOB 2015). Despite the anecdotal evidence and regulators’ interest in the effects of auditor’s workloads on audit quality, the audit literature currently does not consider the effect of workload at the office level. This association is crucial to investigate at an office level, as there are significant variations in audit quality for different offices of the same audit firm (Francis and Yu 2009).
The accounting profession is particularly susceptible to periods of greater workloads as auditees with calendar year ends (December 31) have similar filing deadlines, which results in temporary increases in auditor workloads. An increase in workload during busy season is expected for auditors, but as busy season progresses, the ability to effectively maintain the quality of work may decrease due to audit personnel becoming overly stressed and tired, which decreases the ability to carry out complex and specific tasks (Cohen 1980). However, long hours are expected by audit professional and audit firms have invested a significant amount of effort and money to develop programs and initiatives aimed at providing employees work-life balance to combat the stressors associated with public accounting, including increased workloads (e.g., Buchheit, Dalton, Harp, and Hollingsworth 2016).
Two conflicting theories explain how increased workloads may affect audit quality. Cognitive fatigue theory posits prolonged exposure to an environmental factor (i.e., increased workload), results in stress and may decrease auditors’ attention capacities (Cohen 1980). Cognitive fatigue would explain an overall decrease in audit quality due to the inability of audit
3
personnel performing audit tasks during this prolonged period of exposure to stressors. Prolonged exposure to stress from increased workloads may result in compromised audit
procedures and impaired auditor judgment, which could affect the quality of the audit (Persellin, Schmidt, and Wilkins 2015; PCAOB 2015). The cognitive fatigue theory posits that stress resulting from circumstances, such as auditors becoming overworked from long hours, impairs the ability to perform demanding tasks (Cohen 1980). This possible effect of increased
workloads is inherent to audit firms and seasonality dictated by client deadlines.
On the other hand, the adaptive cost theory suggests the predictability of stressors (i.e., increases in workloads) mitigates the adverse effects of stress (Glass and Singer 1972). Thus, the predictability of increased workload during busy season may diminish the potential of auditors’ cognitive fatigue and would not result in lower quality of performance. The seasonality and predictability of the accounting profession present a unique setting to analyze the effects of stress associated with workloads (Herda and Lavelle 2012; Persellin et al. 2015).
We use the intersection of Audit Analytics, Compustat, and data provided by Infogroup, a marketing firm specializing in business information, for 2005 through 2014 to examine the influence of office workload, using the ratio of total assets audited to the number of employees, on audit quality. We restrict the sample to calendar year end (e.g., December 31) companies required to have an external audit because these companies induce the busy-season effect. We measure audit quality using misstatements and missed internal control deficiencies.
Overall, we find a positive association between the workload of an audit office and the likelihood of the financial statements being misstated for accelerated filers. These findings support auditors experiencing cognitive fatigue with greater workload leverages, which results in lower audit quality for busy season clients. More notably, we find Non-Big 4 and
non-second-4
tier firms drive our results for accelerated filers, which may be due to Non-Big 4 audit firms being susceptible to staffing constraints. This finding may reflect the inability of smaller audit firms to reallocate staff as easily as larger audit firms do in order to manage each auditor’s utilization rate. For Non-Big 4 firms we find, on average, the odds of misstating the financial statements increase by 2.5% when the workload is increased by a standard deviation. We find a decrease in audit quality as audit workload increases for non-accelerated clients audited by Big 4 firms, which may be indicative of a more prolonged busy season adversely affecting the audit quality. Overall, these results support the cognitive fatigue theory, which suggests greater exposure to stress and increased workloads is associated with decreased work quality.
Our study contributes to several streams of accounting literature. First, we contribute to the literature that examines accountant workload by providing support that quality of auditor output decreases as the workload for employees increase. Our findings provide empirical evidence to regulators that are considering measures associated with audit quality and that may serve as indicators to audit committees and practitioners. Further, this study provides evidence of the necessity of audit firms developing and supporting alternative work arrangements to address employee turnover that may be due to cognitive fatigue. This study contributes to the literature that examines audit office characteristics that influence office audit quality by identifying another input to the audit production function. Finally, our study extends the audit literature that focuses on audit quality. We examine audit quality throughout the busy season period, rather than the entire calendar year. It is important to understand audit quality and determinants of audit quality in this period as over half of the public companies served by accounting firms have a calendar year-end. Concurrent deadlines for companies with December 31 year ends results in increases in audit firm workload to meet the deadlines. Our study suggests the increased
5
workload to meet client deadlines during busy season is associated with a negative effect on audit quality and is another defining difference between Non-Big 4, second-tier, and Big 4 audit firms.
The remainder of the paper is as follows. Section two provides a background and develops our hypotheses. Section three describes our sample and data, section four provides details of our research design. Section five discusses our results and additional analyses. Finally, section six concludes.
II. LITERATURE REVIEW AND HYPOTHESES DEVELOPMENT
Literature Review
There is a plethora of literature that considers employee burnout of professions and job outcomes (e.g., Almer and Kaplan 2002; Almer, Cohen, and Single 2003; Almer and Single 2004; Cohen and Single 2001). Extreme work related stress can result in emotional exhaustion, depersonalization, and reduced personal accomplishment (Sweeney and Summers 2002; Freudenberger 1975) and can affect employee turnover rates, employee stress levels, and employee performance (Cordes and Dougherty 1993; Maslach 1982). Stress can be thought about on a continuum with burnout describing the extreme consequence of stress (Fogarty et al. 2000). The inputs of audit tests and engagement team personnel directly affect the observable outcomes of the audit (Francis 2011). The quality of the inputs are not only a function of the ability of the auditor, but also the structure and environment of which the audit personnel exist. Thus, stress may affect auditors’ ability to provide high quality audits.
Accounting research has focused on the effects of employee burnout and job outcomes (e.g., Guthrie and Jones 2012; Herda and Lavelle 2012). However, these studies examine outcomes other than performance (i.e., turnover intentions), or are experimental, and lack the
6
ability to empirically test the effects of workload on job performance. Modeling burnout using archival data becomes difficult due to data availability. For example, Fogarty et al. (2000)
explores burnout within the accounting profession and the effect on the behavioral and attitudinal outcomes and suggests separate treatment variables are necessary for role conflict, role
ambiguity, and role overload when examining burnout. Observable empirical measures of these variables do not exist for U.S. publicly traded companies. Thus, we first review the accounting literature considering workload and employee outcomes and then provide alternative theories that apply directly to the workload of busy season.
The Effect of Workload on the Auditing Profession
Auditors’ workloads increase substantially during busy season (i.e., the first quarter of the year – January through March) to meet simultaneous reporting deadlines of clients with calendar (or near) year-ends. Audit firms allocate a portion of the workload associated with meeting these reporting deadlines to an interim date (September through December) as well as utilizing outsourcing; however, local offices serving the client still perform a majority of the work during busy season. Sweeney and Summers (2002) provide evidence that auditor’s workload leverage surrounding filing deadlines induces auditor burnout, but whether the office workload influences audit quality is unknown.
More recently, Chang et al. (2017) examine the effect of workload leverage at a national firm level and find a positive association between workload and the likelihood of the PCAOB reporting a deficiency during the firm’s triennial inspection. We improve upon this study by considering the effect of workload at the office level on an annual basis as opposed to the national level on a triennial basis and consider two different measures of audit quality. This distinction in measures and design choice are crucial, as Francis and Yu (2009) find variation
7
among Big 4 audit firm offices. Buchheit et al. (2016) also find variation in firm size and
employee satisfaction when examining the effect of alternative work arrangements in combating employee dissatisfaction and work-life balance. Their study provides evidence that employees working for smaller public accounting firms have lower instances of burnout compared to employees working in industry. However, their study focuses on the perceptions of burnout and not the effect on performance or factors that may mitigate poor performance (i.e., review
process) at larger accounting firms. Thus, it is necessary to consider the office level workload on the office audit quality and any factors that may potentially mitigate the adverse effect of
workload.
Herda and Lavelle (2012) use social exchange perspective to examine the effects of burnout and similarly find increased signs of auditor burnout positively associated with turnover intentions. However, this effect is moderated by perceived audit firm fairness, which one could argue busy season hours are perceived as necessary and fair as they are expected and clearly communicated to employees. Persellin et al. (2016) surveyed auditors and found the quality of work begins to diminish when they work only five hours above the forty hour-week threshold and the increased workload is partly due to internal constraints (i.e., meeting client deadlines and staffing shortages) as well as external constraints (i.e., PCAOB pressure). When faced with these circumstances that result in stress, audit procedures are compromised, audit judgment is
impaired, and professional knowledge is difficult to retain, which results in lower audit quality. While workload leverage has negative effects on employee performance, there are a few factors that may mitigate this effect (i.e., healthy lifestyle, firm quality control initiatives). For example, Jones et al. (2010) find healthy lifestyles mitigate the result of stress progressing into burnout. Additionally, when audit firms experience growth, they are able to adapt and only
8
temporarily produce lower quality audits when an increase in the clientele occurs (Bills et al. 2016). This ability of an audit office to adapt may be due to the ability to reallocate or hire additional human capital to accommodate busy season demands and meet client deadlines and maintain consistent audit quality.
Prior literature emphasizes burnout within the auditing profession as an explanation for the association between workload and job outcome (i.e., turnover). The demands on auditors during busy season can lead to (1) employee burnout for auditors (Fogarty et al. 2000; Almer and Kaplan 2002), (2) poor auditor effort due to emotional exhaustion, and (3) a depersonalized approach to audit tasks (Sweeney and Summers 2002). The PCAOB’s Concept Release on Audit Quality (PCAOB 2015) expounds the relationship between workload and audit quality. There is concern that greater workload leverages may not allow adequate supervision and review of the audit process and audit judgements, which would reduce audit quality. The PCAOB recognizes sufficient time is necessary to audit quality and less supervision driven by higher workloads increases the risk of “less effective audits” (PCAOB 2015).Because stress levels do not have to escalate to the burnout level to affect employee performance and there are methods that mitigate the adverse effects of high workloads, we introduce two competing theories, cognitive fatigue and adaptive-cost, to better understand the effects of workload on auditors’ performance.2 Cognitive Fatigue Hypothesis
Schuler (1980) defines stress as a condition in which employees are faced with constraints when attempting to achieve tasks that work towards a known goal. The cognitive fatigue theory suggests as the load and duration of stressors increase the ability to adapt and cope with the stressors decreases. These increasing load and duration results in lower performance.
2 These two theories do not in any way minimize the burnout theory; however, the construct is broader in order to consider the progression and adaptability of stress over busy season.
9
The capacity to process tasks individually is also affected, which leads auditors to ignore specific client needs and provide a “check the box” audit (Daley 1979). This approach to coping with stimuli affects the quality of audit tasks as well as auditor judgment. Additionally, auditors experiencing prolonged exposure to increased workloads minimize their involvement with other team members and decrease the synergy among team members on an audit (Daley 1979). Adaptive-Cost Hypothesis
Glass and Singer (1972) discuss the notion of predictable and unpredictable stressors and their effects on performance. Broadbent (1979) found an association between stress and
performance when conducting a human experiment using noise and the speed in which colors were named post-stimulus. However, this finding only persisted for the group that was not forewarned about the exposure to noise. The adaptive-cost hypothesis suggests individuals are more able to cope with stressors when they are predictable, and the adaption to stressors is what drives individuals’ performances (Cohen 1980). An adverse post-stimulus effect is often likely to occur only when the stressor is unpredictable. The predictability of stressors can be transferred to auditor’s experience with busy season, as auditors have months to prepare and anticipate the increased workload associated with busy season. The adaptive-cost theory suggests the
knowledge and predictability of the increase in workload would mitigate any potential decrease in audit quality.
Hypotheses Development
The effect of the increase in workload auditors experience during busy season may result in the inability to cope with prolonged exposure to stress and result in decreased audit quality. The prolonged exposure to an increased workload may activate cognitive fatigue and result in auditors cutting corners, judgment being adversely affected, and turnover of competent staff,
10
which would directly affect the audit office’s quality of the audit. In addition, the increased workload could rise to the level not effectively managed by the current level of employees. Contrarily, the predictability and well-known occurrence of busy season may mitigate any negative effects of the stress associated with increased workloads through enhanced coping mechanisms. As the effect of an increased workload is unknown, we state the following null hypotheses:
H1: Busy season office workload does not affect audit quality for calendar yearend clients.
III. RESEARCH DESIGN
Variables of Interest
Our study examines the influence of the workload leverage of audit personnel on audit quality. To capture workload leverage of audit personnel, we use the ratio of total audit work to the accessibility of audit personnel for each audit office. H1 examines the office level workload and its influence on the overall audit quality of an office. We use an office level measure of the workload leverage by scaling the total assets audited by an office for all December year-end clients that are large accelerated filers or accelerated filers by the total number of audit personnel for the audit office (WorkLev_Office). Figures 1, 2, and 3 depict the winsorized distribution of WorkLev_Office for the full sample, Big 4 Sample, and Non-Big 4 Sample, respectively. These figures show the variables behaves close to a normal distribution with a smoother distribution for the offices of Non-Big 4 firms.
<<<Insert Figures 1, 2, and 3 Here>>>
Dependent Variables
Audit quality is a facet of financial reporting quality, and as the financial statements are a joint output of management and the auditors (Defond and Zhang 2014; Francis 2009; DeAngelo
11
1981); therefore, it is necessary to consider ex-post measures specific to the inputs of the audit firm. We consider two different measures of audit quality that are indicative of audit failures and predominately driven or influenced by the audit firm’s workload leverage, specifically
restatements and missed internal control weaknesses.
Restatements are a strong signal of poor audit quality and indicate an audit failure
(Christensen et al. 2015; Blay, Sneathen, and Kizirian 2007). The audit failure is the result of the auditors not appropriately managing the audit risk by varying the extent, nature, and timing of the audit procedures (i.e., detection risk). We define restatements as an indicator variable equal to one if the yearend period under audit is subsequently restated (Restatement). Similar to
restatements, missed internal controls that surface in subsequent years related to the prior period, signal another type of audit failure. Higher quality audits are less likely to have missed internal control weaknesses (Rice and Weber 2012). Consistent with Rice and Weber (2012), we measure missed internal controls as an indicator variable equal to one (zero otherwise) when an internal control weakness related to a restatement is subsequently reported that relates to the current year (MissMW).
To capture the overall office level quality, we take the sum of Restatement and MissMW, by office and scale by total clients. This yields a proportion measure of restatements and missed material weaknesses at the office level reported as Restatement_Office and MissMW_Office, respectively.
Empirical Models
To test H1, we regress the two different measures of audit quality (AuditQuality) on the work leverage for the office and control variables. We estimate the following regression:
12
Where the dependent variable is one of the office level measures of audit quality,
Restatement_Office and MissMW_Office. The variable of interest is WorkLev_Office, which measures the workload leverage at the office level. We include as control variables
characteristics of the clients that would affect the probability of restatement. All variables are measured at the office level to capture variation in client characteristics across clients. We include Competition as the natural log of the number of similarly-sized offices located in the same locale.3 We include Percent LAF and Avg_Days_Early to proxy for the reporting pressures of the office’s clients. Percent LAF is the measure of the percent of the office’s clients that are large accelerated filers. These clients have the earliest filing deadline, and are often the most complex clients. Avg_Days_Early captures the average number of days the office’s clients file earlier than their deadline. Early filers impose additional stress and pressure on the office engagement team. Avg_NAS_Ratio is a measure of the average non-audit fees scaled by total audit fees for the offices clients and represents a measure of reporting independence. We also include the average client age (Avg_Client_Age) and a Big 4 indicator variable. The remaining controls (Avg_ROA, Avg_MtoB, Avg_Disc_Accruals, Avg_Cash_Flow, Avg_Loss,
Avg_Leverage, Avg_Litigation, Avg_M&A) are used to hold constant other client characteristics that influence the complexity of the financial statements, which may affect restatement rates. When including Restatment_Office as the audit quality measure, Avg_ICW is also included to control for the influence of an office’s internal controls on the likelihood of restating the financial statements (Rice, Weber, and Wu 2015). These controls variables are included in the
3 All office-level measures are done at the Metropolitan Statistical Area (MSA) level. See
http://www.census.gov/population/metro/ for more information regarding MSAs. The marketing firm database supplies rough approximations for office size in terms of employees. Competition is only considered if the office is in the same size category, one smaller, and one larger.
13
analysis as the average measure for the clients in an office.
Sample Selection
Our initial sample is an intersection of Compustat, Audit Analytics. We supplement these data with employee count data from Infogroup (www.infogroup.com), a marketing firm that specializes in providing information for business-to-business marketing such as direct mail and e-mail. This marketing firm uses several approaches to gathering data including a call center that calls each business directly to verify data gathered from public records such as state filings, utilities, and telephone directories. Exact employee headcounts are not available from the data; however, the marketing firm places each office location into one of nine size categories
according to employee count. For example, the first three size categories are 1-4 employees, 5-9, employees, 10-19 employees. This continues through the last group, which is all offices with more than 1,000 employees.
The sample period we analyze is 2005 to 2014 and all observations are required to have positive assets in Compustat, audit fee data and office location data in Audit Analytics, and relevant employee count data in the Infogroup database. Table 1 reports that for the roughly 10,000 office years identified in Audit Analytics only 3,161 have enough data to be considered. Some smaller offices do not have accelerated filer clients yielding 2,979 office years for our analysis.
<<<Insert Table 1 Here>>>
To capture the busy season effect we limit the sample to companies with December yearends that qualify as large accelerated filers or accelerated filers. This ensures the clients of interest file 10Ks within the first quarter of the year and add to the busy-season workload and are required to have a SOX 404 audit. As the traditional busy season for audit personnel begins after
14
the December 31 year ends, we include year ends surrounding the traditional December 31 year end by two weeks, but consider the commencement of the traditional busy season is driven by clients with December 31 year ends. Our final sample consists of 2,979 audit office-year observations.
IV. RESULTS
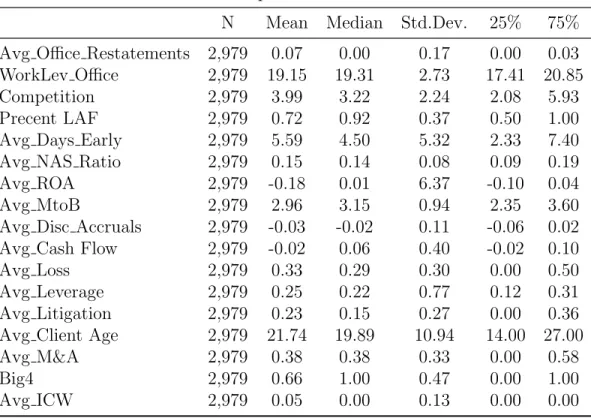
Table 2 reports summary statistics for the sample of audit office-year observations. The summary statistics indicate the average (median) office has a seven (zero) percent restatement rate and five (zero) percent rate of missing internal control weaknesses.
<<<Insert Table 2 Here>>>
On average, audit offices in our sample issue the financial statements approximately six days prior to the deadline. Sixty-six percent of our sample are Big 4 audit firms and on average 23 percent of the clients operate in litigious industries.
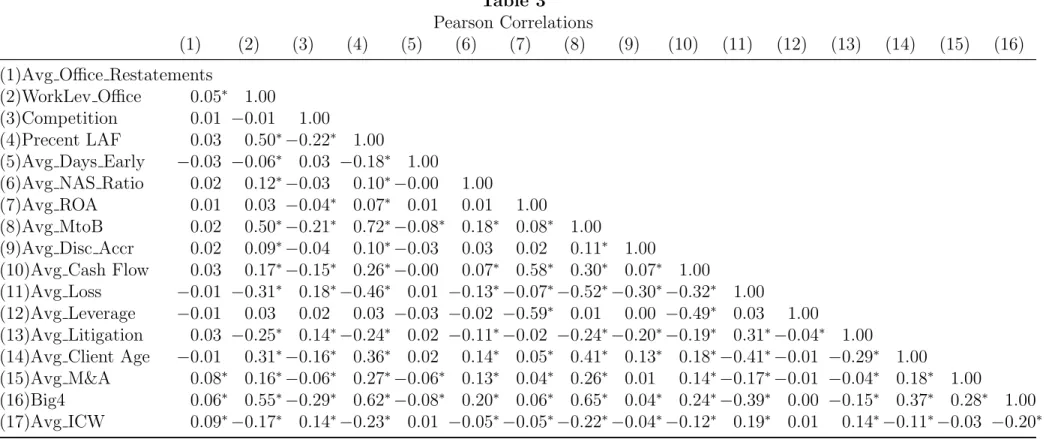
Table 3 presents Pearson correlations among the variables in the multivariate analysis. <<<Insert Table 3 Here>>>
The variable of interest, WorkLev_Office, is positively associated with the rate of misstatements in an office. Not surprisingly, Table 3 reports that WorkLev_Office is highly correlated with an office’s percent of clients that are Large Accelerated Filers. As Percent_LAF increases, so do the assets an audit office needs to audit. Further, WorkLev_Office is negatively correlated with filing the 10K early.
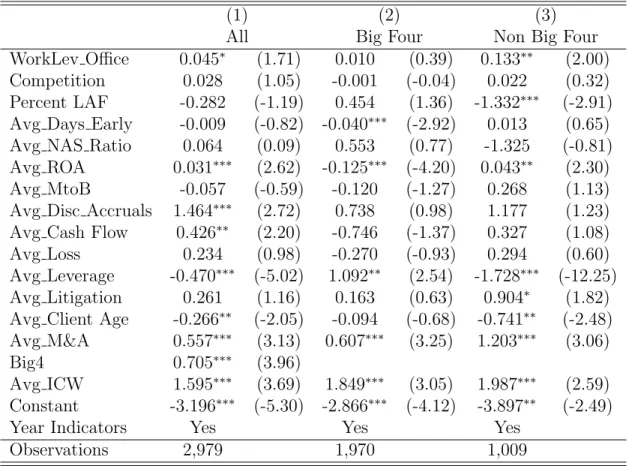
Table 4 reports the main results of estimating equation (1) using a Fractional Logistic regression. A Fractional Logistic analysis is appropriate, as the dependent variable is a
15
proportional measure including both endpoints of zero and one (King and Zeng 2001). <<<Insert Table 4 Here>>>
In column (1), the table reports that controlling for other client and office characteristics, WorkLev_Office is positively associated with restatements (p-value <0.10). This indicates that as work demands increase, auditors perform their job with decreasing quality.
A positive and significant coefficient on Avg_ROA, Avg_Disc_Accrual, Avg_Cash_Flow, Avg_M&A, Big4, and Avg_ICW suggests offices with clients with greater return on assets, higher discretionary accruals, greater cash flows, more mergers or acquisitions, Big 4 Audit Firms, and auditors with clients with more internal control weaknesses are more likely to have a higher percentage of misstatements. The negative and significant coefficients on Avg_Leverage and Avg_Client_Age suggest audit offices with greater leveraged clients and older clients are less likely to misstate the financial statements.
Column (2) and (3) of Table 4 split the sample on Big 4 and Non-Big 4 audit firms, respectively because Big 4 audit firms have greater resources that could potentially mitigate negative effects of high workload. The insignificant coefficient on WorkLev_Office in column (2) and significant coefficient on WorkLev_Office in column (3) (p- value <0.05) suggests the results are driven by offices of Non-Big 4 firms. Big 4 audit firms may be better equipped to reallocate employee resources across offices and manage employee utilization more effectively, which would support the adaptive cost hypothesis theory. This ability to reallocate employee’s efforts would alleviate the cognitive fatigue experienced by the employees. The Non-Big 4 results indicate a 2.5 percent increase in the odds of a restatement with a standard-deviation increase in WorkLev_Office, which supports the cognitive fatigue theory. With a significantly negative coefficient on Percent LAF for Non-Big 4 offices, we infer these offices focus audit
16
quality for their largest clients, which hinders their ability in later weeks during busy season for the accelerated filer clients.
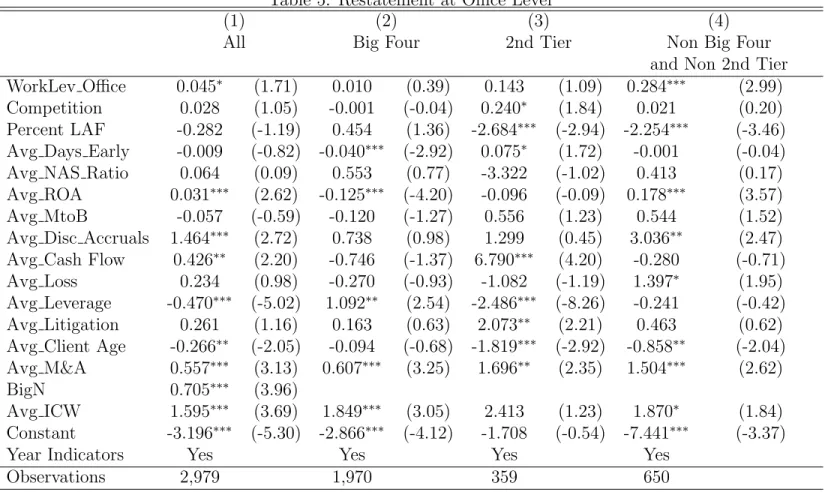
The size of Non-Big 4 firms varies widely; therefore, Table 5 separates Non-Big 4 firms into Second-Tier firms and other Non-Big 4 firms. We define second-tier firms as those
additional PCAOB annually inspected firms as opposed to all other triennially inspected firms. <<<Insert Table 5 Here>>>
Results for these cross sections are reported in columns (3) and (4), respectively, of Table 5. The positive and significant coefficient on WorkLev_Office (p-value <0.01) in column (4) depicts that the smaller Non-Big 4 firms are driving the results. The increased coefficient on WorkLev_Office in column (4) indicates a 4 percent increase in the odds of restatement for a one standard deviation increase in WorkLev_Office for the smaller Non-Big 4 offices.
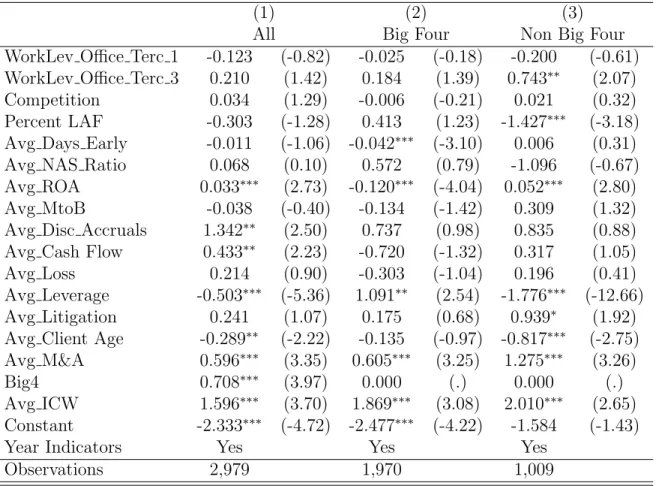
We test the linearity of the discovered relation between restatements and WorkLev_Office by including tercile measures of our variable of interest, WorkLev_Office, rather than a
continuous measure. We use the second tercile as the holdout group to note any non-linear trends in the first and third quartiles relative to the second. A U or inverse-U shape in the findings results in consistently signed coefficients on the first and third tercile indicator variables. Coefficients of opposite signs indicates a linear relation. Results of this analysis are reported in Table 8. We find negative, albeit insignificant, coefficients on the Tercile 1 indicator, and statistically positive coefficient on the Tercile 3 indicator. These results are consistent with a positive and linear relation between WorkLev_Office and restatements.
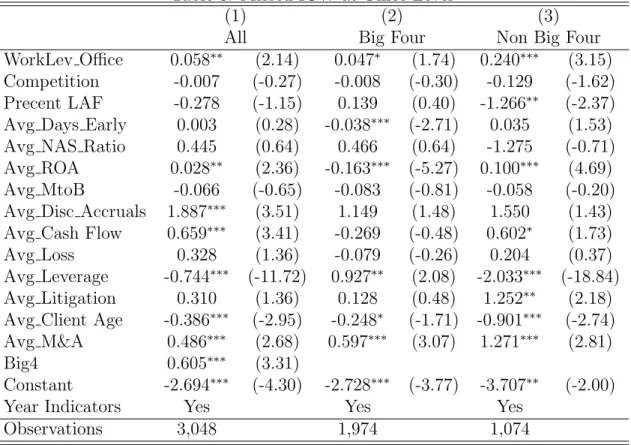
An additional measure of audit quality is missed internal controls (Rice and Weber 2012). We test the relation between WorkLev_Office and missed internal control weaknesses and the
17
results of this analysis are reported in Table 6.
<<<Insert Table 6 Here>>>
We find statistically significant positive coefficients for WorkLev_Office at the full sample, Big 4, and Non Big 4 office level in columns (1), (2), and (3), respectively (p-value <0.05; p-value <0.10; and p-value <0.01, respectively). This is consistent with the cognitive fatigue of auditors negatively affecting internal control work as well as financial statement audit procedures. While much of the internal control work is performed before busy season, quarterly and yearend controls must be tested during busy season and contribute to cognitive fatigue during this period. Taken together, the restatement results and the missed internal control weakness results indicate workload leverage is negatively associated with audit quality.
V. ADDITIONAL ANALYSIS
As a falsification test, we estimate equation (1) for only the non-accelerated clients of offices with December 31 yearends. Non-accelerated filer clients are much smaller than
accelerated clients and have a full month (two weeks) extra to file their audited annual financial statements when compared to large accelerated filer clients (accelerated filer clients). With the decreased stress due to client size and additional time, we expect the null hypothesis to be more credible for non-accelerated clients.
We report results of equation (1) for non-accelerated filers in Table 7. As predicted, we find no association between WorkLev_Office and restatements for the full sample or the Non Big 4 sample. However, when we split the sample on Big 4 and Non-Big 4, we do find a positive association between restatements and WorkLev_Office for Big 4 offices (p-value <0.05). This result may be due to Big 4 offices’ cognitive fatigue affecting their smaller clients due to prolonged busy seasons extending beyond the accelerated client’s deadlines. This finding is
18
consistent with Big 4 offices focusing their efforts on their largest clients and offering fatigued audit inputs to their smaller clients.
VI. CONCLUSION
This study examines the influence of workload leverage on audit quality for Big 4 and Non-Big 4 audit firms throughout busy season. The seasonal increase in workload for public accountants has the potential to overstimulate professionals and cause cognitive fatigue (Cohen 1980). Cognitive fatigue adversely affects job performance and results in lower audit quality. However, there have been investments made by audit firms in an attempt to provide work life balance in order to mitigate cognitive fatigue (Buchheit et al. 2016). The adaptive cost theory suggests the predictability of the increase in workload leverage may mitigate the adverse effects of the stress associated with the audit because the busy season period is known and expected by audit personnel. Using the total assets per audit personnel in an audit office we examine the effect on audit quality using financial statement misstatements and missed internal control weaknesses. If auditors experience cognitive fatigue, we would expect to find the workload leverage influences audit quality. Alternatively, if the predictability of the increased workload mitigates the adverse effects we would not find an association between workload leverage and audit quality.
When examining the association of audit office workload leverage for accelerated clients, on audit quality, we find a negative association for Non-Big 4 audit firms. However, when examine the association between audit office workload leverage and audit quality for non-accelerated filers we find a negative association for Big 4 audit firms. These results suggest that both Big 4 and Non-Big 4 audit firms experience cognitive fatigue during busy seasons, although at different points. This difference may be the result of different resources available to the audit
19
firm to redistribute and reallocate work hours to effectively manage employee utilization rates. Our study is limited as our data is not granular enough to identify the number of staff at each level of the audit firm (i.e., staff, manager, partner) nor can we identify which clients suffer the most workload leverage. We are also not able to track the location of each employee in which they work and only have data pertaining to the office in which they are employed. We believe future research should consider the allocation of hours among staffing levels within the audit firm and the influence of workload leverage at different levels.
With the reoccurrence of a busy season each year driven by client deadlines, the stressors associated with workload will continue for the accounting profession. The PCAOB recognizes the challenge the profession faces in order to accommodate simultaneous clients’ deadlines. In a 2015 Concept Release, the PCAOB suggests workload leverage as an indicator of audit quality. Understanding the association of the workload leverage as it relates to audit quality will allow regulators to make informed decisions pertaining to the required disclosures. Further, it provides additional support for practitioners to develop methods to allocate and manage utilization rates.
20
VII. REFERENCES
Almer, E.D., J. R. Cohen, and L. E. Single. 2003. Behavioral determinants that affect perceived career success of flexible work arrangement participants: The non-Big 5 experience. Auditing: A Journal of Practice & Theory 22 (1): 1–23.
Almer, E.D., and S.E. Kaplan. 2002. The effects of flexible work arrangements on stressors, burnout, and behavioral job outcomes in public accounting. Behavioral Research in
Accounting 14: 1-34.
Almer, E.D., and L. E. Single. 2004. Career consequences of flexible work arrangements: The daddy track. The CPA Journal (September): 56–58.
Bills, K. L., Q. T. Swanquist, and R. L. Whited. 2015. Growing pains: Audit quality and office growth. Contemporary Accounting Research 33 (1): 288-313.
Blay, A., L. D. Sneathen Jr., and T. Kizirian. 2007. The effects of fraud and going-concern risk on auditors’ assessments of the risk of material misstatement and resulting audit procedures. International Journal of Auditing 11 (3): 149–163.
Broadbent, D.E. 1979. Human performance and noise. In C.M. Harris (Ed.), Handbook of noise control (2nd ed., pp. 17.1–17.20). New York: McGraw-Hill.
Buchheit, S., Dalton, D.W., Harp, N.L., and Hollingsworth, C.W. 2016. A contemporary analysis of accounting professionals work-life balance. Accounting Horizons. 30(1): 41-62. Buchheit, S. and Buslepp, W.L. 2016. PCAOB Form 2 disclosure: a firm-level signal of audit quality? Working Paper, University of Alabama.
Center For Audit Quality (CAQ). 2014. CAQ approach to audit quality indicators. (April) Available at: http://www.thecaq.org/docs/reports-and-publications/caq-approach-to-auditquality-indicators-april-2014.pdf?sfvrsn=2
Chang, C.J., Luo, Y., and Zhou, L. 2017. Audit deficiency and auditor workload: evidence from PCAOB triennially inspected firms. Review of Accounting and Finance, 16 (4): 478-496.
Christensen, B. E., S. M. Glover, T. C. Omer, and M. K. Shelley. 2016. Understanding audit quality: Insights from audit partners and investors. Contemporary Accounting Research 33 (4): 1648-1684.
Cohen, Sheldon, "Aftereffects of stress on human performance and social behavior: A review of research and theory." (1980). Department of Psychology. Paper 281.
21
Cohen, J. R.., and L. E. Single. 2001. An examination of the perceived impact of flexible work arrangements on professional opportunities in public accounting. Journal of Business Ethics 32 (4): 317–328.
Cordes, C. L., and T. W. Dougherty. 1993. A review and integration of research on job burnout. Academy of Management Review 18 (4): 621–656.
Daley, M.R. 1979. Burnout: Smoldering Problem in Protective Services. Social Work 24 (5): 375-379.
DeAngelo, L. E. 1981. Auditor size and audit quality. Journal of Accounting and Economics 3 (3): 183-199.
DeFond, M., and J. Zhang. 2014. A review of archival auditing research. Journal of Accounting and Economics 58 (2): 275-326.
Freudenberger HJ. 1975. The staff burnout syndrome in alternative institutions. Psychother. Theory Res. Pract. 12:72–83
Hanson, J. 2013. Keynote Address. 12th Annual Financial Reporting Conference, Baruch College–CUNY, New York, NY, May 2. Available at:
https://pcaobus.org/News/Speech/Pages/05022013_Hanson.aspx
Fogarty, T.J., Singh, J., Rhodes, G.K., and Moore, R.K. 2000. Antecedents and Consequences of Burnout in Accounting: Beyond the Role Stress Model. Behavioral Research in Accounting 12: 31-67.
Francis, J. R. 2011. A framework for understanding and researching audit quality. Auditing: A Journal of Practice and Theory 30 (2): 125-152.
Francis, J., and M. Yu, 2009. The effect of Big 4 office size on audit quality. The Accounting Review 84 (5): 1521–1552.
Glass, D.C., and Singer, J.E. 1972. Behavioral Aftereffects of Unpredictable and Uncontrollable Aversive Events. American Scientist 60: 457-465.
Guthrie, C. P., and Jones, A. 2012. Job Burnout in Public Accounting: Understanding Gender Differences. Journal of Managerial Issues XXIV (4): 390-411.
Herda, D.N. and Lavelle, J.J. 2012. The Auditor-Audit Firm Relationship and Its Effect on Burnout and Turnover Intention. Accounting Horizons 26 (4): 707-723.
Jones, A., C. S. Strand, and B. Wier. 2010. Healthy lifestyles as a coping mechanism for role stress in public accounting. Behavioral Research in Accounting 22 (1): 21–41.
22
Karasek, R. (1979). Job Demands, Job Decision Latitude, and Mental Strain: Implications for Job Redesign. Administrative Science Quarterly, 24 (2): 285-308.
King, G. and L. Zeng. 2001. Logistic regression in rare events data. Political Analysis 9 (2): 137-163.
López, D.M, and Peters, G. F. 2012 The Effect of Workload Compression on Audit Quality. Auditing: A Journal of Practice & Theory 31 (4): 139-165.
Maslach C. 1982. Burnout: The Cost of Caring. Englewood Cliffs, NJ: Prentice-Hall Persellin, J., J. J. Schmidt, and M. S. Wilkins. 2015. Auditor Perceptions of Audit Workloads, Audit Quality, and the Auditing Profession. Working Paper.
Pfeffer, J. 1998. The Human Equation: Building Profits by Putting People First. Boston: Harvard Business School Press.
Public Company Accounting Oversight Board. 2015. "Audit Committee Dialogue." May 2015.
Rice, S. C., and D. P. Weber. 2012. How effective Is internal control reporting under SOX 404? Determinants of the (non-) disclosure of existing material weaknesses. Journal of Accounting Research 50 (3): 811-843.
Rice, S. C., D. P. Weber, and B. Wu. 2014. Does SOX 404 have teeth? Consequences of the failure to report existing internal control weaknesses. The Accounting Review 90 (3): 1169-1200.
Schuler, R.S. 1980. Definition and Conceptualization of Stress in Organizations. Organizational Behavior and Human Performance 25 (2): 184-215.
Sweeney, J.T. and Summers, S.L. 2002. The Effect of the Busy Season Workload on Public Accountants' Job Burnout. Behavioral Research in Accounting 14 (1): 223-245.
Figure 1
Figure 2
Figure 3
Table 1
Sample Selection
Number of unique US-based audit office-year pairs identified from Audit Analytics for the period 2005 - 2014
10,282
Less: Number of office-years located within the same MSA (405)
Less: Number of office-years without Audit Analytics values for
client control variables
(2,841)
Less: Number of office-years without Compustat values for client
control variables, including discretionary accruals
(3,129)
Less: Number of office-years without a December yearend client (746)
3,161 3,161
Less: Number of office-years without a Large Accelerated Filer
client of Accelerated Filer Client
(182)
Final Sample for Accelerated Filer Analysis 2,979
3,161
Less: Number of office-years without a Non-Accelerated Filer Client (325)
Final Sample for Non-Accelerated Filer Analysis 2,836
Table 2
Descriptive Statistics
N Mean Median Std.Dev. 25% 75%
Avg Office Restatements 2,979 0.07 0.00 0.17 0.00 0.03
WorkLev Office 2,979 19.15 19.31 2.73 17.41 20.85
Competition 2,979 3.99 3.22 2.24 2.08 5.93
Precent LAF 2,979 0.72 0.92 0.37 0.50 1.00
Avg Days Early 2,979 5.59 4.50 5.32 2.33 7.40
Avg NAS Ratio 2,979 0.15 0.14 0.08 0.09 0.19
Avg ROA 2,979 -0.18 0.01 6.37 -0.10 0.04
Avg MtoB 2,979 2.96 3.15 0.94 2.35 3.60
Avg Disc Accruals 2,979 -0.03 -0.02 0.11 -0.06 0.02
Avg Cash Flow 2,979 -0.02 0.06 0.40 -0.02 0.10
Avg Loss 2,979 0.33 0.29 0.30 0.00 0.50
Avg Leverage 2,979 0.25 0.22 0.77 0.12 0.31
Avg Litigation 2,979 0.23 0.15 0.27 0.00 0.36
Avg Client Age 2,979 21.74 19.89 10.94 14.00 27.00
Avg M&A 2,979 0.38 0.38 0.33 0.00 0.58
Big4 2,979 0.66 1.00 0.47 0.00 1.00
Avg ICW 2,979 0.05 0.00 0.13 0.00 0.00
Variable definitions located in the text.
Table 3
Pearson Correlations
(1) (2) (3) (4) (5) (6) (7) (8) (9) (10) (11) (12) (13) (14) (15) (16)
(1)Avg Office Restatements
(2)WorkLev Office 0.05∗ 1.00
(3)Competition 0.01 −0.01 1.00
(4)Precent LAF 0.03 0.50∗−0.22∗ 1.00
(5)Avg Days Early −0.03 −0.06∗ 0.03 −0.18∗ 1.00
(6)Avg NAS Ratio 0.02 0.12∗−0.03 0.10∗−0.00 1.00
(7)Avg ROA 0.01 0.03 −0.04∗ 0.07∗ 0.01 0.01 1.00
(8)Avg MtoB 0.02 0.50∗−0.21∗ 0.72∗−0.08∗ 0.18∗ 0.08∗ 1.00
(9)Avg Disc Accr 0.02 0.09∗−0.04 0.10∗−0.03 0.03 0.02 0.11∗ 1.00
(10)Avg Cash Flow 0.03 0.17∗−0.15∗ 0.26∗−0.00 0.07∗ 0.58∗ 0.30∗ 0.07∗ 1.00
(11)Avg Loss −0.01 −0.31∗ 0.18∗−0.46∗ 0.01 −0.13∗−0.07∗−0.52∗−0.30∗−0.32∗ 1.00
(12)Avg Leverage −0.01 0.03 0.02 0.03 −0.03 −0.02 −0.59∗ 0.01 0.00 −0.49∗ 0.03 1.00
(13)Avg Litigation 0.03 −0.25∗ 0.14∗−0.24∗ 0.02 −0.11∗−0.02 −0.24∗−0.20∗−0.19∗ 0.31∗−0.04∗ 1.00
(14)Avg Client Age −0.01 0.31∗−0.16∗ 0.36∗ 0.02 0.14∗ 0.05∗ 0.41∗ 0.13∗ 0.18∗−0.41∗−0.01 −0.29∗ 1.00
(15)Avg M&A 0.08∗ 0.16∗−0.06∗ 0.27∗−0.06∗ 0.13∗ 0.04∗ 0.26∗ 0.01 0.14∗−0.17∗−0.01 −0.04∗ 0.18∗ 1.00
(16)Big4 0.06∗ 0.55∗−0.29∗ 0.62∗−0.08∗ 0.20∗ 0.06∗ 0.65∗ 0.04∗ 0.24∗−0.39∗ 0.00 −0.15∗ 0.37∗ 0.28∗ 1.00
(17)Avg ICW 0.09∗−0.17∗ 0.14∗−0.23∗ 0.01 −0.05∗−0.05∗−0.22∗−0.04∗−0.12∗ 0.19∗ 0.01 0.14∗−0.11∗−0.03 −0.20∗
∗ p < .05
Table 4: Restatement at Office Level
(1) (2) (3)
All Big Four Non Big Four
WorkLev Office 0.045∗ (1.71) 0.010 (0.39) 0.133∗∗ (2.00)
Competition 0.028 (1.05) -0.001 (-0.04) 0.022 (0.32)
Percent LAF -0.282 (-1.19) 0.454 (1.36) -1.332∗∗∗ (-2.91)
Avg Days Early -0.009 (-0.82) -0.040∗∗∗ (-2.92) 0.013 (0.65)
Avg NAS Ratio 0.064 (0.09) 0.553 (0.77) -1.325 (-0.81)
Avg ROA 0.031∗∗∗ (2.62) -0.125∗∗∗ (-4.20) 0.043∗∗ (2.30)
Avg MtoB -0.057 (-0.59) -0.120 (-1.27) 0.268 (1.13)
Avg Disc Accruals 1.464∗∗∗ (2.72) 0.738 (0.98) 1.177 (1.23)
Avg Cash Flow 0.426∗∗ (2.20) -0.746 (-1.37) 0.327 (1.08)
Avg Loss 0.234 (0.98) -0.270 (-0.93) 0.294 (0.60)
Avg Leverage -0.470∗∗∗ (-5.02) 1.092∗∗ (2.54) -1.728∗∗∗ (-12.25)
Avg Litigation 0.261 (1.16) 0.163 (0.63) 0.904∗ (1.82)
Avg Client Age -0.266∗∗ (-2.05) -0.094 (-0.68) -0.741∗∗ (-2.48)
Avg M&A 0.557∗∗∗ (3.13) 0.607∗∗∗ (3.25) 1.203∗∗∗ (3.06)
Big4 0.705∗∗∗ (3.96)
Avg ICW 1.595∗∗∗ (3.69) 1.849∗∗∗ (3.05) 1.987∗∗∗ (2.59)
Constant -3.196∗∗∗ (-5.30) -2.866∗∗∗ (-4.12) -3.897∗∗ (-2.49)
Year Indicators Yes Yes Yes
Observations 2,979 1,970 1,009
t statistics in parentheses. ∗ p <0.10,∗∗ p < .05,∗∗∗ p < .01.
Sample limited to yearends in December 31 and to Large Accelerated Filers and Accelerated Filers.
Table 5: Restatement at Office Level
(1) (2) (3) (4)
All Big Four 2nd Tier Non Big Four
and Non 2nd Tier
WorkLev Office 0.045∗ (1.71) 0.010 (0.39) 0.143 (1.09) 0.284∗∗∗ (2.99)
Competition 0.028 (1.05) -0.001 (-0.04) 0.240∗ (1.84) 0.021 (0.20)
Percent LAF -0.282 (-1.19) 0.454 (1.36) -2.684∗∗∗ (-2.94) -2.254∗∗∗ (-3.46)
Avg Days Early -0.009 (-0.82) -0.040∗∗∗ (-2.92) 0.075∗ (1.72) -0.001 (-0.04)
Avg NAS Ratio 0.064 (0.09) 0.553 (0.77) -3.322 (-1.02) 0.413 (0.17)
Avg ROA 0.031∗∗∗ (2.62) -0.125∗∗∗ (-4.20) -0.096 (-0.09) 0.178∗∗∗ (3.57)
Avg MtoB -0.057 (-0.59) -0.120 (-1.27) 0.556 (1.23) 0.544 (1.52)
Avg Disc Accruals 1.464∗∗∗ (2.72) 0.738 (0.98) 1.299 (0.45) 3.036∗∗ (2.47)
Avg Cash Flow 0.426∗∗ (2.20) -0.746 (-1.37) 6.790∗∗∗ (4.20) -0.280 (-0.71)
Avg Loss 0.234 (0.98) -0.270 (-0.93) -1.082 (-1.19) 1.397∗ (1.95)
Avg Leverage -0.470∗∗∗ (-5.02) 1.092∗∗ (2.54) -2.486∗∗∗ (-8.26) -0.241 (-0.42)
Avg Litigation 0.261 (1.16) 0.163 (0.63) 2.073∗∗ (2.21) 0.463 (0.62)
Avg Client Age -0.266∗∗ (-2.05) -0.094 (-0.68) -1.819∗∗∗ (-2.92) -0.858∗∗ (-2.04)
Avg M&A 0.557∗∗∗ (3.13) 0.607∗∗∗ (3.25) 1.696∗∗ (2.35) 1.504∗∗∗ (2.62)
BigN 0.705∗∗∗ (3.96)
Avg ICW 1.595∗∗∗ (3.69) 1.849∗∗∗ (3.05) 2.413 (1.23) 1.870∗ (1.84)
Constant -3.196∗∗∗ (-5.30) -2.866∗∗∗ (-4.12) -1.708 (-0.54) -7.441∗∗∗ (-3.37)
Year Indicators Yes Yes Yes Yes
Observations 2,979 1,970 359 650
t statistics in parentheses. ∗p <0.10, ∗∗p < .05,∗∗∗ p < .01.
Sample limited to yearends in December 31 and to Large Accelerated Filers and Accelerated Filers.
Table 6: Missed ICW at Office Level
(1) (2) (3)
All Big Four Non Big Four
WorkLev Office 0.058∗∗ (2.14) 0.047∗ (1.74) 0.240∗∗∗ (3.15)
Competition -0.007 (-0.27) -0.008 (-0.30) -0.129 (-1.62)
Precent LAF -0.278 (-1.15) 0.139 (0.40) -1.266∗∗ (-2.37)
Avg Days Early 0.003 (0.28) -0.038∗∗∗ (-2.71) 0.035 (1.53)
Avg NAS Ratio 0.445 (0.64) 0.466 (0.64) -1.275 (-0.71)
Avg ROA 0.028∗∗ (2.36) -0.163∗∗∗ (-5.27) 0.100∗∗∗ (4.69)
Avg MtoB -0.066 (-0.65) -0.083 (-0.81) -0.058 (-0.20)
Avg Disc Accruals 1.887∗∗∗ (3.51) 1.149 (1.48) 1.550 (1.43)
Avg Cash Flow 0.659∗∗∗ (3.41) -0.269 (-0.48) 0.602∗ (1.73)
Avg Loss 0.328 (1.36) -0.079 (-0.26) 0.204 (0.37)
Avg Leverage -0.744∗∗∗ (-11.72) 0.927∗∗ (2.08) -2.033∗∗∗ (-18.84)
Avg Litigation 0.310 (1.36) 0.128 (0.48) 1.252∗∗ (2.18)
Avg Client Age -0.386∗∗∗ (-2.95) -0.248∗ (-1.71) -0.901∗∗∗ (-2.74)
Avg M&A 0.486∗∗∗ (2.68) 0.597∗∗∗ (3.07) 1.271∗∗∗ (2.81)
Big4 0.605∗∗∗ (3.31)
Constant -2.694∗∗∗ (-4.30) -2.728∗∗∗ (-3.77) -3.707∗∗ (-2.00)
Year Indicators Yes Yes Yes
Observations 3,048 1,974 1,074
t statistics in parentheses. ∗ p <0.10,∗∗ p < .05, ∗∗∗ p < .01.
Sample limited to yearends in December 31 and to Large Accelerated Filers and Accelerated Filers.
Table 7: Restatement at Office Level: Non-Accelerated Filers
(1) (2) (3)
All Big Four Non Big Four
WorkLev Office 0.038 (1.36) 0.091∗∗ (2.52) -0.003 (-0.06)
Competition 0.048 (1.59) -0.013 (-0.34) 0.150∗∗∗ (3.05)
Avg Days Early -0.015∗∗ (-2.34) -0.045∗∗∗ (-5.15) -0.003 (-0.28)
Avg NAS Ratio 0.379 (0.50) -0.007 (-0.01) 0.739 (0.76)
Avg ROA 0.031∗∗∗ (2.77) -1.856∗∗∗ (-46.64) 0.042∗∗∗ (3.30)
Avg MtoB 0.155∗ (1.80) 0.050 (0.39) 0.248∗∗ (2.02)
Avg Disc Accruals 0.429 (1.07) 4.641∗∗∗ (3.88) 0.434 (0.94)
Avg Cash Flow -0.089∗∗ (-2.28) 2.200∗∗∗ (2.63) -0.118∗∗∗ (-2.69)
Avg Loss -0.035 (-0.14) -0.382 (-0.73) -0.020 (-0.06)
Avg Leverage 0.034 (0.40) -0.634 (-1.23) 0.034 (0.36)
Avg Litigation 0.023 (0.11) -0.711 (-1.51) 0.024 (0.09)
Avg Client Age 0.005 (0.04) -0.154 (-0.61) -0.011 (-0.06)
Avg M&A 0.752∗∗∗ (3.46) 0.582∗∗ (2.16) 0.968∗∗∗ (2.65)
Big4 0.062 (0.28)
Avg ICW 0.346 (1.18) 2.985∗∗∗ (2.93) 0.166 (0.49)
Constant -4.061∗∗∗ (-6.43) -2.887∗∗ (-2.56) -4.269∗∗∗ (-4.48)
Year Indicators Yes Yes Yes
Observations 2,836 1,310 1,526
t statistics in parentheses. ∗ p <0.10,∗∗ p < .05,∗∗∗ p < .01.
Sample limited to yearends in December 31 and to Non-Accelerated Filers.
Table 8: Restatement at Office Level: Asset per Auditor Terciles
(1) (2) (3)
All Big Four Non Big Four
WorkLev Office Terc 1 -0.123 (-0.82) -0.025 (-0.18) -0.200 (-0.61)
WorkLev Office Terc 3 0.210 (1.42) 0.184 (1.39) 0.743∗∗ (2.07)
Competition 0.034 (1.29) -0.006 (-0.21) 0.021 (0.32)
Percent LAF -0.303 (-1.28) 0.413 (1.23) -1.427∗∗∗ (-3.18)
Avg Days Early -0.011 (-1.06) -0.042∗∗∗ (-3.10) 0.006 (0.31)
Avg NAS Ratio 0.068 (0.10) 0.572 (0.79) -1.096 (-0.67)
Avg ROA 0.033∗∗∗ (2.73) -0.120∗∗∗ (-4.04) 0.052∗∗∗ (2.80)
Avg MtoB -0.038 (-0.40) -0.134 (-1.42) 0.309 (1.32)
Avg Disc Accruals 1.342∗∗ (2.50) 0.737 (0.98) 0.835 (0.88)
Avg Cash Flow 0.433∗∗ (2.23) -0.720 (-1.32) 0.317 (1.05)
Avg Loss 0.214 (0.90) -0.303 (-1.04) 0.196 (0.41)
Avg Leverage -0.503∗∗∗ (-5.36) 1.091∗∗ (2.54) -1.776∗∗∗ (-12.66)
Avg Litigation 0.241 (1.07) 0.175 (0.68) 0.939∗ (1.92)
Avg Client Age -0.289∗∗ (-2.22) -0.135 (-0.97) -0.817∗∗∗ (-2.75)
Avg M&A 0.596∗∗∗ (3.35) 0.605∗∗∗ (3.25) 1.275∗∗∗ (3.26)
Big4 0.708∗∗∗ (3.97) 0.000 (.) 0.000 (.)
Avg ICW 1.596∗∗∗ (3.70) 1.869∗∗∗ (3.08) 2.010∗∗∗ (2.65)
Constant -2.333∗∗∗ (-4.72) -2.477∗∗∗ (-4.22) -1.584 (-1.43)
Year Indicators Yes Yes Yes
Observations 2,979 1,970 1,009
t statistics in parentheses. ∗ p <0.10,∗∗ p < .05,∗∗∗ p < .01.
Sample limited to yearends in December 31 and to Large Accelerated Filers and Accelerated Filers.