1.9 Analysis and Conclusions from USEPA’s Neonicotinoid Preliminary Bee Risk Assessments
Keith Sappington, Ryan Mroz, Kris Garber, Amy Blankinship, Michael Wagman, Frank Farruggia, Chris Koper, Justin Housenger
U.S. Environmental Protection Agency (MC 7507P), 1200 Pennsylvania Ave, NW, Washington DC. [email protected]
DOI 10.5073/jka.2018.462.010
Abstract
In 2016-2017, USEPA issued Bee Risk Assessments for imidacloprid, clothianidin, thiamethoxam and dinotefuran. The conclusions from these four assessments are summarized and compared with respect to risks at the individual and colony levels. Although the focus in these documents is for honey bees, consideration of potential risk to non-Apis bee species is also evaluated. Dietary exposures are based on pollen and nectar residue concentrations from magnitude of residue studies. Exposures of thiamethoxam and imidacloprid used a total toxic residues approach to account for their relatively toxic metabolites while clothianidin and dinotefuran considered parent-only. For risks to individual bees, nearly all use patterns posed potential on-field risk for one or more honey bee castes, except for some seed treatments (e.g., canola, cotton, sunflowers). On-field risk was assumed to be low for crops harvested prior to bloom. Regarding off-field risks, foliar applications for all uses resulted in risks at distances >1000 feet from the edge of the field.
At the colony level, the Tier II risk assessment utilized semi-field Colony Feeding Studies (CFS) to establish endpoints based on honey bee colonies consumption of exposed sucrose solution over an extended period of time. Exposures following foliar applications (e.g., cotton, citrus, cucurbits) were more likely to indicate colony-level risk than exposures from soil applications while seed treatments generally did not result in expectations of colony-level risks, though uncertainties were noted for several crop groups where refinements could not be made. Other lines of evidence, including ecological incidents, eco-epidemiological evaluations, full field studies, and monitoring studies are also considered in evaluating overall risk.
1.10 Quantifying Sources of Variability in Neonicotinoid Residue Data for Assessing Risks to Pollinators
Keith Sappington, Ryan Mroz, Kris Garber, Frank Farruggia, Michael Wagman, Amy Blankinship, Chris Koper
U.S. Environmental Protection Agency, Office of Pesticide Programs, Environmental Fate and Effects Division, Washington, DC, USA
DOI 10.5073/jka.2018.462.011
Abstract
The U.S. Environmental Protection Agency’s 2014 guidance for assessing pesticide risks to bees relies on higher-tier studies of residues in pollen and nectar to refine pesticide exposure estimates obtained from lower tier information (e.g., default values and model-generated estimates). These higher tier residue studies tend to be resource intensive due to the need to address spatial and temporal factors which influence pesticide residues in pollen and nectar. Time and resource considerations restrict the number of samples, crops, and locations which can be studied. Given these resource constraints, questions remain on how to best optimize the design and number of residue studies for obtaining a robust dataset to refine exposure estimates of bees to pesticides. Factors to be optimized include the number of replicates in each sampling event, the number of sampling events over time, the number of sites/regions per study, and the number of crops to be assessed within and across crop groups. Using available field residue data for the neonicotinoid class of insecticides, we conducted an analysis of variability in residue data to address these and other study design elements. Comparisons of the magnitude of residues and variability are made across neonicotinoid chemicals (imidacloprid, clothianidin, thiamethoxam and dinotefuran) as well as the variability associated with intra- and inter-crop group comparisons and regional and soil texture gradients. Additionally, this analysis includes consideration of bee-relevant toxic metabolites for imidacloprid and thiamethoxam. Results of these analyses of neonicotinoid residue data are presented in the context of optimizing field residue study designs for
1. Introduction
Within the last five years, regulatory authorities in Europe, North America, and elsewhere have developed and implemented new guidance for quantifying pesticide risks to bees (e.g., EFSA 2013; USEPA/PMRA/CDPR 2014; IBAMA 2017). These risk assessment schemes generally rely on a tiered approach, whereby pesticide effects testing that support lower tier assessments involve laboratory tests of individual bees while higher tier assessments involve field testing of entire colonies. Regarding exposure, lower tier assessments rely on “default” (high end) estimates of exposure which can be refined at a higher tier with field residue data as deemed necessary. For example, USEPA’s recently published risk assessments for the neonicotinoids rely heavily on experimental field data that quantify pesticide residues in bee-relevant matrices (e.g., pollen and nectar) following pesticide application to various crops (USEPA 2016a; 2017). To date, however, detailed nationally or internationally-accepted guidelines have not been developed for the design and conduct of bee-relevant residue studies. General guidance has been published on a limited set of study design elements (e.g., EFSA 2013; USEPA 2016a, IBAMA 2017), but many details are lacking. Furthermore, the scope and design of such studies vary widely within and across pesticides, which complicates study interpretation and application in risk assessment. To help ensure that bee field exposure studies meet the scientific needs of regulatory authorities and to improve their overall consistency, the Semi-field/Field Testing workgroup of the ICPPR Bee Protection Group is currently developing guidance to optimize the conduct of bee-relevant field residue studies.
In parallel with the ICPPR project for optimizing the design of bee-relevant residue studies, the USEPA has initiated several efforts that will likely inform the generation and use of bee-relevant residue data in risk assessment. These efforts include:
1. Conducting an exploratory analysis of the sources of variability in field residue data used for bee risk assessment;
2. Performing a comprehensive retrospective analysis to support extrapolation of bee-relevant residue data for neonicotinoids, and
3. Exploring alternate methods for incorporating bee-relevant residue data in risk assessment.
The first objective (exploratory analysis) of this project is complete, the results of which are described in this manuscript. The second two objectives (retrospective analysis, residue data risk assessment methods) are currently ongoing and therefore, only the goals and scope of these efforts are described herein.
2. Methods and Data
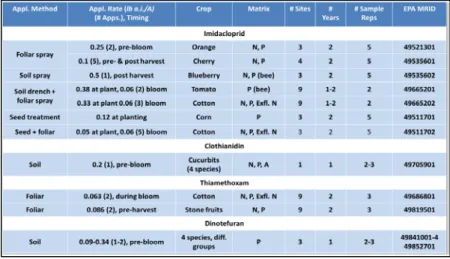
In total, the exploratory analysis of bee-relevant residue data considered data from 11 field residue studies conducted with the neonicotinoids: imidacloprid (7 studies), clothianidin (2), thiamethoxam (1), and dinotefuran (1); Table 1. These studies were chosen because they used similar protocols, had well documented procedures, and contained the types of design elements to evaluate different sources of variability in residues in pollen and nectar (e.g., multiple sample replicates, sites, years, and/or crops). For this analysis, five potential sources of variability in residue data were evaluated, including:
• Analytical method,
• Sample collection,
• Study site(s),
• Study years, and
Table 1 Summary of studies used to evaluate sources of variability in residues of neonicotinoids in bee-relevant plant matrices.
3. Results
3.1. Analytical Variability
All 11 studies considered in this analysis contained a data quality objective of achieving a coefficient of variation (CV) of 20% or less among analytical replicates. This analytical quality objective was met in each of the 11 studies. Furthermore, stringent objectives related to the accuracy (e.g., spike recoveries) and sensitivity (e.g., level of detection) of analytical methods were all met. Therefore, the precision and accuracy of the analytical methods used in these studies was considered a minor source of variation relative to others considered in this evaluation.
3.2 Sampling Variability
Residue studies with at least 5 replicate samples were chosen for analyzing variability among replicate composite samples. All 5 studies that met this criterion were conducted with imidacloprid and included 2 foliar spray studies (citrus, cherry), 1 soil spray study (blueberry), 1 seed treatment study (corn) and 1 seed + foliar spray study (cotton; Table 1). In each study, 5 replicates of composite samples of flowers and extrafloral nectaries were taken at each sampling event and subsequently processed for analysis. Within each study, matrix and sampling event, variability due to sampling was quantified based on:
• CV among sample replicates, and
• Range (max./min.) of sample replicates.
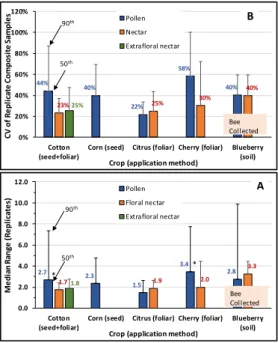
For each study, the median and 90th percentile values of the range and CV among sample replicates of imidacloprid measured in nectar (floral and extrafloral) and pollen are shown in Figures 1A and 1B, respectively. Among all 3 matrices and studies, the median range in imidacloprid residues varied from 1.5X to 3.4X. However, the 90th percentiles among replicate ranges of pollen residues (5X to 10X) are higher than those for floral and extrafloral nectar (3X-4X; Figure 1A). Similarly, the CV of pollen residues measured in replicate samples also tended to be higher than those of nectar, with 90th percentile CVs up to 100% (Figure 1B). The cause of the apparent greater variability in pollen residues among sample replicates is not known.
Figure 1 Variation in imidacloprid residues among replicate composite samples of pollen, floral nectar and extrafloral nectar for various crops
3.3 Site-to-Site Variability
Within each residue study included in the site-to-site variability analysis, the number of sites ranged from 3 to 9 and study durations ranged from 1 to 2 years for imidacloprid. Therefore, annual mean residue concentrations for each site/year within each study were first calculated. Annual means were selected because the number of residue measurements available within a trial was often small, such that it precluded use of a fixed percentile (e.g., 90th). Differences in study designs also introduced greater variability if the minimum or maximum value was selected for a given trial. Second, the mean across all trial sites within each study/year was determined. Finally, the “site mean deviation” was calculated as:
Site Mean Deviation (i,j)=Annual Mean (all sites)(j)Site Annual Mean (i,j)
where,
i = site and j = year of the study.
The above equation was used to “normalize” each site’s mean residue concentration for each year of a study to the mean residue concentration across all sites for that same year. Furthermore, the potential impact of differences among sample replicates and events was minimized by using the annual mean for each study site.
Results from the site-to-site variability analysis are shown in Figure 2. For floral nectar, results indicate that annual mean residue concentrations are generally within a factor of 2X from the overall study annual mean, except for results from the soil cotton study (red circles, Figure 2). For pollen, however, annual mean residues among study sites varied by more than 10X from the overall study annual mean residues (blue triangles, Figure 2). Annual mean residues of imidacloprid in extrafloral nectar among sites also exceeded a factor of 2X in two of the three studies for which data are available (green squares, Figure 2). Differences in soil type, agronomic practices (e.g., irrigation), application timing, and weather are considered likely sources of variation in residues across study sites within each of the studies. Results in Figure 2 clearly show
44% 40% 22% 58% 40% 23% 25% 30% 40% 25% 0% 20% 40% 60% 80% 100% 120% Cotton
(seed+foliar) Corn (seed) Citrus (foliar) Cherry (foliar) Blueberry(soil)
CV o f R ep lic at e C omp os ite Sa mp le s
Crop (application method)
Pollen Nectar Extrafloral nectar 90th Bee Collected 50th B 2.7 2.3 1.5 3.4 2.8 1.7 1.9 2.0 3.3 1.8 0.0 2.0 4.0 6.0 8.0 10.0 12.0 Cotton
(seed+foliar) Corn (seed) Citrus (foliar) Cherry (foliar) Blueberry(soil)
M ed ia n R an ge (R ep lic at es )
Crop (application method)
Pollen Floral nectar Extrafloral nectar * * 90th Bee Collected 50th A
the benefit of including multiple sites for capturing variation in imidacloprid residues in bee-relevant matrices.
Figure 2 Variation in annual mean residues of imidacloprid measured in various matrices among sites within each study. Red rectangle denotes site means within 2X of the overall mean from a study.
3.4 Year-to-Year Variability
Variation in neonicotinoid residues measured in bee-relevant matrices among successive study years was evaluated for 7 studies with imidacloprid and 2 studies with thiamethoxam, which had multiple years of measurement within the same study. For each year of each study, annual mean residues for each sample matrix were calculated within each site. Next, the inter-annual fold change (ratio of max. annual average/min annual average) was calculated for each site. In all cases, only 2 years of residue measurements were available within each study.
6.1 2.9 15.6 1.8 22.3 2.2 9.3 1.2 3.3 2.6 2.22.5 1.83.5 1.91.7 0 10 20 30 40 M ea n I nt er -A nn ua l F ol d C ha ng e
Application Method (Crop)
Pollen Floral nectar Exfl Nectar A 15.1 3.2 13.8 4.4 2.12.1 2.4 3.0 3.5 0 10 20 30 40
Foliar (cotton) Foliar (cherry) Foliar (peach) Foliar (plum)
M ea n I nt er -A nn ua l F ol d C ha ng e
Application Method (Crop)
Pollen Floral nectar Exfl Nectar
For floral and extra floral nectar, the median ratio of the maximum to minimum annual average residue concentration was between 2X to 3X for both pesticides. For pollen, however, much greater differences in annual average concentrations were observed across years within each study, with median ratios of annual averages approaching or exceeding 10X in 5 of the 12 trials evaluated.
3.5 Variation Among Crops
Comparing neonicotinoid residues measured in different crops originating from different studies would likely be highly confounded by large variability observed previously due to the study site and year of measurement. Therefore, the evaluation of crop-to-crop differences in residue concentrations was limited to studies which measured residues in multiple crops based on: (1) the same application rate and method, (2) the same site, and (3) the same season. Two studies, one with clothianidin and the other with dinotefuran, met these criteria and were specifically designed for evaluating the influence of crop on residue concentrations.
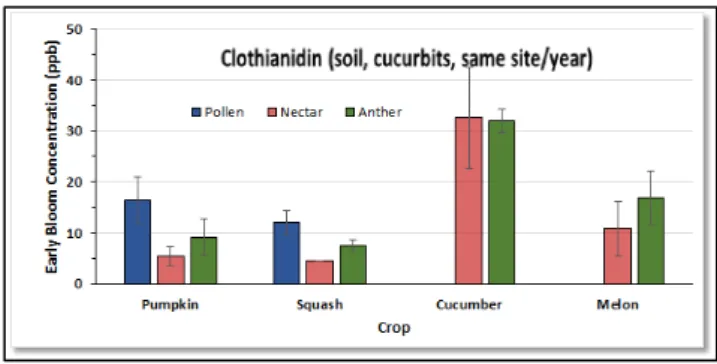
Clothianidin. The study with clothianidin consisted of soil chemigation applications of Belay® Insecticide at a rate of 0.2 lbs a.i./A at the time of planting of 4 cucurbit species: cucumber, melon (cantaloupe), pumpkin, and squash. The field trial, located in Fresno, California consisted of an untreated control plot and three treatment plots within the same field. Treated plots were comprised of four subplots (one per cucurbit species). Flowers were collected by hand on five occasions during the blooming period. Concentrations of clothianidin measured during the early bloom period of each cucurbit are shown in Figure 4. With nectar, mean residues of clothianidin measured during early bloom vary by about 7X among the four cucurbit crops, while those for anthers vary about 4X. Mean residues of clothianidin in pollen are within 2X; however, data for only 2 of the 4 crops were available.
Figure 4 Concentration of clothianidin in bee-relevant matrices of 4 cucurbit crops following soil application at the same study site (MRID 49910601)
Dinotefuran. The studies with dinotefuran involved two, pre-boom soil applications of dinotefuran 20 SG at nominal applications of 0.206 lbs a.i./A (first application) and 0.330 lbs a.i./A (second application) to tomato, cucumber and pumpkin at two or three study sites (Belvidere, NC; Poplar Bluff, MO; Sanger, CA; MRIDs 49841001, 49841003, 49841004). Each site contained three replicate treatment plots and a control plot. For tomato and cucumber, samples of bee-collected pollen via mesh tents were taken 18 - 63 days after the last soil application. For pumpkin, hand collected pollen was taken 8 - 22 days after the last application. Applications to pumpkin also occurred in late summer (August) whereas those for tomato and cucumber occurred in late spring/early summer (May and June).
Mean concentrations of dinotefuran measured in pollen during the entire sampling period are shown in Figure 5. Mean residues of dinotefuran measure in pollen are lowest in cucumber (~ 1
ppb) followed by pumpkin (24 – 57 ppb) and then tomato (22 to 2,960 ppb). Mean residues for the two cucurbits (cucumber and pumpkin) varied by 30 – 60X within each of 2 sites. In addition to differences in the crop, the higher mean concentrations in pollen of pumpkin vs. cucumber could also reflect the shorter interval between application and sample collection and/or differences in pollen sampling method. However, by far the greatest overall concentrations of dinotefuran are seen for tomato (up to 1000X greater than cucumber), which had the longest interval between application compared to the other two crops. This suggests that species of crop can have a profound effect on residue concentrations in bee-relevant matrices.
Figure 5 Mean concentrations of dinotefuran in three crops following soil applications at three sites( MRIDs 49841001, 49841003, 49841004)
3.6 Exploratory Analysis Conclusions
The previously described exploratory analysis of variability in neonicotinoid residues in bee-relevant matrices suggest that factors related to sample replicate, study site, study year and crop can each contribute to 1-2 orders of magnitude in the observed variability in residues among various matrices. Identifying the specific cause of this variability was beyond the scope of this analysis. Analytical precision and accuracy was not a major source of variability in this data set. Thus, results from this exploratory analysis indicate that careful design of field residue studies is required to ensure that the risk assessment adequately represents a reasonable range of conditions that determine the levels of pesticide residues in bee-relevant matrices..
4. Next Steps and Path Forward
Based in part on the results from the exploratory analysis and the need to address extrapolation of bee-relevant residue data for the neonicotinoids among the existing uses on bee-attractive crops, the Office of Pesticide Programs (OPP) within EPA has embarked on a comprehensive retrospective analysis of residue data for the neonicotinoid insecticides (i.e., goal #2 in Section 1). The primary goal of this analysis is to develop method(s) to reduce uncertainties in the application of neonic residue database for assessing risk to bees. The sources of uncertainty being addressed relate to:
A. Extrapolation of Residue data (e.g., across a chemicals, crops, or application methods), B. Data limitations (e.g., reduced temporal and/or spatial representation of residue data
relative to the distribution of a given crop), and
C. Sampling matrix (e.g., data are only available for a matrix other than pollen and nectar, such as flowers or leaves)
0 1 10 100 1000 10000
Belvidere, NC Poplar Bluff, MO Sanger, CA
Study Site
Cucumber Tomato Pumpkin
Co nc en tra tio n i n p ol le n ( pp b)
Key questions being investigated include (but are not limited to):
• How reliable are extrapolations of residue concentrations from one neonic to another? From one matrix to another? From one crop to another?
• Are there consistent patterns in the expression of residues in bee-relevant matrices across the neonicotinoids within a crop? Are patterns consistent across methods of application? Across plant matrices?
• How does the persistence of residues vary among neonicotinoids, crops, application methods and plant matrices?
A secondary objective of this analysis is to improve the application of bee-relevant residue data in risk assessment (goal #3 in Section 1). Current methods for incorporating bee-relevant residue data into the preliminary risk assessments for bees have relied on an empirical approach, whereby measured concentrations in pollen and nectar are directly used to evaluate risk at the Tier 1 and Tier 2 levels. Among other issues, this empirical approach does not readily account for limitations in the underlying data (e.g., measurements at a single time point vs. multiple time points after application) and places a heavy reliance on maximum observed values.
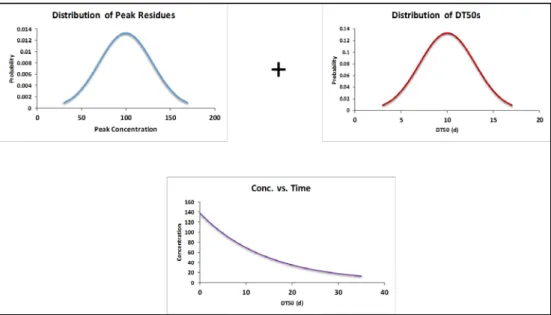
Therefore, a statistically-based approach is being explored for addressing these and other limitations in the use of residue data in bee risk assessment. The approach being explored relies on estimating the mean and variance in “peak” concentrations in pollen/nectar in addition to the variation in dissipation rates observed in these matrices (Figure 6). Then, based on random sampling via Monte Carlo analyses, a series of residue dissipation curves are generated that theoretically represent potential variability in residue-decline profiles among multiple treated fields. The statistical attributes of these residue decline curves could then be considered for risk assessment purposes (e.g., a 90th percentile among 1000 randomly simulated fields) as informed by risk management goals. In this way, the underlying variability in the observed residue data can be directly incorporated into the risk assessment. In addition, it may be possible to make appropriate adjustments in the predicted residue-decline curves to account limitations in the underlying data for a given crop/application method/chemical (e.g., only having data from one site instead of multiple sites). This approach is analogous to the approach used by the European Food Safety Authority in their bee risk assessment process and conceptually consistent with the method used by OPP for assessing risk to birds and mammals from residues on plant foliage.
References
EFSA. 2013. EFSA Guidance Document on the risk assessment of plant protection products on bees (Apis mellifera, Bombus spp. and solitary bees). EFSA Journal 2013; 11(7): 3295, 266 pp., doi:10.2903/j.efsa.2013.3295
IBAMA 2017. Manual Of Environmental Risk Assessment Of Pesticides To Bees. Ministry of the Environment, Brazilian Institute of Environment and Renewable Natural Resources, Directorate of Environmental Quality, Brazilia.
USEPA/PMRA/CDPR. 2014. Guidance for Assessing Pesticide Risks to Bees. Office of Pesticide Programs, United States Environmental Protection Agency, Washington, D.C.; Health Canada Pest Management Regulatory Agency Ottawa, ON, Canada California Department of Pesticide Regulation, Sacramento, CA.
June 19. (available at: http://www2.epa.gov/pollinator-protection/pollinator-risk-assessment-guidance).
USEPA 2016a. Guidance on Exposure and Effects Testing for Assessing Risks to Bees. U.S. Environmental Protection Agency, Office of Pesticide Programs, Washington, DC. (available at: https://www.epa.gov/sites/production/files/2016-07/documents/guidance-exposure-effects-testing-assessing-risks-bees.pdf )
Residue Study Data Associated with MRID Numbers:
Imidacloprid: USEPA 2016b. Preliminary Pollinator Assessment to Support the Registration Review of Imidacloprid. U.S. Environmental Protection Agency, Office of Pesticide Programs, Washington, DC
Clothianidin & Thiamethoxam: USEPA 2017a. Preliminary Bee Risk Assessment to Support the Registration Review of Clothianidin and Thiamethoxam. U.S. Environmental Protection Agency, Office of Pesticide Programs, Washington, DC. (available at: https://www.regulations.gov/document?D=EPA-HQ-OPP-2011-0865-0173)
Dinotefuran: USEPA 2017b. Draft Assessment of the Potential Effects of Dinotefuran on Bees. U.S. Environmental Protection Agency, Office of Pesticide Programs, Washington, DC (Available at: https://www.regulations.gov/docket?D=EPA-HQ-OPP-2011-0920)