_AJPS
136 1
POLICY RESEARCH WORKING PAPER
1361
Externlal
Shocks
Ukaine has been sufferingfrom severe external shocks
and Performance Responses
that complicate its trnsitionn n * * ~~~~~~~~~~~~toamarketeconormyand
during
Systemic
Transition
t
require ajudicious choice ofaktcnm
n
policy measures.
The
Case of Ukraine
F. Desmond McCarthy Chandrashek.ar Pant Kangbin Zheng
Giovanni Zanalda
The WolddBank
Euirope and Central Asia, Country Departme-nt IV Country Operations Division 2
and
Office of the Vice President Development Economics September 1994
Public Disclosure Authorized
Public Disclosure Authorized
Public Disclosure Authorized
Summary findings
Ukraine encountered many economic problems in its first Based on examination of the experience of other yrars of indepeidence. Most serious among external countries in addressing adverse shocks, the authors shocks were the collapse of trade with the former Soviet recommend the following policies:
Union and sharp price increases for energy imports. * Full commitment to systemic reform and External shocks resulted in an income loss in the current macroeconomic stabilizarion.
accounts equivalent to about 14 percent of GDP a year in * Privatization, price liberalization, devclopment of a 1992 and 1993. competitive market system, and reform of the legal
Ukraine did not adopt an appropriate strategy for system.
dealing with the impact of these shocks. Its main policy For the particular situation of Ukraine, they emphasize response has been to conrinue borrowing, increase the importancc of:
arrears, postponc adjustments, and restore administrative * Growth-oriented structural adjustment that reflects interventions. Not only has this policy exacerbated the Ukraine's comparative advantages, including the
economic crisis, ir has led to massive capital flight and development of nontraditional industries with high rapid expansion of the underground economy. value-added and low energy intensity.
With the limited information available, McCarthy, * Greater economic (especially energy) efficiency. Pant, Zheng, and Zanalda try to identify the major * Integration into world systems of trade and finance. sources of external shocks and to estimare their impact - Prudent borrowing and debt management strategies, on the ci :rrent account They also evaluate Ukraine's as well as policies to encourage private forcign direct
policy responses. investment and to make more efficient use of foreign debt.
This paper is a joint product of Country Operations Division 2, Europe and Central Asia, Country Department IV and the Office of the Vice President, Development Economics. The study was funded by the Bank's Research Support Budget under the research project "Economic Shocks and the Global Environment" (RPO 677-75). Copies of this paper are available free from the World Bank, 1818 H Street NW, Washington, DC 20433. Please contact Mila Divino, room S9-049, extension 33739 (34 pages). September 1994.
| Thc Policy Rc-scarch Working Paper Scerdib thcy fms e of mark progress to encoan r te E c zhang of ideas about
developtenf isesu. An objectiu of tbeseries is toget thefindings ocgia qdy, evzze if the presetafons are les than fuly pdlisl3cd The papffs cany th mniame of the agthorsandshould bcsed udasited accordirzgy. Tbc findi;gs, interpreations, and conckneions arc the aurhors' oum and shoukf not be aff6ibted to the llorld Bank its Exzvcs Board of Direatrs or any of itmebrS cowntrri
DURING
SYSTEMIC TRANSMON
The Case of Ukraine
F
Desmond McCarthy
Chandra Pant
Kangbin Zheng
Giovanni Zanalda
The World Bank
Washington, D.C. 20433
(202)473-6974
The autfiors tiank Wafik Grais for proposing this topic to us and for his encouragement and comment, and are grateful to Sandra Bloemenlkamp, Haoquan Chu, Francoise Le Gall, Daniel Kaufmann, and Ricardo Martin for their 3uggestions. An earlier draft of this paper was presented at a semina in the Second Conference of the International Ukrainian Economic Association in Odessa, and at a seminar in the Institute of World Economy, Kiev, Ukraine in May 1994. The authors appreciate helpful comments received from the seminar participants, especially from V. Bardera, L Ivanchenko, I. Koropeckyj, G. Piatachenko, R. Shpek, and I. Shumilo. Editorial assistance was provided by Milagros A. Divino.
I.
Introduction
... 1El. Some Aspects of the Ukrainian Economy in Transition: 1991-93 .... ... 2
2.1 Recent Macroeconomic Development: A Brief Review ... 2
2.2 Trade Pattems ... 3
2.3 Institutional Framework and Basic Policies for Intemational Trade .... . 6
m.
Sources of External Shocks ... 73.1 EnergyPriceShocks ... 7
3.2 Non-Energy Terms of Trade Shocks ... 8
3.3 Market Disintegration Shocks. 9 3.4 Excess Demand for External Financing .10 IV. Inpacts of and Responses to Extemal Shocks ... 11
4.1 Impacts of External Shocks ... 11
4.2 Responses to Exteral Shocks ... 12
4.3 Filing the Gap: Additional Borrowmg and Forced Foreign Savings .... 13
4.4 Coping with External Shocks: Numerical Results ... 14
V. Leaming from International Experiens ... ... 16
5.1 Country Experiences ... 16
5.2 Broad Lssons for Ukraine ... 20
VI. Concluding Rmarks ... 22
References Annex
In the Text
Table I Recent Macroeconomic Development ... 3
Table 2 Inte.r-republic Trade Matrix: 1993 ... 4
Table 3 Major Trade Partners in FSU ... 4
Table 4 Stucture of Extemal Trade ...
5
Table 5 Composition of Inter-republic Trade ... 5
Table 6 Energy Imports from FSU ... 8
Table 7 Terns-of-Trade with FSU ... 9
Table 8 Trend of Inter-republic Trade: 1990-93 ... 9
Table 9 Ukaine: Impacts of External Shocks ... 14
Table 10 UJkraine: Performance Response to External Shocks ... 15
Table 11 Greece: Impacts of and Responses to Extemal Shocks ... 17
Table 12 Hungary: Impacts of and Responses to Extemal Shocks ... 17
Table 13 Korea: Inpacts of and Responses to External Shocks .... ... 18
Table 14 Philippines: Impacts of and Responses to External Shocks .... ... 19
Table 15 Portugal: Impacts of and Responses to External Shocks .... ... 20 In the Annex
Table 1. Impact of Energy Shocks
Table 2. Impact of Non-Energy Terms-of-Trade Shocks
Table 3. Volume Impacts of Exports and Imports
Tables 4-8. Cross-Country Comparison: Impacts of and Responses to External Shocks
-
The Case of Ukraine
I. Introduction
Ukraine has suffered substantially from to maintain the country's production and trade adverse external shocks ever since its patterns. These policies have not worked: real independence from the former Soviet Union GDP has fallen by about 40 percent during the (FSU) in 1991. What were the major sources of last three years and capital flight intensified. these shocks? How large was the impact of the
external shocks on the balance of payments in The purpose of this paper is, with general and on the current account balance in limited information, to: (a) identify major particular? How did the economy react to these sources of external shocks; (b) estimate the shocks? What was the policy response? While impact of identified shocks on the current this paper does not attempt to provide a account of BOP; (c) examine Ukraine's definitive answer to all of these questions, it performance responses to these shocks; (d) does offer some insights both qualitatively and review some successful and unsuccessful quantitatively. international experiences in coping with extenal
shocks; and finally (e) suggest some policy As a young republic deprived of recommendations to lessen the impacts of independent policy making for over seven external shocks over the short to medium terms. decades, the Ukrainian government started its The basic methodology3 is adopted from Balassa
systemic transformation with only limited and McCarthy (1984), which provides a simple experience in formulating strategies to confront but robust way of decomposing the observable significant domestic problems and external aggregate impact into effects caused by instability. The breakup of the FSU and CMEA individual recognizable exteral shocks. The disrupted the input-output linkages forged in the current accounts with the FSU and with the rest central planning regime. Collapse of the of the world (ROW) are treated separately to inter-republic trade and payments systems figure out regional sources of different shocks. further hindered exchanges of goods and Four broad classes of shocks are considered: (i) services among republics to sustain output and energy price shocks; (ii) non-energy terms-of-income. Moving to international prices for trade shocks; (iii) export demand shocks; and inter-republic trade subjected Ukraine to a (iv) the accumulated cost of extra-financing remarkable terms-of-trade loss'. Moreover, caused by shocks in previous periods. Five kinds repeated price hikes of imported energy not only of economic performance responses are created sizable trade deficits for Ukraine but also considered: (i) improvements in services contributed to an overall shrinking of economic accounts; (ii) economic contraction; (iii) export activities in the country. Macroeconomic promotion/diversification; (iv) import uncertainties and lack of progress in economic substitution/compressior.; and (iv) external
reforms limited Ukraine's access to external finanCing.4
financing. The policy response to these shocks
has been characterized by stop-and-go and The main conclusions of this paper increased administrative interventions designed include that adverse external shocks did affect
Rough estimates show that external shocks could external shocks. In Section IV, a simple account for up to about half of 40 percent loss conceptual and computational framework is of GDP over the past three years. The rest of given for the quantitative analysis of the impacts this loss may be attributed to other efficiency of the shocks and the responses of the economy. losses and lack of structural adjustments in many Broad estimates of the impacts of and responses sectors of the economy. As energy prices reach to external shocks for the past two years are also the world levels, it becomes critical that policy presented. Section V illustrates cross-country makers address these issues. experiences in dealing with external shocks.
Section VI concludes this paper by summarizing The rest of the paper is organized as the main findings indicating some areas that follows. Section II briefly discusses recent warrant policy consideration.
macroeconomic development in Ukraine and
H. Some Aspects of the Ukrainian Economy in Transition: 1991-93
In this section, recent macroeconomic first years of economic transition in Ukraine development in Ukraine and also its trade very painful. According to official statistics, structure are briefly reviewed. This helps total output declined by about 14 percent in 1992 explain why the economy is highly vulnerable to and 18 percent in 1993. Industrial output is external shocks and how these shocks have such estimated to have fallen by almost 40 percent in a pervasive effect on domestic economic the first half of 1994. Real GDP in 1993 was activity. less than 60 percent of its 1989 level5. Though the official unemployment rate remains negligibly small, probably as much as one-third 2.1 Recent Macroeconomic Devdopment of the labor force of 24 million is either on A Brief Review short-time working, indefinite unpaid leave or underemployed. Domestic investment During the Soviet era, Ukraine was practically haltedc Following partial heavily industrialized and at the same time the liberalization of prices in 1992 and accompanied "bread basket' of the whole Union. In 1990, by lax fiscal and monetary policies, the annual the year before independence, industry and average inflation rate increased from about 1400 agriculture contributed over 40 percent and 30 percent in 1992 to 5000 percent in 1993, with percent of the total net material product, monthly inflation close to 50 percent through the respectively. The economic structure was second half of the year. However, in the first shaped to serve the political purposes of the quarter of 1994, the monthly inflation rate came central planners, and was, to a large extent, down sharply, remaining at single digital level geared to meet military needs. With a since March. This was attributable in part to a dominating state ownership of production means, significant tightening of monetary policy during little concern was given to economic efficiency late 1993 and early 1994, and a sharp decline in in output production and resource allocation. real wage. The state budget deficit was largely compressed, from 16.5 percent of GDP in 1992 Heavy heritages of the collapsed socialist te less than 10 percent in 1993. Subsidies to system and weaklpolicies toward macroeconomic consumers and producers still took 40 percent of stabilization arnd structural adjustments made the total fiscal revenue. However, this
improvement in the deficit is probably not
sustainable, because it was achieved without Table I
structural reforms and mainly by cutting public Ukraine: Recent Macroeconomic Development investment and squeezing enterprises for income in..cic Develop taxes. The fiscal deficit has been largely 1991 1992 1993 financed by money creation which fueled
--inflation and eroded public confidence. The Real Growth Rate in%
value of the karbovanets plummeted from Krb GDP at Factor Cost -13.4 -14.0 -18.0 749 per US dollar at end-1992 to over Krb Exports -18.6 -16.0 50,000 per US dollar in the summer of 1994. Imports -25.6 -23.4 Private Consumption - 9.1 - 9.6 Enlarged bills on oil and gas imports
from Russia was a principal factor in generating As % of GDP
large external imbalances. The volume of Domestic nestint 13.6 12.0 3.0 imports declined by a significantly larger degree Total Consumption 83.2 90.1 92.6 than exports in recent years but terms of trade Resoure Balance - 1.7 - 2.1 - 0.6
deterioration kept Ukraine's current account
negative. Lack of foreign exchange including iscid Accounts
Russian rubles forced Ukrine to fill the external Revenue and Grants 26.0 29.0 34.4 gap by accumulating trade arrears. Living Expenditure 36.8 45.5 38.4 standards for most of the population have fallen Budget deficit -10.8 - 16.5 -4.0
steeply, by about 30 percent in 1993 on average
as compared with that in 1991. The real wage Current Account Balance - 1.7 - 2.1 -Os.
is es-imated to have fallen by more than 50
percent between December 1992 and December Inflation Rate (CPI) (%) 91.2 1445.3 4927.0 1993. Intensifying energy shortages in 1993 led ExchgeyRate (nibiUySE 1.7 221.2 7629.0 to widespread rationing and a harsh winter for Energy Intensity Index 90.6 95.5 100.0 the population. Meanwhile, the Ukrainian Sources: Uk.ainian authorities and staff calculations economy becomes more energy intensive,
because the contraction of energy consumption has been notably smaller than the overall output decline. Clearly, the external shocks rooted in the disintegration of the FSU and the
inappropriate performance responses to these 2.2 Trade Pattern shocks played a significant role in the current
crisis. Despite its large size, the Ukrainian
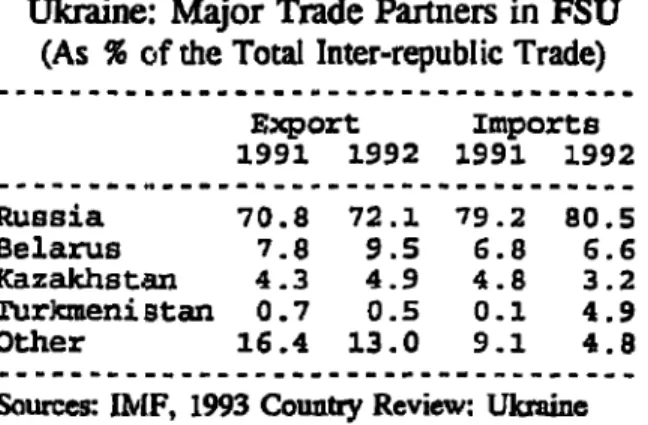
economy was very open, especially to the FSU Selected statistics for the recent macro- region. The degree of openness, defined as the economic development in Ukraine are given in sum of the import-GDP ratio and the export-Table I. These portray an economy in serious GDP ratic, was 82.5 percent in 1991 (of which distress. At this juncture there have been few 68.7 percent to the FSU), then shrank to 20.3 in major institutional reforms. Some municipalities 1992 and 33.0 and 1993, because the size of have initiated privatization of small enterprises trade decreased substantially. Regional and retail outets, but these are local initiatives specialization and extensive integration into the and not a significant part of the overall picture. Moscow dominated planning system made Ukraine highly dependent on FSU markets not only for its imported energy, raw materials and consumer goods, but also as a market for its
intermediate industrial output and agricultural percent of Ukraine's 1992 exports to and products. Inter-republic trade traditionally imports from the FSU. The share of imports accounted for more than four-fifths of Ukraine's from Turkmenistan jumped from an insignificant total trade. In the last three years, lack of 0.1 percent in 1991 to 4.9 percent in 1992, adjustments to mitigate the impact of substantial almost completely due to price rises of natural terms of trade deterioration, mainly energy price gas.
hikes, led to further deterioration of the trade
deficit with the FSU--from US$0.7 billion in - III
1991 to US$1.1 billion in 1992, and then Table III
(estimated) to a level over US$3.0 billion in Ukraine: Major Trade Partners in FSU 1993. The overall trade deficit is a little less (As % of the Total Inter-republic Trade)
because Ukraine ran a modest surplus with the ...
rest of the world. Export Imports
1991 1992 1991 1992
Table I Russia 70.8 72.1 79.2 80.5
Belarus 7.8 9.5 6.8 6.6 Inter-Republic Trade Matrix: 1993 Kazakhstan 4.3 4.9 4.8 3.2
TurkmeniStan 0.7 0.5 0.1 4.9 As%o Imports Other from 16.4 13.0 9.1 4.8
As S% of Imtports from --- --- ---Trade Value Russia Vkrine Other Total Sources: IMF, 1993 Country Review: Ukraine
Exports to
Russia 10.7 22.7 33.4 UJkraine 2 0 3 6.5 26.8
Other 26.4 4 .3. 9I.3 39.8 The relative importance of trade partners Total 46.7 14.8 38.5 100.0 also changed substantially in 1992.
Inter-republic trade accounted for four-fifrhs of all Source: Staff calculations. trade in 1991, but less than half in 1992, mainly reflecting
the
valuation effect of the sharp real depreciation of the ruble against convertible currencies. Historically socialist countries Historically, Ukraine was an engine for continue as Ukraine's most important trade socialist industrialization in the Soviet Union. partners. Three countries absorbed in 1992 Exports of food, coal, metal, and machinery nearly half of Ukraine's exports: China (23 from Ukraine contributed remarkably to the percent), former Czechoslovakia (13 percent), regional development. This important role of and Bulgaria (1 percent). For imports in 1992, material exchange continues to be played even the main sources were Germany (15 percent), nowadays. With a population of 16 percent of Italy (12 percent), Republic of Korea (10 the FSU, Ukraine in 1993 (as shown in Table II) percent) and former Czechoslovakia (10 absorbed 27 percent of total imports and percent). In 1993 trade outside the FSU was contributed 15 percent of total exports in the more diversified. The largest trade surplus in inter-republic trade, in the face of sharp terms of 1993 cane from China, whose share in trade shocks. About half of Russian exports to Ukraine's total exports reduced sharply from 23 the FSU went to the Ukraine, which accounted percent in 1992 to 9 percent in 1993. Notably, for about three quarters of Ukraine's imports trade with United States, Switzerland, and from the FSU while two-thirds of Ukraine's Austria expanded significantly.inter-republic exports wentto Russia. Ukraine's second largest trade partner in the FSU is Belarus, accounting for 9.5 percent and 6.6
Table IV share of capital goods declined. Noticeable is
Tabl TVthe jump in value terms of the share of energy Ukraine: Structure of Extemal Trade from less than one-seventh of imports in 1991 to --- - --- ---- --- almost a half in 1992. The share of crude oil
1991 1992 1993 rose from 4.5 percent in 1991 to 24.7 percent in
--- -- --- - --- 1992, even though the volume of oil imports fell
In US$ Billion by more 20 percent. On the export side, the
Balance -3.4 -0.6 -1.7 share of ferrous metallurgy in total earnings FSU -0.7 -1.1 -3.3 from the FSU more than doubled from 14
ROW -2.7 0.S 1.6 percent in 1991 to 30 percent in 1992, while the
Exports 50.0 11.3 14.9 share of machine building fell in 1992 to 24
FSU 42.7 5.3 8.6 percent in 1992 from 42 percent in 1991.
ROW 7.3 6.0 6.3
Imports 53.4 11.9 16.6
FSU 43.4 6.4 11.9 TableV
ROW 10.0 5.5 4.7 Ukraine: Composition of Inter-republic Trade
As % of GDP (As % of Total Trade Values)
Exports 39.9 9.9
15.69.9-FSU 34.1 4.7 9.0 Export Imports
ROW 5.8 5.3 6.6 1991 1992 1991 1992
Imports 42.6 10.4 17.4 Consumer Goods 23.4 13.1 19.1 8.7
PSU 34.6 5.6 12.5 Food 11.2 7.1 2.6 1.6
ROW 8.0 4.8 5.0 Non-Food 12.2 6.0 16.5 7.1
Real Growth Rates in e Energy
Exports -18.6 -16.0 Crude Oil 4.5 24.7
FS13 -18.3 -18.2 Oil Products 0.5 0.6 3.2 6.3
ROW -20.3 - 3.0 Gas 0.8 1.2 6.3 13.2
Imports -25.6 -23.4 Capital Goods &
FSU -20.7 -24.8 Intermediate Materials
ROW -47.2 -14.1 Metallurgy 16.4 33.4 10.7 8.9
--- chemicals 6.8 7.7 11.4 7.4
Sources: Ukranian authorities and staff calculations Machinery 41.8 24.2 31.4 11.8
Light Industry 2.9 0.6 5.6 0.5
Sources: IMP, 1993 Cauntiy Review: Ukmine
The broad trade pattern in 1991 and
-1992 is summarized in Table IV. Vis-a-vis the
FSU, Ukraine's imports and exports in real terms declined in 1993 by 18 percent and 25
percent, respectively. Vis-a-vis the rest of the Over half of Ukraine's industrial assets world, there was a 20 percent volume decrease were designed to produce military equipment. in exports and 47 percent volume decrease in Much of the technology is inappropriate for imports in 1992. Exports to the rest of the current demand pattens. Incentive distortions world fell only slightly in 1993. Currendy, the exist pervasively due to price controls, state changes in relative prices and in the demand- order, foreign exchange surrender requirements, supply relations within the FSU have reshaped and restrictive trade and income policies. This, Ukraine's trade composition significantly. On together with an unstable foreign exchange the import side of inter-republic trade, the share regime, weakens Ukraine's position in the
economy moves towards market orientation, the General lack of confidence in the trade pattern is expected to change to better economy has lead to capital flight. Estimates reflect Ukraine's comparative advantages. In suggest that this was abouit US$1 to 2 billion in addition, Ukraine can expect to generate some 1993. The Russian ruble has been appreciating foreign exchange earnings from gas and oil against Karbovantsi steadily and rapidly since transits at a reasonable domestic resource cost7. mid 1993. The Karbovanets has fallen from par However, at least, over the medium term it with the Ruble in early 1992 to 18 to one by the would seem that traditional trading partners will end of 1993. Consequently, many Ukrainian
continue to play a major role. enterprises keep holding rubles in contravention
of the 100 percent ruble surrender requirements regulated by the government. The broad thrust 2.3 Institutional Framework and Basic of these policies results in a strong anti-export
Policies for International Trade bias.
Trade policies in Ukraine have been At the moment, there is not a very
generally geared to protect domestic markets and supportive milieu for trade. The large number mitigate the impacts of differentials between of relatively opaque government regulations are domestic prices and international prices. a major barrier to potential investors together
Intergovernmental bilateral arrangements and with what is perceived as a broadly inadequate inter-enterprise barter' continue to be the main legal system. In terms of what is needed, one means of exchange. All enterprises are required might consider the one-stop shop found in a to surrender 50 percent of their foreign exchange number of Asian countries as an objective. In earnings at the fixed exchange rate artificially set order to jump start the export effbrt, one might
by the government. Recent work by Kaufnann complement the broad policies by one or more (1994) has indicated how high surrender export processing zones. These zones have the requirements result in adverse effects on exports advantage of also allowing more careful
and overall government receipts. monitoring and containment of possible
m. Sources of External Shocks
Many external factors exerted a direct energy consumption by residential households impact on the economy of Ukraine. In this and industrial users. Lack of financial incentive section, four major shocks are identified and for energy conservation also encourages energy
analyzed. waste. Second, Ukraine heavily denends on
jmorted
Mng. Domestic energy production3.1 Energy Price Shocks (mainly coal and electricity) could satisfy less
than half of total domestic energy consumption Ukraine is currently facing severe (47 percent in 1992 and 48 percent in 1993). energy price shocks, whose impacts are About 81 percent of gas and 90 percent of oil pervasive and permanent. Prices for energy (including oil products) consumed in Ukraine in imported from the FSU region did not reflect 1993 were imported from the FSU region, either the production cost nor the markes mainly Russia. Kazakhstan and Turkmenistan.
conditions for supply and demand, and were Third, Ukraine's energy efficiency has continued only a fraction of the comparable world market ,tO driooate. Ukraine's total prinmary energy prices. For instance, prices of oil and gas from consumption decreased by about 9 percent and the FSU region in 1991 were estimated to be 12 percent in 1992 and 1993-in comparison about 34 percent and 46 percent of the with GDP fall of 14 percent and 18 percent corresponding world levels. After the respectively--indicating that energy intensity disintegration of the FSU in 1991, Russia sought worsened. Continued soft-budget constraints in to remove its implicit energy subsides to FSU state-owned enterprises contributed to energy republics, to raise energy prices to the world misuses and payment problems. Fourth, levels, and to reduce energy exports if payments domestic energy prices are seriously distorted. were not promptly made. These movements Prices of coal were far below the production enlarged Ukraine's energy bill to Russia, cost, while the average price of natural gas was depressed Ukraine's import capacities, and only about 35 percent of the corresponding resulted in a sizeable trade deficit with Russia import cost in 1993. On a calorific equivalent and compressed domestic economic activities. basis, fuel oil was about four time more
expensive than natural gas in the domestic Structural weakness makes the Ukrainian market in March 1994, while electricity was sold economy highly vulnerable to energy shocks in at a price 20 percent below financial costs. forms of price hikes and supply cut-offs. First, Though domestic prices of oil products reached the economy is very enemy intensive. An the world leels in early 1994, energy supply to international energy efficiency comparison (see households is still heavily subsidized, providing Zheng et al 1994), -in terms of kilograms of oil little incentives for energy conservation. In equivalent required to produce one US dollar of addition, soft budget constraints of state GDP-, shows that while Ukraine's energy enterprises and the fear of possible extensive intensity is similar to that in some historically bankruptcy make fee collection a serious socialist countries (such as Romania and problem for domestic energy suppliers and Bulgaria), it is double that of Hungary, triple energy misuse difficult to abate. Finally, er that of Argentina. four times as high as that in imports from FSU sources are becoming more Mexico and Turkey, and ten times as high as in expensive and uncertain. Bilateral agreements France, Spain and Austria. As can be seen from between governments are the principal channels their preliminary regression analysis, the system for Ukraine to obtain desired energy imports. factor associated with central planning is the Ukraine's tenns of energy trade deteriorated
major cause of energy inefficiency. One of the remarkably. Crude oil imports was compressed reasons is the heavily subsidized prices for by 43 percent from 35 million tons in 1992 to
20 million tons in 1993. Moreover, gas electricity production in 1990 and 1993 suppliers in Russia and Turkmnenistan have respectively, is associated with significant safety repeatedly threatened to suspend gas deliveries hazards. The plentiful coal deposits are unless Ukraine could manage to reduce its considered damaging to the environment, and arrears on payments for energy imports. most coal mines are costly to rehabilitate. Moreover, the productivity of Ukraine's coal The magnitude of the energy price industry is declining sharply, as demonstrated by shocks are substantial. As shown in Table VII, an output fall of 14.4 percent in 1993 together the import prices of oil and gas in 1993 in with a 9 percent increase in employment. One nominal terms were about 1,080 times and 565 could envisage alternate energy suppliers over times as high as those in 1991. In real terms, the medium term as Ukraine extends its regional these two multipliers stood at 6.9 and 3.6, connections but this is unlikely to be significant respectively. The import price of Russian gas for at least a few years.
rose from about 12 percent of the comparable
inernational level (the price of Russian gas in Tabl VI the Western European market adjusted by transit a I
cost) in 1992 to 60 percent in 1993, while the UTkraine: Energy Imports from FSU import price of Russian oil rose from 35 percent
in 1992 to 76 percent in 1993. A rough Unit 1991 1992 1993
estimate indicates that Ukraine's terms of energy -- ---trade deteriorated by about 76 percent in 1992 Volume
and by a further 9 percent in 1993. CrudeOil m. ton 51.1 34.1 19.6
Consequently, the value share of energy imports Gas bcm 89.5 89m. 6 79 .8
in the total imports from the FSU area was Rusia 77.1 54.3 49.2 raised from 14 percent in 1991 to 46 percent in Turkmenistan 12.5 25.5 25.6
1992, and then to 53 percent in 1993. As
percentage of GDP, energy imports from the Price Indexes
FSU increased from 3.6 percent in 1991 to 14.4 Crude Oil 100 9381 75241 percent in 1992 and then to 15.6 percent in Oil Products 100 11335 92642 1993. Price hikes on energy imports resulted in Gas
a very large energy trade deficit vis-a-vis the Russia 100 2070 47490
FSU, which was increased by US$3.4 billion in Tuenistan 100 20SS 36821 1993 in spite of 36 percent volume fall in oil Pces as % of World levels
imports and I1 percent volume fall in gas Crude Oil 33 5 35.4 75.7
imports. Gas 45.6 12.3 S6.1
The permanent nature of the energy Sources: UTkainian authorities shocks calls for significant structural adjustments
and energy efficiency improvement, since the potential of self-sufficiency in energy and alternative energy supply is seriously limited in
the near future. Lack of hard currency and port 3.2 Non-Energy Tenms of Trade Shocks facilities to handle bulk shipments prevents
Ukraine from importing energy from alternative The terms of trade (TO0T) is sources. At the same time alternative domestic conventionally defined as the ratio between the energy sources have their own problems. unit value of exports and the unit value of Nuclear power generation, which accounted for imports.' The impact on the balance of about 26 percent and 34 percent of total payments due to changes in terms-of-trade of
non-energy tradable are based on variations in 3.3 Market Disintegration Shocks prices and quantities of exports and imports each
year. The breakup of the FSU was followed
____________________________by sharp declines in trade among newly Table VU ~~~~~~independent republics. Deterioration of Table VII ~~~~~~~macroeconomic conditions in the former Soviet Ukraine: Terms of Trade with FSUJ Union reduced the availability of raw material -- supply as inputs while at the same time led to (1991 =100.0) 1992 1993 reduced marker demand for Ukrainian output. - --- ---- Initial estimates show that in volume,
inter-Non-Ener-gy TOT 94.8 87.4 republic trade shrank by two thirds within three Unit Value of Imports 1430 14840 yasfo 90t 93
Unit Value of Exports 1360 12970 yasfo 90t 93 Energy (Oil & Gas) TOT 24.4 22.2 Table VWI
Unit Value of Imports 5950 71620
Russian GDP Deflator 1450 15890 Trend of Inter-republic Trade: 1990-93 At Constant 1990) Rubles
Aggngate TOT VL 4 52.7Billions 1990 1991 1992 1993 Annual TOT Change in %
---Aggregate -37.6 -15.5 Exports 189.3 141.2 93.2 72.1
Non-Energy -5.2 -7.8 Index (1) 100.0 74.6 49.2 38.2.
Entergy -75.6 -9.2 imports 188.5 129.0 99.9 74.6
_______________________________Index (1) 100.0 68.4 53.0 39.6
Source: Staff calculations. Russia
Exports 74.7 58.8 42.6 31.9
Together with volume shrinking in the Index (1-) 100.0 78.7 57.0 42.7 Imports 67.3 42.9 40.1 27.1 inter-republic trade, prices of inputs to Index (M) 100.0 63 .7 59.6 40.3
production increased sharply.10 In addition to
energy, significant price increases were also Ukrainie
Exports 38.3 27.3 18.9 14.4 recorded on the import side for iron, steel, afld Index (1) 100.0 71.3 49.4 37.5 nonferrous metal products. However, prices of Share (1-) 20.2 19.3 20.3 20.0 Ukraine's major exports in the FSU market imports 39.0 33.0 23.7 12.6 declined remarkably. For instance,the prices of sharex (O1) 0.7 25.6 23.7 16.9 machinery and agricultural products, relative to Share VO 20.7 25.__23_7_16_9
the corresponding world prices, dropped by 22 Source: Figures for 1990-1997, see NMioaopoulos, percent and 73 perc6nt, respectively. As a page 27. Figure for 1993 arc staff estimftes. result, Ukraine's non-energy terms-of-trade with
the FSU deteriorated by 5.2 percent and 7.8
percent in 1992 and 1993, respectively. The marketing prospects for Ukrainian output faces many difficulties. During the Ukraine's terms-of-trade with the rest of Soviet era, Ukraine was heavily industrialized. the world can be expected to imnprove over time, Most of its industrial assets were oriented when exporters adopt international trade directly or indirectly for military production. practices and improve the quality of their This poses many difficulties in reorienting output products. and especially in the allocation of the labor force
The ratio of imports to the output in primarily trough two channels: arrear production ranged from 20 percent to 30 accumulation and technical credits. Some of percent. However, these imports permeate the them were subsequently capitalized into state whole economy so that about 80 percent of debts denominated in US dollars. A large part production in Ukraine requires some levels of of Ukraine's current account deficit in 1992 and inputs produced elsewhere in the FSU. As the first quarter of 1993, valued at Ruble 1.05 shown in Table VIII, both imports and exports trillion, was converted in May 1993 into a debt of Russia, the largest market for Ukraine, fell by of US$2.5 billion at market interest rate (LIBOR
about 60% during last three years. for six-month US dollar deposits plus one
percentage point). Amortization and interest Ukraine's agricultural products and payments are to be made quarterly over the six consumer goods can be expected to achieve year period 1994-99. Debt service may be significant export levels over the medium term. discharged in convertible currencies or rubles at Presently these efforts are hampered by a lack of the exchange rate prevailing on the date of physical and financial infrastructure. [f payment, or in equity in real property. macroeconomic stability and systemic Apparently, repaying these debts constitutes an transformation in the former socialist countries additional shock to th economy. There has also in East Europe and Central Asia can be achieved been some discussions about the possibility for at a reasonable pace, Ukraine will benefit from Russia to swap the trade arrears with equity the recovery and the increasing trade volume. rights, most noticeably on the Black Sea Fleet
and gas transit pipelines.
3.4 ExcessDemand forExtemral ancing
The sizele trade deficit with the FSU area, notably Russia, was financed
IV. Impacts of and Responses to External Shocks
This section briefly outlines a simple import prices from that in the previous period. computational approach of decomposing external Table I in the Annex presents numerical shocks, estimating their impacts on the current estimates of the energy price effects.
account, and assessing the economy's performance responses to the external shocks.
Conventionally, the impact of unfavorable 4.1.2 Non-Energy Terms of Trade Effect shocks are registered as positive values in our
study. The time index in the text is suppressed The net effect of terms-of-trade (except in some time-lag cases) for variations, TTE, is usually taken as the presentational purpose. difference between the impacts of price changes in imports, TME, and in exports, TXE. Namely,
4.1. Impacts of External Shocks = - (2)
Four types of external shocks are
considered critical in the Ukraine's BOP where the superscript, r, is the region index, imbalance: (1) Energy Price Effect, (2) Non- which can be the FSU and the rest of the world energy Terms of Trade Effect, (3) Export (ROW). The import price effect, TME, can be 'Volune Effect, and (4) Interest Impact of Extra- derived as
Financing. They are analyzed in turn. = QM;(PM; - PM1)
(3)
4.1.1 Energy Price Effect where QM and PM are the volume and the unit price of non-energy imports from region r. The Ukraine is a net energy importer, except same formula applies to the export price effect, for some electricity exchanges and coal exports. TXE. Simple substitutions lead to
It purchases gas and oil from Russia and gas from Turkmenistan. Since energy trade outside
the FSU does not account for a significant share TIE, =
nr,f'
1 + 7,wrin the total trade, it is treated toeether with
non-energy merchandises in calculatio.z. The effect = QM,U(PMrU-PMfin
of energy price changes, EPE, can be written as
EPE* = Q0,(PO, - PO, 1) QX, (pX, _PXi) (4)
+ QG(Pg, - PG,I) (1) + QM,`(PjM, oPMri)
+ QrG[(PGrfP - Pcr & - mow nor
where QO and PO are the import volume and
price of oil, QG and PG are import volume and Hence, the terms-of-rade effects across price of gas, respectively. The superscripts R regions can offset each other when prices move and T on gas imports index exporting sources, in different directions. The current trade namely Russia and Turkmanistan. A positive volumes are used as the weights, which are value of EPE represents an opportunity loss in updated over time. Price deviations are always energy import values caused by changes of relative to the immediately preceding year. One limitation of this calculation is that a strict
terms-of-trade deterioration may not necessarily mitigate the impact of the external shocks. lead to an adverse (positive) impact on the While this practice shift the impacts of current balance of payments, when the volume weight shocks into the future, it places further burden on export is significantly greater than the on the current account in the future through volume-weight on imports. Table 2 in the compounding interest liabilities. Denote the net Annex presents numerical estimates for the non- extra financing at time t-lI as NEFt., and the energy terms-of-trade effect in Ukraine. applicable interest rate as i , then the total additional interest payments due, AIP, shall be
4.1.3 Export Volume Effect AIP, = iNEF,_> (6)
Here we concentrate on the impact of Thus current shocks are channelled into fluctuations of demand for Ukrainian exports. the near future by forcing foreign savings. If The export volume effect, EVE. is calculated as such extraordinary borrowing is relied on for a the difference in value of exports if economies long period, say j years, the cumulative interest of trade partners grew normally, say at the impact will be
world average growth rate, gW, and the actual
value of exports, taking the change in the MPt = £,4N.pl
income elasticity of demand for Ukrainian j I
exports, 71, into consideration. Hence, +
sII
(1+,-1)
NEF>]EVE[, = PX,'Q2X,'11(xj4&g7 _ T8,r (5) I-I k-I
This interest impact can be substantial Therefore, if the importers' economies through accumulation over time if no grow at the same pace as the world economy performance improvement is conducted to offset and the demand elasticity does not change, there the unfavorable shocks.
should be no export volume effects for Ukraine. Meanwhile, the trade partners may diversify
their imports away from Ukraine, as most FSU 4.2. Responses to External Shocks republics currently tend to integrate their
economies into the world trading system. This Among many reacting measures, five trade diversification, which can be represented types of performance responses are analyzed by a shrinking vq, is assumed to take effect in the here: (1) Improvements in Service Accounts; medium to long run. In our calculation for the (2) Economic Compression; (3) Export most recent past and the nearest future, we take Expansion; (4)ImportSubstitution/Compression; a constant unit elasticity, directly channelling and (5) Additional Borrowing/Arrear effects of foreign growth into trade quantity Accumulation.
impacts for Ukraine. Numerical estimates of the export volume effects are presented in Table 3
of the Annex. 4.2.1 Improvements in Services Accounts
One potential sustainable source of 4.1.4 Cumulative Interest Inpact of Extra- foreign exchange for Ukraine is the gas transit Financng revenue. The additional gains in the services
account, ISA, can be written as Lack of adequate domestic adjustments
forces Ukraine to accumulate payment arrears and seek additional foreign borrowing to
account of BOP will be mitigated. We use the
ISA, - (TRF;-TRF,.i)QGT,. lfollowing formula to calculate EEE:
+ TRF,( QGT, -QGT,1) (8)
[A
,r~(OS O& )
EEE,' = PX,'QX,' QX- xg; (10)
+(OSA,-OSAt_,) QX'SI
where TRF and QGT are the unit transit fee and where xg' is the export growth rate in region r. the total quantity of gas transit, respectively. However, if Ukraine's exports grow slower than The last bracket on the right hand side contains those of its trade partners, EEE will then be changes in other services accounts, OSA. For negative, showing a relatively poor response to instance, as Ukraine is located between Europe external shocks.
and Russia, income from cross-country transports could be expected to increase
significantly as normal trade relations resume. 4.2.4 Import SubstitutionlCompression ln addition, Ukraine has good potential to earn
foreign exchange from tourism development. The economy can also respond to external shocks by reducing its imports through changing its import intensity of per unit of real 4.2.2 Economic Compression GDP, which is usually captured in the income
elasticity of imports, 0. If imports did not grow Domestic income declines induce falls in in ieality as in the assumed "normal" case, demand for foreign goods. The effect of where a constant import intensity is kept, then economic compression, EEC, can be calculated the economy induced import substitution or its
as imports were compressed by technical
difficulties, such as payments problems. This EEC,r = PM[ QMT2 1
en
- gt") (9) effect of import substitution (compression),EIS, can thus be calculated as where 0 is Ukraine's income elasticity of
imports, and g" is the GDP (income) growth rate = QM,' in Ukraine. With a given elasticitv, the import EIS[ = PM,'QM, - QM4
volume will be reduced if the economic compression takes place, as compared with what
is expected to be the "normal" case (here we take the world average GDP growth rate as a
reference). 4.3 Filling the Gap: Additional Borrowing
and Forced Foreign Savings
4.2.3 Export Expansion Ukraine's external gap, after taking all active and passive reactions to external shocks The effect of export expansion, EEE, into consideration, was filled mainly by measures the impact generated from Ukraine's extraordinary financing, namely additional export promotion efforts. Simnply speaking, if borrowing (including overdraws in the trade policies encourage exports and thus corresponding accounts) and arrear Ukraine's export grows in real terms faster than accumulation. This part of foreign financing export growth of its trade competitors, then works, ex post, as a balancing item to equalize Ukraine's shares in overseas markets will be the impacts of external shocks and the effects of enlarged and the trade deficit in the current r2sponses in the current account of Ukraine's
balance of payments. Hence, we can measure Tabl IX the effect of the net external financing, NEF, as a e
the following (a residual in our calculation): Tkraine: Impact of External Shocks
NEF, =EPE1 +7MgE EVE, + AIP? (12{ (in % of GDP)
1992 1993
-lSAt -EEC,- EEE,- EWSt
---Aggregate Impact 14.22 13.01
Energy Price Effect 13.39 13.75
4.4 Coping with External Shocks: Crude Oil 7.37 3.48
Numerical Results Oil Products 1.69 1.39
Gas 4.32 8.87
Russia 3.71 6.45
Using the methodology outlined above, Turkmenistan 0.62 2.42 one can obtain the numerical results on impacts
of external shocks as presented in Table IX. It NoneE Tems of -344 -3.44
is noted that most of the shocks came from the Trade Effects
FSU. The broad picture is that the energy price Import Price Effect 13.55 11.01 effect was strongly unfavorable, especially due Export Price Effect 16 As8 14.45 to oil price hikes in 1992 and gas price hikes in With ROW 0.00 -0.01 1993. The fall in export demand in the FSU Import Price Effect 0.00 0.00 also exerted a significant unfavorable but Export Price Effect 0.00 0.01 somewhat smaller impact. The non-energy
terms of trade had a favorable but moderate TotEeTerm-of-Trade 9. 10.3 impact, although the non-energy terms of trade Effect with FSU
themselves deteriorated considerably in 1992 and Export Volume Effect 4.27 2.63
1993. FSTJ 4.29 2.64
ROW -0.02 -0 0 1
Liability from° 0.00 0.08
Additional Financing
Source: Staff calculations
How did the economy respond to these
shocks? The numerical estimates on different responses are presented in Table X. Among a variety of measures the government adopted, the primary one was to resort to stronger controls. In both years of 1992 and 1993, economic compression reduced Ukraine's import capacity and the import volume fell significantly, which accounted for nearly one third of the total response impacts. However, in 1992, the main response was to induce import compression through economic retrenchment and import substitution. Export promotion may also played
a moderate role. However. in 1993. the Ukraine can be better positioned to cope principal response was increased reliance on with future external shocks if it conducts a set of external financing. Moreover, in 1993, export trade policies consistent with macroeconomic promotion was not used as a policy option. The stabilization, structural adjustments and revival anti-export bias in policies was reflected not only of Ukraine's comparative advantages. These in quantitative restriction on exports for a wide shall include, among many other measures, range of goods but also through the foreign break state controls of foreign trade by de-exchange regime which forced exporters to monopolization, de-regulation, and private surrendered 50 percent of their hard currency participation; and remove distortionary earnings at an official exchange rate. T'he incentives (such as foreign exchange surrender official rate was artificially set and was only requirements). Recently positive moves have one-third of the parallel market exchange rate in been taken to reform the export regime. With a 1993. Predictably, responses to these presidential decree of May 5, 1994, the scope of disincentives was to drive signif"-ant export administrative controls on exports has been activities underground and encourage capital significantly narrowed. Quotas presenty apply
flight. to slightly more than one hundred products that
account for about one-third of total export value.
Table X 'The "special regime" for strategic goods was
abolished and replaced by a system of quarterly Ukraine: Performance Responses to Shocks auctions of quotas. All export taxes have been (in '6 of Current GDP) eliminated. Moreover, Ukraine is the first CIS --- country to sign an "Agreement on Partnership
1992 1993 and Cooperation" with the European Union,
--- which focuses on support and protection for Aggregate Response 14.22 13.- 01. investments and the streamlining of policies for
Improvements in 0 .00 1.86 the mining and raw materials sectors, science Service Accounts and technology, agriculture, energy and the civilian nuclear industry. Under this agreement, Economic CoSresson 4 .40 4.578 members of the European Union and Ukraine
With FSU 3 .03 3 .51
With ROW 1.37 1.27 will grant each other most-favored nation status,
guarantee the unrestricted and duty-free transit hnport Substitution 6.55 1. 61 and trade of goods via their territories. and Intensity Merchandise trade will take place at market
FSU 3.26 1.89 prices. ROW 3.29 -0.28 Export Promotion 2.94 -2.76 FSU 1.59 -2 00 ROW 1.35 -0.75 Extraordinary 0.33 7.52 Financing
V. Learning from International Experiences
Ukraine has experienced some of the economic efficiency was not sufficiently most severe adverse shocks of any country not improved. Ukraine can certainly learn from at war. While policy analysis must inevitably these international experiences, and avoid reflect the particular socio-political and repeating mistakes of other countries.
economic realities in the country of subject, it is also of interest to examine similar, albeit not as
severe, situations in other countries. There is 5.1.1 Greece now a wide range of experiences in how various
countries have addressed external shocks. Given Greece is interesting in the sense that the that there is no unique approach in how best to politics tended to be fairly sharply divided. This deal with various types of shocks a review of led to severe difficulties for policy makers who selected country experiences can be very useful generally were unable to obtain critical support and relevant. for measures, especially if they involved short term sacrifices by some of the more important In this section we briefly review groups.
experiences of a number of countries".
Summary details are given in Tables XI through Shocks. Greece being an energy XV. In the Annex, for each of these selected importer suffered adverse effects from the two countries one table is produced, containing two oil shocks of 1970s equivalent to about 8 percent parts. The first part lists magnitudes of shocks of GDP in each instance.
experienced each year and the performance
response to them. The second part presents Performance Response. The general selected economic indicators which provide some response in the seventies was to rely unduly on indication of the policy measures adopted that external borrowing. Following the second oil resulted in the performance measures listed. shock the authorities sought to curtail monetary expansion but failed to contain fiscal expenditures. This was largely because of the 5.1 Country Experiences fragile political balance throughout this period.
Experiences of five countries that Towards the end of the decade fiscal suffered significantly from external shocks in the deficits continued to present a major difficulty. past years are analyzed here. Some of them, However under prodding from the EEC (which such as Korea and Portugal, are relatively more provided significant transfers) they began to successful because they adopted appropriate address the problem. The main pillars of the strategies to cope with the external shocks, and economic policy program now are fiscal took the challenges as opportunities to adjustment and structural reform. However, restructure domestic industries and to integrate while the monetary adjustment seems to have their previously isolated economies into the started at the beginning the '90s, delays in the world trade and finance systems. Others, like implementation of other structural reforms have many African countries, did not manage to react increased the overall burden of the adjustment effectively, and thus still live in the shadow of process. This is leading to a slowdown of the the external shocks. There are also some economy and the increase in unemployment is countries, including the Philippines and placing serious strains on the authorities, further Hungary, which started their adjustments in right reducing the margin for maneuvering.
directions, but their actions were either poorly designed or wealdy implemented, therefore their
Table N- achieve a truly competitive position. This is a rather complex issue that would require Greece: Impacts of extensive analysis. Thus the export performance
in the eighties was poor. The underlying causes and Responses to External Shocks are a combination of factors. These include (Annual Average over thie Period) failure to contain real exchange appreciation, and lack of adequate incentives for potential
72-75 76-80 81-85 86-91 entrepreneurs. Ironically the fiscal "reform" prior to the breakup of the FSU may have Macroeconomic Indicators (%) resulted in a negative effect as the overall tax
GDP Growth 4 .8 4 .3 1.3 1.7 burden is generally perceived as being too Inflation(CPI) 15.0 16.4 20.7 17.8 heavy.
Budget Deficit/GDP 3.1 4.4 12.6 16.6 External Debt/GDP n.a n.a n.a n.a
Monetary Expansion 6. 0 5.5 5.2 0.6 Table XI
(As % of GDP at Current Market Prices) Hugary: Impacts
of
Tmnacts of External Shocks and Responses to External Shocks
Terms of Trde Effect 2.3 1.9 0.0 0.4 (Annual Average over the Period)
Export Volume Effect 0.3 0.1 0.2 -0.3 Intcrest Rate Effect n.a n.a n.a nr. a
Addituonl Debt Services 0.1 0.7 1.-3 1.1725768 15 "
Total 2.7 2.7 1.6 1.2 7275 76-HO 81-85 86-91
Performnance PResDonse Macroeconomic Indicators C,
Export Promotion 1.0 0.0 0.0 0.1 GDP Growth 6.5 3.3 1.8 -1.5
import intensity -0.4 0.8 0.0 -2.0 Inflation (CPI) 3.0 6.4 6.7 19.3
Economic Compression 0.5 0.4 0.7 0.0 Budget Deficit/GDP n..a n.a 1.0 1.5
ExtraordinaryBorrowing 1. 6 1.6 0.9 3.1 Extemal Debt/GDP n. a 46.6 52.0 70.0
Total 2.7 2.7 1.6 1.2 Monetary Expansion n.-a n.ea n.a n.ea
Sources: Staff calculation. (As X of GDP at Curent Market Prices) Impact! of External Shocks
Tern of Trde Effect 2.2 0.5 0 7 0 6
Export Volume Effect 1.4 0 2 0.6 -0 .9 Interest Rate Effect n.a n.ea -0.2 -0.1 5.1.2 Hungary Additionu Debt Services -0.4 0.5 0 3 0.0
Total 3.2 1.3 1.4 - 0.4
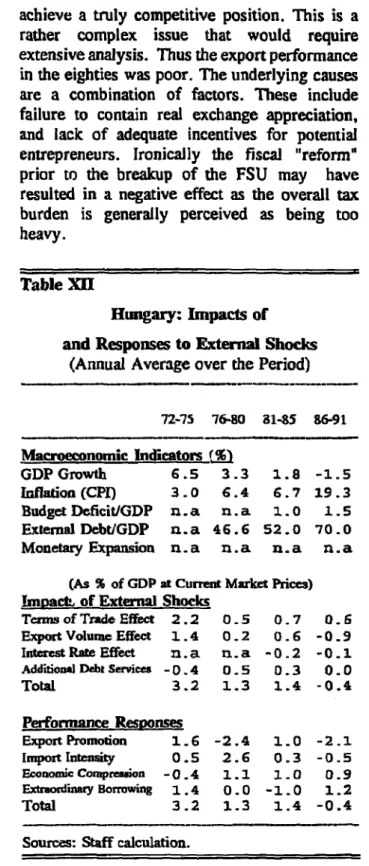
Shocks. Hungary suffered from serious
-terms-of-trade deterioration due to the two oil Performance1 Resoonses
shocks. ~~~~~~~~~Export Promotion 1 .6 - 2. 4 1.0O - 2. 1
shocks. In,IportIntensity 0.5 2.6 0.3 -0.5
Econonic Compresion -0. 4 1.1 1. 0 0.9
Policy Response. Hungary presents a ErordaryEorrowig 1.4 0.0 -1.0 1.2 number of problems for the policy analyst. Total 3.2 1.3 1.4 -0.4
From one perspective they have undergone many
years of reform and restructuring. However it Sourc2s Staff calculaton. does not yet seem to have achieved its expected
potential.
At the same time Hungary relied unduly Much of this somewhat disappointing on external finance during the seventies. In the performance may be attributed to its failure to early eighties world interest rates rose sharply so
the required servicing became unduly acceleration in inflation wage increases were
burdensome. moderated.
This external debt has been a continuing As the global economy recovered in the burden for the authorities and has limited their eighties Korea was well placed for a strong room to maneuver. export performance. At the same time they reduced their external debt burden so that by
1990 it was less than 15 percent of GDP. S.1.3 Korea
Evidently, Korea provides an example of Table XI
one of the more successful countries. There are Korea: Impacts of many explanations available for this success
ranging from those who highlight their swift and Responses to Extemral Shocks adoption of market principles to the advocates of (Annual Average over the Period) industrial policy who tend to emphasize the role
of such instruments as directed credits to certain 72-75 76-80 81-85 86-91 industries. Perhaps the best way to characterize
Korean policy is that it is pragmatic, flexible and Macroeconomic Indicators (WI
does not readily lend itself to one form or other GDP Growth 9.4 7.9 8.5 9.8
of ideological bent. Inflation (CPI) 16.1 17.4 7.3 6.2
Budget Deficit/GDP 2.1 1.7 2.0 D.0 Shocks. Korea experienced severe External Debt/GDP 29.2 36.7 48.8 23.1 adverse effects from the first and second oil Monetary Expansion 13.4 14.0 12.1 12.8 shocks. In each instance these accounted for
about 10 percent of GDP. (As f of GDP at Current Market Prices)
Impacts of External Shocks
Teamsof Trade Effec 3.0 1.4 -0.4 -0.4 Policy Response. The response to the Export Volume Effect 0.7 0.2 0.5 -0.7
first oil shock was to move to export-led growth. interest Rate Effect 0.0 0.1 -0.2 -0.o0 This was largely accomplished by AddiiionlfDebtServices -0.1 -0.1 -0.5 -1.0 macroeconomic stabilization, neutral trade Total 3.6 1.6 -0.6 -2.1 regime, and selective incentives. This resulted
in a depreciation of the real exchange rate to . . ~~~~~~Export erfor ance Reso n2 Promotion 3 .5 2 .2 3.0O 0 11 .4 support competitiveness. tmport Intensity 0 .2 -0.7 -0.4 -0.9
Economic Compreion 0.1 0.6 -0.2 -0.5
Following the second shock and the ExtmordinaryBorrowing -0.3 -0.6 -3.1 -2.2
accompanying slowdown in the global economy Total 3.6 1.6 -0.6 -2.1 the response was initially to curb domestic u-e: S
growth by restricting imports. At this time Sources: Stff calculaton. domestic fuel prices were adjusted upwards and
the growth of the money supply was tightened. This drove up interest rates and created
problems for Korean firms which historically 5.1.4 Philippines tended to have high debt/equity ratios. As die
growth rate stalled in the early eighties the The Philippines is sometimes viewed as authorities then decided to move to a more a Latin American style country in the middle of expansionary policy. In order to forestall an the successful East Asian countries.
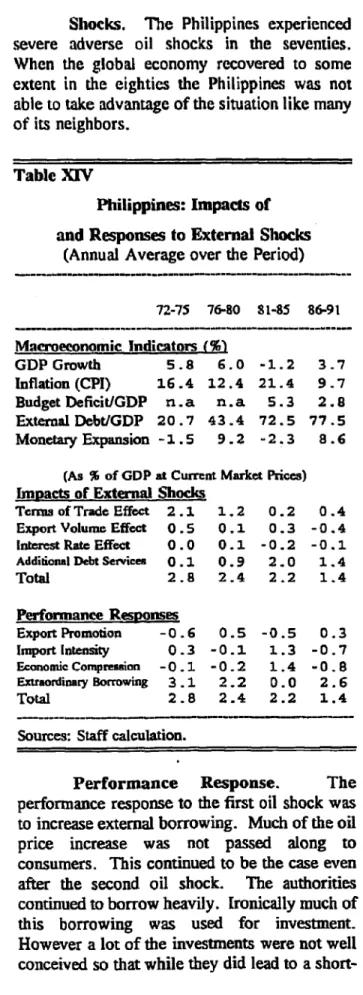
Shocks. The Philippines experienced term expansion they failed to yield the expected severe adverse oil shocks in the seventies. returns over time. The government deficit When the global economy recovered to some continued to expand and the real exchange rate extent in the eighties the Philippines was not appreciated. Eventually the policy moved to a able to take advantage of the situation like many strong contraction and uncertain political
of its neighbors. situation.
Table XIV In the late nineties they got some help in
addressing the external debt burden and moved
Philippines: Impacts of towards a more stable situation.
and Responses to External Shocks
(Annual Average over the Period) 5.1.5 Portugal
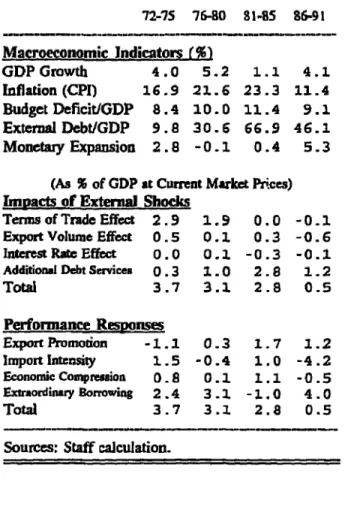
72-75 76-80 81-85 86-91 Portugal faced a variety of problems as --- it sought to restructure its economy from an
Macroeeonomic Indicators (%) inward looking one under the tightly controlled
GDP Growth 5 .8 6. 0 -1.2 3 7 regime of Salazar to moving to integration wit Inflation (CPI) 16.4 12.4 21.4 9.7 the world economy and becoming a member of BudgetDeficit/GDP n.a nr.a 5.3 2.8 the EEC.
ExtenalDebt/GDP 20.7 43.4 72.5 77.5
Monetary Expansion -1.5 9.2 -2.3 8 .6 Siocks. As an energy importer Portugal had adverse effects of about 10 per cent of GDP (As % of GtDP at Current Market Prices) due to the first and second oil shocks.
Impacts or Extenal Shocks
Tcrms of Trade Effect 2.1 1.2 0.2 0 .4
Expert Volumc Effect 0.5 0.1 0.3 -0.4 Performance Response. Portugal Interest Rate Effect 0.0 0.1 -0.2 -0.1 initially sought to borrow externally to offset the Additional Debt Services 0 .1 0.9 2.0 1 .4 impact of the first oil shock. However Total 2.8 2.4 2 2 1.4 following the second shock they sought to
Perfornanmce Responses strengthen their export performance. They
Export Promotion -0.6 0.5 -0.5 0.3 enjoyed some success at export promotion as
Import Intensity 0.3 -0.1 1.3 -0.7 their real exchange rate depreciated. Indeed, Economic Compression -0.1 -0 2 1.4 -0 -8 Portugal's exports recorded continuous gains in
Extraordinary Borrowing 3 .1 2.2 0.0 2.6 market share during the 1980s.
Total 2 . 8 2.4 2.2 1.4
Sources: Staff calculation. As the budget deficit increased in the Sus:tfclltnmid-eighties they sought to tighten monetary and
fiscal policy. This is reflected in the successful
Performance Response. The reduction of the budget deficit which declined
performance response to the first oil shock was from 15 percent to 5 percent between 1985 and to increase external borrowing. Much of the oil 1989. The slowdown in growth in the mid-price increase was not passed along to eighties also helped the current account through consumers. This continued to be the case even the fall in imports. The extemal debt was also after the second oil shock. The authorities brought under control so that presently it is continued to borrow heavily. Ironically much of about 40 percent of GDP.
this borrowing was used for investment.
However a lot of the investnents were not well Recent policies to privatize some of the conceived so that while they did lead to a short- public sector industries has helped restrain
budget deficits. The overall reform of the energy crisis and trade collapse",. The broad economy has also been helped by the large international (both successful and unsuccessful)
influx of EC structural funds. experience in addressing external shocks
suggests a number of policy responses for The unemploynent rate below 5 percent consideration. Among many policy measures, at the beginning of the nineties is the lowest in the following ones are especially relevant for
the EC except for Luxembourg. Ukraine, and thus deserve a high priority in
policy agenda. Table XV
Portugal: Impacts of (a) Macroeconomic Stabilization
and Response to Exteral Shocks Full commitment to and effective
(Annual Average over the Period) implementation of systemic reforms and
macroeconomic stabilization are necessary,
72-75 '7&a 81-85 86-91 though not sufficient, conditions to successflully
-- dealing with external shocks. Appropriate fiscal
Macroeconomic Indicators (%) and monetary policies shall be pursued to curb
GDP Growth 4 .0 5.2 1 .1 4.1. inflation and to restore macro-economic
Inflation (CPI) 16.9 21.6 23.3 11.4 imbalances, especially the state budget deficit
Budget Deficit/GDP 8.4 10.0 11.4 9.1 and the current account deficit in the balance of ExtemalDebt/GDP 9.8 30.6 66.9 46.1 payments.
Monetay Expansion 2. 8 -0.1 0.4 5.3
The economy will become less
(mpacts of ExteGnDa Shocks vulnerable to external shocks when a competitive Terns of Trade Effect 2.9 1.9 0.0 -0.1 market system has been developed through Export Volume Effect 0.5 0.1 0.3 -0.6 privatization of ownership and liberalization of Interest Rat Effcct 0.0 O.1 -0.3 -O.1 prices and controls. It is essential to dismantle
Additional Debt Senrices 0.3 1.0 2.8 1.2 the wide range of regulations that presently
Total 3.7 3.1 2.8 0.5 cover virtually all facets of economic life.
Performnance Respg.ses Reform of the legal system should move quicidy
Export Promotion -1.1 0.3 1.7 1.2 to dearly establish private property rights, allow lmport lntensiW 1.5 -0.4 1.0 -4.2 for enforcement of contracts, and provide a Economic Conmresion 0.8 0 .1 1.1 -0.5 supportive environment for commercial
Extraordinary Borrowing 2.4 32.1 -1.0 4.0 activities.
Total 3.7 3..1 2.8 0.5
Sources: Staff calculation. (b) Structura Adjutment
The fundamental way to cope with
external shocks in the medium and long run is
52 Broad Lessons for Ukaine though growth-oriented adjustment13. The
permanent nature of the external shocks demand
From the above analysis, it is clear that significant structural changes to better reflect
the main challenges for Ukraine in coping with Ukraine's comparative advantages. The service external shocks in the short to medium run are sector, which was underdeveloped during the to design effective strategies and appropriate Soviet era (especially services in the financial policies to mitigate the adverse impacts of market, e.g. banking and insurance), should be