HAL Id: hal-02348406
https://hal.archives-ouvertes.fr/hal-02348406
Submitted on 5 Nov 2019HAL is a multi-disciplinary open access archive for the deposit and dissemination of sci-entific research documents, whether they are pub-lished or not. The documents may come from teaching and research institutions in France or abroad, or from public or private research centers.
L’archive ouverte pluridisciplinaire HAL, est destinée au dépôt et à la diffusion de documents scientifiques de niveau recherche, publiés ou non, émanant des établissements d’enseignement et de recherche français ou étrangers, des laboratoires publics ou privés.
Low on Trust and High on Risks: Is Sidechain a Good
Solution to Bitcoin Problems?
Jamal Bouoiyour, Refk Selmi, Olivier Hueber
To cite this version:
Jamal Bouoiyour, Refk Selmi, Olivier Hueber. Low on Trust and High on Risks: Is Sidechain a Good Solution to Bitcoin Problems?. 2019. �hal-02348406�
1
Low on Trust and High on Risks: Is Sidechain a Good Solution to Bitcoin Problems?
Jamal Bouoiyoura, b, Refk Selmia, b and Olivier Hueberc a
IRMAPE, ESC Pau Business school, France. b
CATT, University of Pau, France. c
GREDEG CNRS, University of Côte d‟Azur, France.
*
Corresponding author: IRMAPE-ESC Pau Business School, 64000 Pau, France.Email: [email protected]; [email protected]
Abstract: Over the past few years, cryptocurrencies (especially Bitcoin) have attracted a particular attention. As the number of transactions increase, these systems tend to become slower, expensive, and unsustainable for a use-case such as payment. In this way, the Bitcoin sidechain seeks to provide prompt and confidential transactions between major trading platforms. Although poor performance and high volatility can push potential users away from Bitcoin, this study reveals that the introduction of sidechain solves some of the problems Bitcoin is facing. Using relatively new techniques, we find that the implementation of sidechain reduces Bitcoin price volatility, rises its efficiency, and enhances its usefulness as a transaction tool and a diversifier. We explain these changes in Bitcoin characteristics by the sidechain‟s capacity to speed up the circulation of money by shortening block validation times and to an improvement in the scalability of Proof of Work and Bitcoin payment services. Our results also indicate that the sidechain liquid network lead to a less energy-consuming and in turn to less polluting Bitcoin system. But a weakly vanishing causality between Bitcoin mining and Bitcoin energy consumption implies that the concentration of miners is still follow available electrical supply.
2
1. IntroductionBitcoin is the first and most famous virtual currency to date. Its core protocol initiated the concept of a blockchain, a type of cryptographic consensus protocol in which transactions are organized into blocks. Consensus is fulfilled through a proof-of-work which is a required precondition for a block to be valid. The transactions moving value within such blockchains have been effectively assessed to be highly secure in that consensus is reached, in turn offering a way for attaining consensus in a setting where neither reliable point-to-point channels exists nor a public-key infrastructure. Since the creation of Bitcoin in 2009, the idea of exploiting its technology to develop applications beyond currency has been fulfilling a wide level of international recognition. From the opinion of Bitcoin‟s advocates, the main purpose of this cryptocurrency is to be used as an alternative to the existing payments system and to enable transactions without the interference of governments or central banks. According to Bitcoin‟s supporters of cryptocurrencies, central banks always impose controls including restrictions on convertibility, without overlooking the exorbitant foreign transaction fees. From its supporters‟ views, Bitcoin nevertheless seems to provide a variety of advantages. One can cite, among others, it is based on decentralized system not related with any sovereign entities or central banks, and therefore its users are insulated from unforeseen events. Bitcoin guarantee security, transparency, authenticity and credibility. Security is warranted via encrypted transactions that are pseudonymous and sealed into blocks. Transparency is justified through the open public decentralized ledger that anyone can view. Authenticity and credibility are mainly ensured through an unalterable record of events (see, inter alia, Yermack, 2013; Bouoiyour and Selmi, 2015; Weber, 2016). However, multiple concerns have been raised about these Bitcoin characteristics. The extreme fluctuations have been dominantly due to the scandals and frauds which are frequent in the Bitcoin ecosystem, the wide unknowns involved in the development of cryptocurrency (Bouoiyour and Selmi 2016; Ciaian et al. 2016; Bouoiyour et al. 2019), and the informational inefficiency (Bariviera 2017; Selmi et al. 2018). In addition, as Bitcoin is a decentralized currency that not backed any central entity, the core system defies regulation and enforcement efforts, which intensifies the anxiety of financial regulators and cybercrime fighters (Möser et al. 2013). The blockchain poses also a barrier to utilizing Bitcoin for general-purpose payments (Bouoiyour and Selmi 2019). Furthermore, because of the centralization in the Bitcoin ecosystem, counterparty risk has become greater (Böhme et al. 2015). The operations established with fraudulent intent also pose potential dangers to the Bitcoin ecosystem (Vasek and Moore 2015).
Interestingly, given the increasing number of transactions, the average confirmation time for a transaction and the block difficulty rose. In this background and for widespread adoption of blockchain systems, scalability or the capacity of Blockchain to provide the same services whatever the number of transactions seems another major obstacle. In short, the main problem of this kind of network thus resides in the scalability, that is to say the capacity of this Blockchain to provide the same services (processing speed) whatever the number of transactions. Also, when platforms such as Bitcoin or other giant cryptocurrencies like Ethereum or Ripple started to become famous and frequented by many users, their ability to process transactions promptly ran into latency issues. The technology of the sidechain is a response to this problem of scalability. A sidechain connects several blockchains among themselves. It is a blockchain “pegged” to the main blockchain allowing transfers of key informations (tokens) from one chain to the other. A sidechain is a private blockchain similar to other private blockchains but there is some control (by “federation members”) over who is allowed to send transactions (Hueber, 2019). This sets it apart from open systems, such as Bitcoin or Litecoin, that any user can join. Instead of being a self-contained system like some other private blockchains, a sidechain is designed as a layer beside of the parent blockchain (for instance the Bitcoin's blockchain).
3
A sidechain is a decentralized peer-to-peer networks of value exchange that do not need any central banks or other third parties (Hueber, 2018). On october 30, 2018, Kiayias and Zindros (2018) introduced the trustless construction for proof-of-work sidechains, depicting precisely how to build generic communication between blockchains. More interestingly, of all the implications of blockchain, the energy use of Bitcoin has captured tremendous attention. Since the marked rise of Bitcoin‟s value in 2017, attention turned to the Bitcoin‟s energy and environmental footprint. Several articles documented that the electricity use of the bitcoin network had equaled that of medium-sized countries and was on track to consume as much electricity as the United States in 2019 and all of the world‟s energy by 2020 (see, inter alia, Bendiksen et al. 2018 ; Bevand 2018 ; de Vries 2018). Mora el al. (2018) showed that if Bitcoin is implemented at similar rates at which other technologies have been incorporated, it alone could generate enough emissions to push global temperatures above 2°C as soon as 2033. This study compares Bitcoin features (with respect volatility, speculation, efficiency, its usefulness as a transaction tool, its energy use, and its diversification opportunities and downside risk reduction) prior and post the introduction of proof-of-work sidechains. For this purpose, we first use a GARCH–jump model, to adequately estimate the volatility of Bitcoin price index. The technique is much more flexible than the standard GARCH extensions since the asymmetric effect of the good versus bad news can be different for the jump versus normal innovations. These relatively new characteristics allow a richer characterization of volatility dynamics, particularly with respect to events in the tail of a distribution. Second, we apply the MF-DFA procedure to compare the multifractal and efficiency properties of Bitcoin. Third, another novelty of this research lies in the usage of the frequency domain causality test, which allows us to understand in a different way the causality between Bitcoin and the exchange-trade ratio (ETR) as a proxy of Bitcoin‟s use in transactions. Instead of computing a single Granger causality measure for the connection between Bitcoin and ETR, the direction of the Granger causality is determined for different frequency components. Precisely, the covariance of these variables is decomposed into various spectral components. The aim is that a stationary process can be depicted as a weighted sum of sinusoidal components with a certain frequency, allowing us to evaluate dissimilar cyclical components. These techniques are appealing as the behavior of time series often appear to go through several phases. Fourth, we compare the Bitcoin energy use before and after the implementation of sidechains by referring to recent published estimates of bitcoin‟s electricity consumption. Fifth, we conduct a risk management analysis using different risk measures in order to compare the risk of the Bitcoin-stocks portfolio holdings and a benchmark portfolio composed of stocks only before and after the introduction of sidechain. Such comparative and accurate analysis would be useful for both portfolio risk managers, traders and investors aimed at utilizing Bitcoin as a transaction tool and a safe haven investment allowing to safeguard against rising uncertainty.
Our findings reveal that the introduction of sidechain technology mitigates the volatility of Bitcoin price, improves its efficiency and reinforces its function as a transaction tool and its diversification ability. It also reduces even moderately its energy use.
The remainder of the article is organized as follows: Section 2 displays an overview of the main advantages of the sidechain technology. Section 3 discusses the data, and provides a detailed account of the methodology. Section 4 reports the empirical findings. Section 5 concludes.
2. An overview of the advantages of sidechains
The sidechain technology enforces privacy with transactions made with tokens (e.g. Bitcoins) from the parent chain (for example, the blockchain of bitcoins). The essential property on which the sidechains rely is the two-way peg (2WP) which needs to be set up to transfer assets from one chain to another. Indeed, if one wants to have a system that keeps its economic coherence, it must be able to move the asset concerned in both directions. The tokens coming from the parent chain have to be sent
4
to a multisignature address on the sidechain (Peg-in). Such a multisignature address is controlled by members of what‟s called a “strong federation”. Conversely, the transfer back from sidechain's tokens to the parent chain (Peg-out) requires its holder to go through a federation member (see Appendix A). A sidechain enables to safely develop new exchange of tokens without jeopardizing the parent chain core code (Back, 2015). The members of a Sidechain can tokenize fiat currencies, diploma, smart contracts, securities, or even other cryptocurrencies. With sidechains, a Parent chain (for instance, The Bitcoin‟s blockchain) can acquire innovations from alternative chains. Three main categories of users of tokens created inside the sidechain can be especially interested by the advantages of the Sidechain technology. It is about the lenders, the businesses and the crypto-money lenders. The lenders of smart contracts can ensure that the tokens of the sidechain are used as collateral. They stay locked up as long as the loans get repaid over time. In case of default, the locked tokens are seized by the lender. In counterpart of the sidechain's tokens, enterprises can issue their own security tokens, like tokens for investors accreditation, tokens to certify a diploma holding, tokens to give access to specific geographic areas, tokens for playing online videogames... (see Appendix B). The value of altcoin (for example, Bitcoins or Litecoin) holdings by cryptomoney traders can be secured by pegging altcoins to an amount of sidechain‟s tokens. Moreover, the convertibility among altcoins themselves is made easier and cryptomoney exchanges are more reliable. In addition to the fact that sidechains are bridges to move from one blockchain to another and not to be limited to the tokenization of cryptocurrencies.
A significant advantage of the Sidechain‟s technology lies in its capacity to significantly speed up the circulation of money by shortening block validation times. Any blockchain working in the same way as the Bitcoin‟s blockchain requires a long confirmation time before certifying a transaction. With a sidechain, any transaction can be fully completed in a couple of minutes (see Appendix C for the operating principle). Members of a Sidechain can provide verifiable audit records to third parties. Such a transaction is time saving and can be settled in less than 2 minutes compare to on average 7 minutes in the Bitcoins Blockchain‟s. The search for speed in the settlement of transactions is very important. In comparison, the Visa centralized payment network easily reaches 24,000 transactions per second. On this aspect of speed, the blockchain technology cannot compete with electronic currencies carried by official interbank systems. The procedure to establish a transaction within a sidechain is a real progress in terms of speed even if 1 to 2 minutes for a transaction is relatively long. However, this performance is still insufficient to compete with payments in legal tender electronic money via Visa or Mastercard. Although the sidechain technology is a real progress in terms of speed in comparison with to the duration of certification of blocks in cryptocurrency blockchains, this peg-in / peg-out technology is not the fastest. It is possible to accelerate the speed of settlement of transactions by using a single sparse Merkle tree to provide an authenticated data structure for the ledger history (Merkle, 1987). Such a protocol allows sharing the database across multiple machines which increases capacity and rapidity of certification.
The shortening of transactions confirmation times in the sidechain goes hand in hand with a reduction in transaction costs. The cryptocurrency blockchains, like that of Bitcoins, are with time more and more energy hungry. With the increase of the length of the blockchains (parent chain) the problem of scalability is more and more acute. Not only blockchains are energy intensive but they can also suffer from congestion even collapse. Such a phenomenon has already occurred in the past (for example, Ethereum in 2017 with the CryptoKitties bubble). The implementation of a sidechain pegged to a main chain can overcome such problem of scalability. At the present time, to ensure the scalability of the Bitcoin, the Bitcoin‟s blockchain is pegged to two sidechains, RSK and Liquid. The first focuses on the execution of smart contracts, while the secondeases transactions between different financial players.
5
3. Methodology and data3.1. Measuring volatility
The excessive volatility of the main financial prices is largely regarded as a measure of risk. The literature on volatility has frequently focused on two approaches. The first consists of the time-varying volatility models that enable for market extremes to be the result of normally distributed shocks that have a randomly varying variance. The second is related to models that include discontinuous jumps in the asset price dynamics. As the type of shocks are critical to appropriately examine a complex phenomenon like the Bitcoin price dynamics, this study differentiates between the changes in Bitcoin prices due to normal innovations and those due to unusual innovation or unexpected events (i.e., jumps). In this way, the GARCH-jump model for returns maintains an unobserved news process that directs the time series returns. In general, news events together with investors‟ expectations of these events lead to changes in time series.
This study does not focus on the latent news process directly but rather uses a model, proposed by Maheu and McCurdey (2004), of the conditional variance of returns implied by the impacts of various types of news. The latent news process is presumed to have two dissimilar components, dubbed normal and unusual news events. These news innovations (normal and unusual) are identified through their impacts on the return volatility. In particular, the impact of unobservable normal news innovations is assumed to be captured by the return innovation component (
1,t). This component of the news process causes smoothly evolving changes in the conditional variance of returns. The second component of the latent news process is assumed to generate large changes in returns. The effect of the unusual news events is labelled jumps (
2,t).We start by identifying the components of returns. Given the information set at time t- 1, which consists of the history of returnst1
rt1,...,r1
, the two stochastic innovations,
1,tandt
, 2
determine the returns,t t
t
r 1, 2, (1)
where
1,t is specified as a normal GARCH error term such thatE[1,tt1]0,
2,tis a jumpinnovation with a normal stochastic forcing process such thatE[
2,t
t1]0,
1,tiscontemporaneously independent of
2,t.The conditional variance of returns is disentangled into two components, namely a smoothly evolving conditional variance component associated with the diffusion of past news effects, and a conditional variance component related to the heterogeneous information arrival process which induces jumps. The conditional variance of returns is,
) ( ) ( ) (rt t1 Var 1,t t1 Var 2,t t1 Var
(2)The first component of the conditional variance,
t2
Var
(
1,t
t1)
is expressed as a GARCH function of past return innovations,2 1 2 1 1 2 ) ( t t t t g (3)
6
where g(·) is a function of the parameter vector
or the feedback coefficients from past return innovations, and
t1
1,t1
2,t1is the total return innovation observed at time t-1. The GARCHvolatility component (
t2) enables past shocks to exert influence on expected volatility and detects thereafter the smooth autoregressive changes in the conditional variance that are predictable based on past news impacts.The second component or the conditional variance component associated with the jump innovation is denoted as:
t t
t
Var(2, 1)( ) (4)
where
refers to the number of jumps and potential jump clustering or the jump-persistence coefficient,
is the jump-size standard deviation parameter, and
tis the conditional jump intensity. Based on Equation (4), the contribution to the conditional variance from jumps will change over time as the conditional jump intensity varies.3.2. Testing for efficiency
Over the past five decades, the efficient market hypothesis(EMH) has been a topic of intense thought and debate. Since the EMH has emerged (Fama 1970), it has been subject to a huge number of academic studies. This hypothesis postulates that asset prices fully reflect all available information. The efficiency hypothesis also necessitates a significant transparency and instantaneous reactivity with respect to new information. Fama (1970) differentiated among three forms of efficiency, with the weak form being the most frequently assessed. A market is proclaimed to be weak form efficient, if investors cannot utilize past information to predict future returns. The weak form EMH has been investigated in the literature for many traditional financial assets (Fama, 1970; Frenkel, 1976) and several commodities (Danthine 1977; Koutsoyiannis 1983). Some works use the detrended fluctuation analysis (DFA) method to test the validity of the efficiency hypothesis (see, for example, Cajueiro and Tabak, 2005). The underlying hypothesis of the DFA method is to assume mono-fractal structure for financial time series. Despite the relevance of this technique, Kwapień et al. (2005) and Oświęcimka et al. (2005), Sensoy (2013), Kristoufek and Vovsrda (2016) and Bouoiyour et al. (2017) claimed that financial time series are multifractal and underscored the ineffectiveness of a single scaling exponent to appropriately describe financial data since it may prompt spurious conclusions. Several empirical studies have utilized the multifractal methods to investigate the degree of EMH and the dynamics of financial markets. We identify wider number of papers focused on stock markets. For example, Rizvi and Arshad (2017) employ the MF-DFA to test whether the Japanese stock market follows the efficient market hypothesis. The authors suggest that the efficiency of this market is time-varying. Moreover, Wang et al. (2017) examine the multifractal features of Asian stock markets, and indicate that the Asian stock markets are multifractal in nature. He and Wang (2017) apply the multifractal detrending moving average algorithm while attempting to identify the potential sources of multifractality in the US and Chinese stock markets. It was shown that the long-dependence and fat-tailed distributions are among the main sources of multifractility in those markets. In short, there are a noticeable number of researches focusing on the multifractality and efficiency in financial markets. Nevertheless, much less attention was paid to the Bitcoin market which has witnessed an impressive growth during the last years. Despite its increasing popularity and acceptance, the discussion about the efficiency of Bitcoin market is relatively very scarce (for instance, Bartos 2015; Urquhart 2016; Selmi et al. 2018). This study is the first to implement the the Multifractal Detrended Fluctuation Analysis
7
(MF-DFA) method to compare the multifractal properties of Bitcoin price index before and after the implementation of sidechain. The MF-DFA is a dynamic approach that accounts for irregularities that may be embedded in the Bitcoin market including nonlinearities, asymmetries, fat-tails and volatility clustering.
Following Kantelhardt et al. (2002), the MF-DFA method is a generalization of the Detrended Fluctuation Analysis (DFA), which consists of five steps. Let assume that 𝑥𝑡, 𝑡 = 1, … , 𝑁 be a time series of length N.
Step 1: we determine the “profile” yk of the time series x(k) for k = 1,… , N, as:
𝑦𝑘 = 𝑘𝑡=1 𝑥𝑖− 𝑥 , 𝑘 = 1, … , 𝑁 (5)
where𝑥 denotes the average over the whole time series.
Step 2: we divide the “profile” 𝑦𝑘into 𝑁𝑠≡ 𝑁 𝑠non-overlapping segments of equal lengthswhere s is
the scale.
Step 3: we estimate a local trend by fitting a polynomial to the data. Thereafter, we calculate the
variances by the two following formulas, depending on the segment v: 𝐹2 𝑠, 𝑣 =1 𝑠 𝑌 𝑣 − 1 𝑠 + 𝑖 − 𝑦𝑣 𝑖 2 𝑠 𝑖=1 (6) for𝑣 = 1,2, ⋯ , 𝑁𝑠, and 𝐹2 𝑠, 𝑣 =1 𝑠 𝑌 𝑁 − 𝑣 − 𝑁𝑠 𝑠 + 𝑖 − 𝑦𝑣 𝑖 2 𝑠 𝑖=1 (7) for𝑣 = 𝑁𝑠+ 1, ⋯ , 2𝑁𝑠.
Step 4: By averaging the variances over all segments, we obtain the qth order fluctuation function:
𝐹𝑞 𝑠 = 1 2𝑁𝑠 𝐹 2 𝑠, 𝑣 𝑞2 2𝑁𝑠 𝑣=1 1𝑞 (8)
where the index variable q can take any real values except zero. For q = 2, the standard DFA procedure is retrieved.
Step 5: we investigate the multiscaling behavior of the fluctuation functions Fq (s) by determining the
slope of log-log plots of Fq (s) vs. s for various values of q. 𝐹𝑞 𝑠 ~𝑠ℎ 𝑞 (9)
The time series is multifractal ifℎ 𝑞 depends on q.
It is well documented that the generalized Hurst exponent h(q) defined by the MF-DFA is linked to the multifractal scaling exponent τ(q) known as the Rényi exponent:
τ(q) = qh(q) – 1 (10)
Ultimately, we test the efficiency of the Bitcoin market by using the inefficiency index based on the multifractal dimension (IDM), given by:
8
𝐼𝐷𝑀 =1
2 ℎ −5 − 0.5 + ℎ 5 − 0.5 = 1
2ℎ (11)
The Bitcoin market is efficient if the value of IDM is close to zero, while strong IDM values indicate a less efficient market.
3.3. Bitcoin’s use in transactions
To explore the usefulness of Bitcoin as a transaction tool, we test the causality between Bitcoin
returns and the exchange-trade ratio. The concept of causality test was initiated by Granger (1969).
Subsequently, Geweke (1982) proposed a measure for this Granger causality under a frequency domain framework. Given its usefulness, testing causality has been widely and extensively examined
(Breitung and Candelon 2006) and then has been employed in several researches to evaluate lead-lag
relationships between macroeconomic variables with respect to frequency rather than time (Bodart and
Candelon 2009; Arouri et al. 2014; Bouoiyour et al. 2015, among others). The Breitung and Candelon
(2006)‟s test disentangles the short-, medium- and long-run Granger-causality between two series investigated. Hence, the starting point of this testing procedure will be the Granger causality test “A variable Yt is said to Granger cause Xt, if Yt contains information to predict Xt that is not available
otherwise” (Lütkepohl 2006, pp.41).
To define the frequency causality test, we consider as a two-dimensional time series
vector with t = 1… T. It is supposed that zt has a finite-order VAR representation where
is a 2 × 2 lag polynomial with . It is assumed that the vector εt is
white noise with and E (εtεt′) = Σ, where is a positive definite matrix.
The system is stationary denoted as:
(12)
The spectral density can then be derived from the previous matrix and expressed as follows: (13)
Spectral analysis enables to identify the cyclical properties of data. The frequency domain causality test relies on a modified version of the coefficient of coherence. It allows deriving the distributional properties of time series. Let xt and yt (the variables of interest) be stationary variables of
length T. The goal of this study is to test whether xt Granger cause yt ,at a given frequency λ, even if
we control for Zt ( additional control variables). Geweke (1982) proposed a measure of causality
denoted as:
(14)
As is a complex function of the VAR parameters, Breitung and Candelon (2006) and in order to resolve this drawback argue that the hypothesis M x→y/Z (ω) = 0 correspond to a linear
restriction on the VAR coefficients.
t t
tx
y
z
,
t tz
L
(
)
p p t L L z L
( ) 1 1 ... t t k kz
z
L
0
)
(
t
E
E
(
t
t'
)
21 12 22 21 12 11 ) ( ) ( ) ( ) ( ) (
L L L L L zt t 21 12 22 21 12 11 ) ( ) ( ) ( ) ( ) ( L L L L L t 2 12 2 11( ) ( ) 2 1 ) ( iw iw x w e e f 2 11 2 12 / ) ( ) ( 1 log ) ( iw iw Z y x e e w M
2 12(
)
iwe
9
(15) where
The significance of the causal relationship can be tested by a standard F-test or by comparing the causality measure for ω ∈ [0, π]with the critical value of a χ2 distribution with 2 degrees of freedom, which is 5.99.
3.4. The Bitcoin energy use
The electricity use of Bitcoin has yielded to huge difficulties regarding where to put the facilities that reckon the proof-of-work of Bitcoin. Throughout this paper and to check if the implementation of sidechain limits Bitcoin energy use, we test the causality that runs from Bitcoin mining to Bitcoin energy consumption prior and post the introduction of the proof-of-work sidechain. To this end, we conduct the frequency domain causality approach explained above. Unlike the causal standard approaches that consider the direction of causality between economic variables across the full studied period, the frequency causality enables to evaluate causality among different frequencies. Basically, the standards measurement of the causality for various periods may be performed by standard models by subdividing the sample period to well specific sub-periods. This procedure seems vulnerable since it is based on a relatively small number of data that may threaten the robustness of the results. To avoid this drawback, the frequency analysis seems able to keep all the observations over the period of investigation in each of the frequencies involved.
3.5. Portfolio risk management
Following Reboredo (2013), we evaluate the usefulness of Bitcoin for portfolio risk management by comparing the risks for portfolios composed of Bitcoin and S&P500 stocks (Portfolio II) with the risk of a benchmark portfolio composed of stocks only (Portfolio I). Precisely, we attempt to examine the potential reduction in the portfolio risk generated by the incorporation of Bitcoin in a portfolio prior to and post the implementation of sidechain. We consider a risk-minimizing Bitcoin-stock portfolio without reducing the expected return. Based on Kroner and Ng (1998)‟s study, at time
t, the optimal weight of Bitcoin price in this portfolio (wt BTR ) is denoted as: 1 1 1 0 0 0 w ith , 2 , , BTR t BTR t BTR t BTR t BTR t Stocks t Stocks BTR t BTR t Stocks BTR t Stocks t BTR t w w w w w h h h h h w (16) where ht BTR , ht Stocks and ht BTR,Stocks
are the conditional volatility of the Bitcoin price, the conditional volatility of the stocks and the conditional covariance between the Bitcoin price and the stocks, respectively.
To ascertain the robustness of our results, we also assess the attractiveness of the Bitcoin in providing risk protection after the introduction of sidechain, using four different risk measures. For the two portfolios I and II, we estimate the Value-at-Risk (VaR), the Expected Shortfall (ES), the semi-variance (SV) and the regret (RE).
The VaR provides the maximum loss in a portfolio value for a given time period and confidence level. At time t, the VaR for a portfolio with return Rt is given by the p
th
percentile of the return distribution: (17) 0 ) ( ) ( : 0 R L H ) sin( )... 2 sin( ) sin( ) cos( )... 2 cos( ) cos( ) ( p p R 1 Pr(Rt VaRt |yt)p
10
where yt-1is the information provided at t-1; the VaR can be written as following:
(18) where mt and are the conditional mean and standard deviation for the asset returns, and tv
-1 (p) denotes the pthquantile of the Student-t distribution with v degrees of freedom.
The ES is presented as the expected size of the loss given that the VaR is exceeded:
. (19) The SV determines the returns variations drawn below a specific threshold. Potentially, SV measures the return variance of negative returns. It is expressed as follows:
(20) The RE measures the expected value of returns that they are below zero:
. (21)
3.6. Data and descriptive statistics
As mentioned at the outset, this study compares Bitcoin characteristics prior to and post the introduction of sidechain in terms of its volatility, its efficiency, its speculative behavior and its usefulness as a transaction tool. The Coin Desk Bitcoin Price Index represents an average of Bitcoin prices across leading Bitcoin exchanges, and therefore it detects global Bitcoin prices better than other alternatives. As a measure of the transactions use, we employ the ratio between trade and exchange transaction volume or the ratio between the volumes on the currency exchange markets and in trade.
Besides, the creation of new bitcoins is mainly determined by the difficulty that mirrors the
computational power of Bitcoin miners (or the hash rate, HR). The latter is the measuring unit
of the processing power of the Bitcoin network. It makes an intensive mathematical operation
that has a significant impact on Bitcoin purchasers.
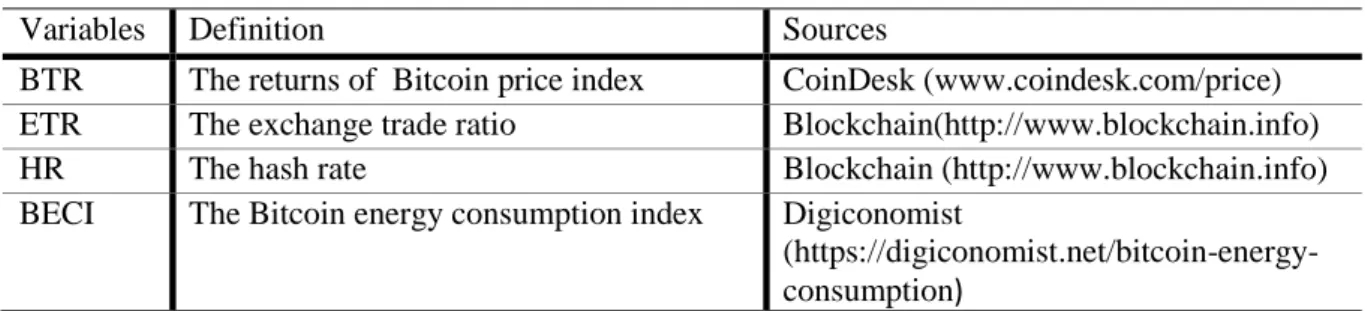
Since its creation, the trust-minimizing consensus of Bitcoin has been allowed by its proof-of-work algorithm. The machines performing the “work” consume wide of energy to achieve this work. The Bitcoin Energy Consumption Index (BECI) was mainly developed to offer precise information into this amount, and raise consciousness on the unsustainability of the proof-of-work algorithm.Table 1 reports all the data used and their sources.Table 1. Data sources
Variables Definition Sources
BTR The returns of Bitcoin price index CoinDesk (www.coindesk.com/price) ETR The exchange trade ratio Blockchain(http://www.blockchain.info)
HR The hash rate Blockchain (http://www.blockchain.info)
BECI The Bitcoin energy consumption index Digiconomist
(https://digiconomist.net/bitcoin-energy-consumption) 1 ( ) ( ) t t v t V aR p m t p h t h
ES
E(
R
t|
R
t
VaR p
t( ))
2 t t SV E min 0, R - E R
t Re E min 0, R 11
Table 2 provides the descriptive statistics for the daily returns1 of the variables of Bitcoin (BTR), the exchange-trade ratio (ETR), the hash rate (HR) and the Bitcoin energy consumption index (BECI) before and after the implementation of sidechain. In particular, we consider two equal periods before and after October 30, 2018 (Period 1: from February 01, 2018 till October 30, 2018; Period 2: From 31 October till 31 July 2019, i.e., 275 observations each period)
.
We show that the average daily returns of all the time series under study is positive for the two considered periods (see Table 2). The mean returns are close to zero for all of the return series and appear small relative to their standard deviations, which would imply that there is no significant trend in the data. The standard deviation values indicate that Bitcoin returns, exchange-trade ratio, the Bitcoin difficulty or the hash rate and the Bitcoin energy consumption become less volatile after the introduction of sidechain. For Period 1, the skewness coefficient for all the variables is negative and the kurtosis coefficients is above three, indicating that the probability distributions of the considered return series are skewed and leptokurtic, thereby rejecting normality. On the contrary of Period 1, BTR becomes positively skewed, implying that including Bitcoin in a risky portfolio may improve the portfolio‟s skewness and then reduce risk exposure. In addition, for Period 1 and Period 2, the Jarque–Bera test statistics imply a rejection of the null hypothesis that the time series are normally distributed.Table 2. Descriptive statistics of return series
Period 1 : Before the introduction of sidechain Period 2 : After the introduction of sidechain
BTR ETR HR BECI BTR ETR HR BECI
Mean 0.0914 0.0416 0.0148 0.0221 0.0816 0.0201 0.0265 0.0613 Median 0.0786 0.0386 0.0127 0.0194 0.0692 0.0228 0.0257 0.0481 Std. Dev. 6.1257 4.1134 2.1223 1.0310 3.0310 3.0214 1.0393 0.8112 Skewness -0.0500 -0.0678 -0.1950 -0.0372 0.1356 -0.2017 -0.1862 -0.1583 Kurtosis 3.6500 4.1578 3.6266 3.9831 3.9812 4.2134 3.6753 3.5167 Jarque-Bera 11.263*** 13.245*** 24.778*** 14.895*** 12.909*** 15.855*** 11.493*** 17.034***
Notes: in the table denotes statistical significant
.
4. Empirical results
4.1. Bitcoin price volatility
The conditional variance is a combination of a smoothly evolving GARCH component and a jump volatility component. Conditional on the type and the importance of the information shown by the news, the jump size may be negative, positive, strong or relatively moderate. Jumps may also reflect good or bad news events. Hence, the Bitcoin price dynamics are determined here by the time-varying rate of jump arrival, jump size, asymmetry and volatility clustering. The volatility refers to the amount of risk related to the size of unexpected Bitcoin changes. Table 3 reports the estimation output of the GARJI model for Bitcoin price volatility before (Period 1) and after the introduction of sidechain (Period 2). The mean equation coefficient µ is significant and close to zero for both periods. The GARCH equation of the GARJI model indicates that α, the coefficient measuring the size effect of an innovation on volatility is small, whereas β, the coefficient corresponding to the persistence of volatility shocks is high for the second period. This implies that innovations in Bitcoin has a modest impact on the conditional variance when they arrive but persist in the memory of the variance process for a long time. This holds true over the period before the implementation of sidechains. The
1
The use of daily data enables us to evaluate the immediate market reaction to specific innovations. With high frequency data, we can set a narrow time window around each unforeseen event to effectively address whether the Bitcoin market responded to particular news.
12
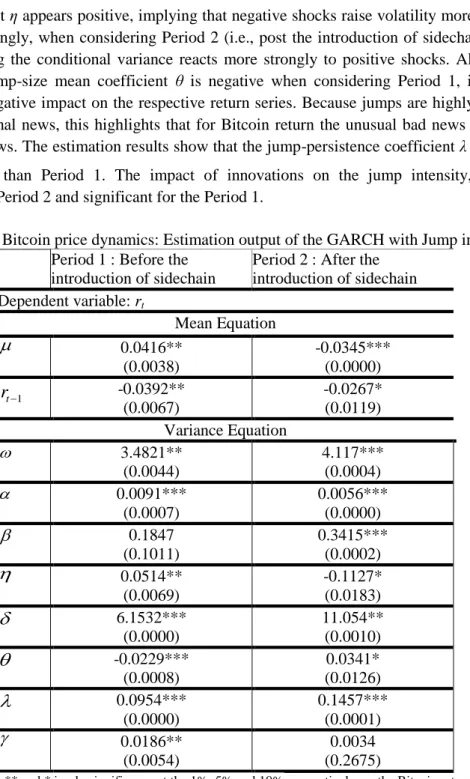
asymmetric effect η appears positive, implying that negative shocks raise volatility more than positive shocks. Interestingly, when considering Period 2 (i.e., post the introduction of sidechains), ηappears negative meaning the conditional variance reacts more strongly to positive shocks. Also, unlike the Period 2, the jump-size mean coefficient θ is negative when considering Period 1, indicating that jumps have a negative impact on the respective return series. Because jumps are highly linked to the arrival of abnormal news, this highlights that for Bitcoin return the unusual bad news outweighs the unusual good news. The estimation results show that the jump-persistence coefficient λ is stronger for Period 2 rather than Period 1. The impact of innovations on the jump intensity, , appears insignificant for Period 2 and significant for the Period 1.
Table 3. Bitcoin price dynamics: Estimation output of the GARCH with Jump intensity model Period 1 : Before the
introduction of sidechain
Period 2 : After the introduction of sidechain Dependent variable: rt Mean Equation 0.0416** (0.0038) -0.0345*** (0.0000) -0.0392** (0.0067) -0.0267* (0.0119) Variance Equation 3.4821** (0.0044) 4.117*** (0.0004) 0.0091*** (0.0007) 0.0056*** (0.0000) 0.1847 (0.1011) 0.3415*** (0.0002) 0.0514** (0.0069) -0.1127* (0.0183) 6.1532*** (0.0000) 11.054** (0.0010) -0.0229*** (0.0008) 0.0341* (0.0126) 0.0954*** (0.0000) 0.1457*** (0.0001) 0.0186** (0.0054) 0.0034 (0.2675)
Notes: ***, ** and * imply significance at the 1%, 5% and 10%, respectively; rt: the Bitcoin returns at date t; r t-1:
the lagged Bitcoin returns.
4.2. Bitcoin market efficiency
Figure 2 describes the multiscaling behavior of the fluctuations Fq (s) versus the time scales during the periods before and after the introduction of sidechains. One crossover point can be observed for Bitcoin returns over the two periods under consideration (Period 1 and Period 2, Figure 1). This reflects a change in the properties of Bitcoin at various scales of time. It is also revealed that the function h(q) presents a nonlinear decreasing form for increasing values of q which underscore‟s the multifractal nature of Bitcoin market. We find that generally observed irregularities including nonlinearities, asymmetries, fat-tails and volatility clustering are embedded in the Bitcoin behavior, which makes it risky but a profitable market for investors. In general, the price fluctuations in financial markets are governed by a very complex law. This complexity can be explained by the
1 tr
13
nonlinear interactions among heterogeneous agents and by events happening in an external environment.
Figure 2. Dynamic returns, multifractal spectrum and the curve of Fq(s) vs. s in a log–log plot of Bitcoin returns
Period 1 : Before the introduction of sidechain Period 2 : After the introduction of sidechain
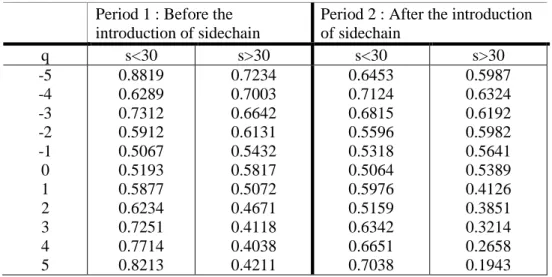
After the crossover identification, we compute the fitting curves‟ slopes (i.e., the generalized Hurst exponent) and reports the generalized Hurst exponents h(q) for large and small fluctuations. The generalized Hurst exponents for various small and large time scales can reflect the autocorrelated behavior of the Bitcoin market in the short- and long-term horizons. In general, the short-term traders pay attention to the dynamics of Bitcoin prices very frequently. They focus on the analysis of the daily Bitcoin prices and execute the transactions at a high frequency. Nevertheless, the long-term traders do not concentrate in the evolution of the Bitcoin market every day. Rather, they focus on the market long-run circumstances and execute transactions at low frequencies. For our case, we examine the different behaviors for the scales of both less than a month and more than a month (for about 30 trading days). Table 5 reports the generalized Hurst exponents for s < 30 and s > 30 with q varying from −5 to 5 for the two periods under study. The evolution of h(q) for s < 30 and for s > 30 appears to significantly depend on the values of q, thereby suggesting that the Bitcoin returns are multifractal both in the short-run and in the long-run. Besides, we note that all of the generalized Hurst exponents are larger than 0.5 for s < 30, highlighting that all kinds of Bitcoin variations seem to be persistent in the short-term. However, the generalized Hurst exponents for s > 30 diminish, depending on q. Overall, for the two periods under study, we note that the Bitcoin market is distinguished by a long-memory phenomenon seen in the short-term by the speculating attitudes of investors. In other words, Bitcoin is still mainly used for speculative purposes.
14
Table 5. The generalized Hurst exponents of Bitcoin returns with q varying from -5 to 5 Period 1 : Before the
introduction of sidechain
Period 2 : After the introduction of sidechain q s<30 s>30 s<30 s>30 -5 -4 -3 -2 -1 0 1 2 3 4 5 0.8819 0.6289 0.7312 0.5912 0.5067 0.5193 0.5877 0.6234 0.7251 0.7714 0.8213 0.7234 0.7003 0.6642 0.6131 0.5432 0.5817 0.5072 0.4671 0.4118 0.4038 0.4211 0.6453 0.7124 0.6815 0.5596 0.5318 0.5064 0.5976 0.5159 0.6342 0.6651 0.7038 0.5987 0.6324 0.6192 0.5982 0.5641 0.5389 0.4126 0.3851 0.3214 0.2658 0.1943
Table 6 summarizes the mean values of IDM in the Equation (11) during periods of upward and downward linear trends
of the Bitcoin price
index for the period before the introduction of sidechain (Period 1) and the period after implementation of sidechain (Period 2). To test the significance of the difference of IDM, we utilize the following equation:IDMi = α + β∗Di + εi (16)
Where IDMi describes the value of IDM defined in Eq. (12) for Bitcoin return series in the ith rolling window. Di is a binary variable where Di equals 1 if the Bitcoin price index in the ith time window shows an upward trend, and Di equals 0 otherwise. Finally, εi is the stochastic noise.
For the period 1, we find that the IDM mean value during the upward period is stronger than during the downward period for Bitcoin, implying less efficiency in period of distress. The findings change fundamentally when accounting for the period 2. Specifically, we show that Bitcoin becomes more efficient in downward periods rather than upward times. This underscores that the introduction of the sidechain increases the Bitcoin predictability power, highlighting that investors could better use the forecasting predictability to evaluate the risk and make better portfolio choices based on the market conditions.
Table 6. IDM mean values during downward and upward periods Period 1 : Before the introduction of
sidechain
Period 2 : After the introduction of sidechain Downward trends Upward trends t-statistics Downward trends Upward trends t-statistics BTR 0.2145 0.1817 -11.4261*** 0.1614 0.1891 -2.6751**
Notes: ** and ***: indicates significance at the 5% and 1% levels.
4.3. Bitcoin as a transaction tool
Instead of computing a single Granger causality measure for the entire causality running from BTR to the ETR, the direction of the Granger causality is determined here for different frequency components. Precisely, the covariance of these variables is decomposed into various spectral components. Figure 3 contains the test statistics with their 5 percent critical values (blue line) over the
15
interval [0, π] for the causal relationship between BTR and ETR over Period1 and Period 2 under
consideration. Prior to the introduction of sidechains (i.e., Period 1), we observe that the null
hypothesis of BTR no Granger-cause ETR is rejected for for corresponding to a cycle length of 79 days2. When we consider the period after the introduction of sidechains, the results change but not markedly. In particular, we note an improvement in the Bitcoin‟s function as a transaction tool. Specifically, there exists a significant causality running from BTR to ETR in the short-term but with more extent, for ω less than 2.16 for a cycle length of 87 days, superior to that of the first period. This outcome may be attributed the sidechain‟s capacity to speed up the circulation of money by shortening block validation times and to an enhancement in the scalability of Proof of Work and then in the Bitcoin payment services.
Figure 3 The frequency domain causality between Bitcoin price and exchange trade ratio Period 1 : Before the introduction of sidechain Period 2 : After the introduction of sidechain
0 1 2 3 4 5 6 7 0 .01 0 .11 79 0 .22 58 0 .33 37 0 .44 17 0 .54 96 0 .65 75 0 .76 55 0 .87 34 0 .98 13 1 .08 93 1 .19 72 1 .30 51 1 .41 31 1 .52 10 1 .62 89 1 .73 86 1 .84 48 1 .95 27 2 .06 06 2 .16 86 2 .27 65 2 .38 44 2 .49 24 2 .60 03 2 .70 82 2 .81 62 2 .92 41 3 .01 20
BTR does not Granger-cause ETR BC critical values F-statistic values Frequency0 1 2 3 4 5 6 7 0. 0 1 0. 1 17 9 0. 2 25 8 0. 3 33 7 0. 4 41 7 0. 5 49 6 0. 6 57 5 0. 7 65 5 0. 8 73 4 0. 9 81 3 1. 0 89 3 1. 1 97 2 1. 3 05 1 1. 4 13 1 1. 5 21 0 1. 6 28 9 1. 7 38 6 1. 8 44 8 1. 9 52 7 2. 0 60 6 2. 1 68 6 2. 2 76 5 2. 3 84 4 2. 4 92 4 2. 6 00 3 2. 7 08 2 2. 8 16 2 2. 9 24 1 3. 0 32 0
BTR does not Granger-cause ETR BC critical values
F-statistic values
Frequency
Notes: The horizontal line (in blue) represents the 5.99% critical value of the null hypothesis test of no Granger causality at frequency w.
4.4.Energy use of Bitcoin
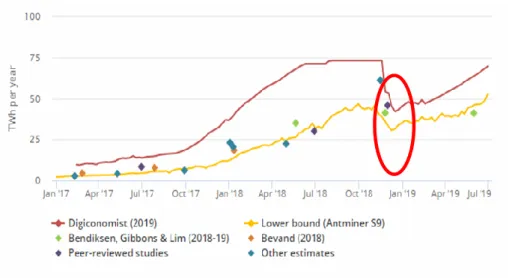
Some previous studies indicated that the Bitcoin‟s electricity consumption is likely to be large-ranging, about 20-80 TWh annually, or approximately 0.1-0.3% of the global electricity usage (see, for instance, Bendiksen et al. 2018; Bevand, 2018; De Vries, 2018; Digiconomist, 2019; among others). The increasing Bitcoin‟s price, especially in December 2017, rises the hash rate and difficulty, and pushes the development and deployment of more powerful and energy efficient mining hardware. From these analyses (see Figure 1), we clearly note that since the trustless construction for proof-of-work sidechain on October 2018, the Bitcoin energy use collapse, but such a decline seems short-lived.
2
Recall that the frequency
(
)
on the horizontal axis can be translated into a cycle or periodicity of T days by)
/
2
(
T
, T is the period. ] 03 . 3 ; 38 . 2 [ 16
Figure 4. Bitcoin energy use estimates
Source: International Energy Agency (IEA); https://www.iea.org/newsroom/news/2019/july/bitcoin-energy-use-mined-the-gap.html
Throughout the rest of our analysis, we check the consistency of these results by testing the causal relationship between Bitcoin mining and Bitcoin energy use. Figure 5 contains the test statistics with their 5.99 percent critical values (blue line) over the interval [0, π]. We try to evaluate whether Bitcoin mining proxied by the hash rate Granger-cause Bitcoin energy consumption, and whether this
causality is affected by the implementation of sidechain across different frequencies. We provide
evidence of short-run predictability for the first period, corresponding to cyclical components with wave lengths inferior to 2.27 corresponding to 83 days. For Period 2, the causality running from Bitcoin mining to Bitcoin energy consumption vanishes but moderately for wave length of less than 2.49 corresponding to 76 days.
Figure 5. The frequency domain causality between Bitcoin mining and Bitcoin energy consumption Period 1 : Before the introduction of sidechain Period 2 : After the introduction of sidechain
0 1 2 3 4 5 6 7 8 9 0 .01 0 .11 79 0 .22 58 0 .33 37 0 .44 17 0 .54 69 0 .65 75 0 .76 55 0 .87 34 0 .98 13 1 .08 93 1 .19 72 1 .30 51 1 .41 31 1 .52 10 1 .62 89 1 .73 86 1 .84 48 1 .95 27 2 .06 06 2 .16 86 2 .27 65 2 .38 44 2 .49 24 2 .60 03 2 .70 82 2 .81 62 2 .92 41 3 .03 20
HR does not Granger-cause BECI BC critical values Frequency0 1 2 3 4 5 6 7 8 9 0. 0 1 0. 1 17 9 0. 2 25 8 0. 3 33 7 0. 4 41 7 0. 5 49 6 0. 6 57 5 0. 7 65 5 0. 8 73 4 0. 9 81 3 1. 0 89 3 1. 1 97 2 1. 3 05 1 1. 4 13 1 1. 5 21 0 1. 6 28 9 1. 7 38 6 1. 8 44 8 1. 9 52 7 2. 0 60 6 2. 1 68 6 2. 2 76 5 2. 3 84 4 2. 4 92 4 2. 6 00 3 2. 7 08 2 2. 8 16 2 2. 9 24 1 3. 0 32 0
HR does not Granger-cause BECI BC critical values
F-statistic values
Frequency
Notes: The horizontal line (in blue) represents the 5.99% critical value of the null hypothesis test of no Granger causality at frequency w.
17
4.5.Portfolio risk management
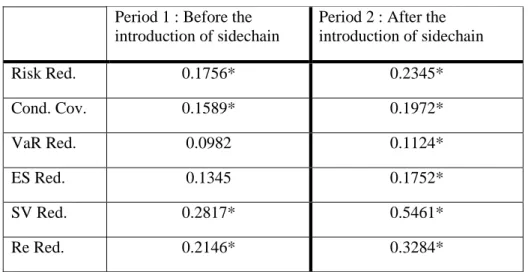
Table 7 reports the risk evaluation findings at the 99% confidence level for Bitcoin and S&P500 stocks3 in order to underscore if the introduction of sidechain improves the performance of Bitcoin as a diversifier. Our findings, firstly, indicate that the risk reduction measure reveals that the weighted portfolio II can help investors reduce risk much more than the portfolio I composed only by stocks. In particular, the introduction of Bitcoin in the S&P500 stock portfolio, market participants reach a more pronounced risk reduction especially for the period following the implementation of sidechain. Second, the conditional coverage test implies that the portfolio composed of Bitcoin and stocks perform well with respect the VaR, since the null of correct conditional coverage cannot be rejected at the 5% significance level. This holds for the two periods under study. Third, for period 2, we find no evidence of expected loss (ES) for the portfolio including stocks and Bitcoin. As far as SV and RE are concerned, portfolio II provides a high risk reduction. Summing up, the results derived from all the considered risk measures underpin that the diversified portfolio II is likely to perform better than portfolio I, particularly for the second period. This implies that sidechain enhances the diversification ability of Bitcoin. This result is not surprising. The sidechain technology provides a more secure, rapid and confidential way to transfer Bitcoin. This would undoubtedly plays a significant impact in reducing the volatility of Bitcoin, and in turn induces to a less risky Bitcoin.
Table 7. Risk evaluation for Bitcoin and S&P500 stocks portfolios Period 1 : Before the
introduction of sidechain
Period 2 : After the introduction of sidechain Risk Red. 0.1756* 0.2345* Cond. Cov. 0.1589* 0.1972* VaR Red. 0.0982 0.1124* ES Red. 0.1345 0.1752* SV Red. 0.2817* 0.5461* Re Red. 0.2146* 0.3284*
Notes: This table displays the risk evaluation outcomes for portfolios composed of Bitcoin and S&P500 stocks compared to a portfolio composed only of S&P500 stocks. Risk Red indicates the risk effectiveness ratio; Cond cov indicates the P values for the conditional coverage test; VaR. Red is the reduction in the value-at-risk portfolio II with portfolio I. Similarly, ES Red., SV Red. and Re Red indicate, respectively, a reduction in expected shortfall, semivariance and regret; *: indicates significance at the 5% level.
4.6.Robustness checks
We now investigate how various econometric specifications and data may change our estimates. We first assess the robustness of our findings in terms of the persistence of volatility, we use an optimal GARCH model determined via the Akaike information criterion. Based on this criterion, the best GARCH extensions chosen to capture the volatility of Bitcoin is the Threshold GARCH model for the period 1 and the Exponential GARCH model for the period 24. The
3
The S&P 500 stock market index incorporates 505 common stocks issued by 500 large-cap companies and traded on American stock exchanges, and covers nearly 80 percent of the American stock market by capitalization.
4
18
GARCH developed by Zakoin (1994) accommodates structural breaks in volatility. It allows describing the regime shifts in the volatility, denoted as:
(22) where , , and are the parameters to estimate.
The Exponential- GARCH introduced by Nelson (1991) contributes to the standard GARCH model by allowing to control for asymmetry. This model specified the conditional variance in a logarithmic form:
(23)
where , , , are the parameters to estimate, and ztthe standardized value.
The volatility parameters derived from the optimal GARCH models are reported in Table 4. We show that the volatility persistence appears much more pronounced for Period 1 prior to the implementation of sidechain rather than Period 2, consistently with GARCH-jump model outcomes (see Table 3). Even though Bitcoin seems to be more reactive to bad news in Period 1 (negative leverage effect) it becomes relatively more responsive to good news over Period 2 (negative leverage effect).
Table 4. Bitcoin price dynamics: Estimation output of the optimal GARCH model Period 1 : Before the
introduction of sidechain
Period 2 : After the introduction of sidechain Dependent variable: rt Mean equation 3.0781*** (0.0000) 4.1532** (0.0045) rt-1 0.1876*** (0.0000) 0.2342* (0.0112) Variance equation 0.018 (0.1467) -0.111*** (0.0000) 0.5452*** (0.0000) 0.131** (0.0089) 0.2183 (0.1349) 0.411*** (0.0000) 0.2049** (0.0067) -0.003* (0.0167)
The duration of persistence: 0.85 0.54
The leverage effect: 0.114 0.153
Notes: ***, ** and * imply significance at the 1%, 5% and 10%, respectively; rt: the Bitcoin returns at date t; r t-1: the lagged
Bitcoin returns. : the reaction of conditional variance; α: the ARCH effect; β: the GARCH effect; : the leverage effect.
p i j t j q i i t i i t i t 1 1 _ 2 ) ( i j
p i j t j i t i q i i t i t z z 1 2 1 2 ) log( )) / 2 ( ( ) log( i j
C
0
,
5
19
We re-run also the frequency-domain causality tests for the relationship between Bitcoin price and the exchange-trade ratio while accounting for potential control variables including Bitcoin velocity, gold price and economic policy uncertainty and the implied volatility index (i.e., conditional data analysis). Similarly, for the causality running from Bitcoin mining to Bitcoin energy use, we re-conduct the same exercise while considering the cost of per transaction as a determinant of the difficulty in Bitcoin mining. To test the sensitivity of the impact of sidechain on Bitcoin diversification and downside risk opportunities, we consider further portfolios, Portfolio III composed of Bitcoin and U.S. bonds and Portfolio IV composed of Bitcoin and one commodity (in particular, Oil). Our results are still fairly robust. We usually find that the introduction of sidechain mitigates the volatility of Bitcoin, improves its transaction and diversification abilities. To keep the simplicity and the clarity of our presentation, the results are available for interested readers upon request.
5.
Conclusions
The present research is the first, to the best our knowledge, to examine the properties of
Bitcoin with respect
volatility, speculation, efficiency and its usefulness as a transaction toolprior
to and post-the introduction of sidechains.
Using different econometric tools, our results reveal that Bitcoin behaves distinctly after the introduction of sidechain with regard its volatility, its efficiency, its multifractal and speculative bahaviors and its use in transactions. It is shown that after the introduction of sidechains a) Bitcoin appear less volatile, less persistent and relatively more responsive to good news, b) the Bitcoin market has more pronounced predictability power during downward periods than upward periods; c) the usefulness of Bitcoin as a transaction tool increases even moderately.Some potential elements have been advanced to explain the declining volatility and the improvement in the predictability power and the Bitcoin use in transactions. First, sidechains allow a reduction in the volatility of cryptocurrencies, with large extent Bitcoin. One of the most specific characteristics of cryptocurrency market is. the juxtaposition of the certainty of supply and the uncertainty of demand. The supply of these cryptocurrencies, like the Bitcoin, is programmed to grow along a pre-determined path. Conversely, the demand of such cryptocurrencies is volatile and subject to shocks. A shock to money demand combined with fixed money supply makes the purchasing power of cryptocurrencies based on the blockchain technology highly volatile. An inelastic supply with a volatile demand reinforces the instability of cryptocurrencies blockchain based (Sanchez, 2016). Moreover, the predetermined pace in a blockchain of tokens creation promotes speculation. The exchange-rate of Bitcoin relies strongly on the volume of transactions in bitcoins which is some way an expression of the demand (Hueber, 2018). First, the introduction of a sidechain pegged to a parent blockchain (like the Bitcoin blockchain) can stabilize the volume of transaction and into de facto the volatility of the internal value of the Bitcoin. Furthermore, introducing a demurrage mechanism into the sidechain can contribute significantly to a decrease of the volatility of the cryptocurrency of the parent chain. The implementation of a demurrage device on the main chain improves the buy / sell relationships within the network of the sidechain. (Hueber, 2019). Second, sidechains reduce inflationary pressures. In addition to its propensity for stability, the sidechain is not subject to inflationary pressures unlike what happens on the Bitcoin system. Third, sidechains significantly shorten the time required to certify e-money transactions. Fourth, one of major advantages of sidechain is to attain a certain level of decentralisation. The latter improves the network security, since it is not easier to carry out a hacker attack on a decentralized solution. The fact that the causality from Bitcoin mining to Bitcoin energy consumption collapses implies that sidechain liquid network lead to a less energy intensive and in turn less polluting Bitcoin system. But the moderately vanishing
20
causality means also that the concentration of miners is still follow available electrical supply. Overall, Bitcoin mining remains to be centralized in locations with high electrical supply. It must be added at this stage that a sidechain can process a large number of transactions without affecting the decentralization of the parent chain. Far less energy-consuming than the parent chain, a sidechain de facto reduces transaction costs. Last but not least, the Value-at-Risk approach to risk management is conducted, providing improved usefulness of Bitcoin in expanded stocks portfolio with the introduction of sidechain, in terms of diversification opportunities and downside risk reductions.
The sidechain‟s technology is constantly evolving but such a technology still pursues the same objectives of safety, stability, speed of circulation without compromising the parent chain.
References
Back, A.: Announcing sidechain elements: Open source code and developer sidechains for advancing bitcoin (2015), Blockstream blog post, Available at:
https://blockstream.com/2015/06/08/714/
Bariviera, A.F., (2017) “The Inefficiency of Bitcoin Revisited: A Dynamic Approach.” Economics Letters 161, 1-4.
Bendiksen, C., Gibbons, S. and Eugene, L., (2018) “The Bitcoin Mining Network”, Available at: https://coinshares.co.uk/research/bitcoin-mining-network-november-2018.
Bevand, M., (2017) “Electricity consumption of Bitcoin: a market-based and technical analysis”, in mrb‟s blog, Available at: http://blog.zorinaq.com/bitcoin-electricity-consumption/
Böhme, R., Christin, N., Edelman, B. G. and Moore, T., (2015) „Bitcoin: Economics, Technology, and Governance.‟ Journal of Economic Perspectives 29 (2).
Bouoiyour, J., Selmi, R. and Tiwari, A-K., (2015) “Is Bitcoin business income or speculative foolery? New ideas through an improved frequency domain analysis.” Annals of Financial Economics 10(1), 1-23. DOI: 10.1142/S2010495215500025
Bouoiyour, J., Selmi, R., Wohar, M., (2018) “Measuring the response of gold prices to uncertainty: An analysis beyond the mean.” Economic Modelling 75(C), 105-116.
Bouoiyour, J., Selmi, R., (2019) “Should Bitcoin be used to help devastated economies? Evidence from Greece.” Economics Bulletin 39(1), 513-520.
Breitung, J., and Candelon, B., (2006) “Testing for short and long-run causality: a frequency domain approach.” Journal of Econometrics 132, 363-378.
Buchholz, M, Delaney, J, Warren, J, and Parker, J, (2012) “Bits and Bets, Information, Price Volatility, and Demand for Bitcoin.” Economics 312. Available at: http://www.bitcointrading.com/pdf/bitsandbets.pdf
Cajueiro, D. O., Tabak, B. M., (2005) “Testing for time-varying long-range dependence in volatility for emerging markets.” Physica A: Statistical Mechanics and its Applications 346(3), 577-588.
21
Danthine, J.-P., (1977) “Martingale, market efficiency and commodity prices.” European Economic Review 10, 1–17.
De Vries, A., (2018) “Bitcoin‟s Growing Energy Problem”, DOI: https://doi.org/10.1016/j.joule.2018.04.016
Fama, E., (1970) “Efficient Capital Markets: A Review of Theory and Empirical Work.” Journal of Finance 25, 383–417.
Geweke, J. (1982), “Measurement of linear dependence and feedback between multiple time series.” Journal of American Statistical Association 77, 304-324.
Granger, C.W.J. (1969), “Investigation causal relations by econometric models and cross-spectral methods.” Econometrica 37, 424-438.
He, S., and Wang, Y., (2017) “Revisiting the multifractality in stock returns and its modeling implications.” Physica A: Statistical Mechanics and its Applications 467, 11-20.
Hueber, O., (2018) “The Blockchain and the sidechain innovations for the electronic commerce beyond the Bitcoin's framework”, International Journal of Transitions and Innovation Systems, Vol 6, Issue 1, 88–102
Hueber, O., (2019) “Sidechain and Volatility of cryptocurrencies based on the block-chain technology” International Journal of Community Currency Research 23 Issue 2 (Summer 2019) 35-44 Koutsoyiannis, A., (1983) “A short-run pricing model for a speculative asset, tetest with data from the gold bullion market.” Applied Economics 15, 563–581.
Kwapień, J., Oświęcimka P., and Drożdż, S., (2005) “Components of multifractality in high-frequency stock returns.” Physica A 355, 466–474.
Lütkepohl, H. (2006), “Structural vector autoregressive analysis for cointegrated variables.” AStA Advances in Statistical Analysis, 90, 75-88.
Maheu, J. M., McCurdy, T. H., (2004). “News Arrival, Jump Dynamics, and Volatility Components for Individual Stock Returns.” The Journal of Finance 59 (2), 755-793.
Merkle R.C., (1987) “A digital signature based on a conventional encryption function,” in Advances in Cryptology - CRYPTO ‟87, A Conference on the Theory and Applications of Cryptographic Techniques, Santa Barbara, California, USA, August 16-20, 1987, Proceedings, 369– 378.
Mora, C., Rollins, R.L., Taladay, K., Kantar, M.B., Chock, M.K., Shimada, M. and Franklin, E.C., (2018). “Bitcoin emissions alone could push global warming above 2°C.” Nature Climate Change 8, 931–933.
Möser, M. Böhme, R., and Breuker D., (2013) “An inquiry into money laundering tools in the Bitcoin ecosystem.” 2013 APWG eCrime Researchers Summit.‟ Available at : https://ieeexplore.ieee.org/document/6805780
Nelson, D.B., (1991) “Conditional heteroskedasticity in asset returns: a new approach.” Econometrica 59.