Author
Philip L. WylieAgilent Technologies, Inc. 2850 Centerville Road Wilmington, DE 19808-1610 USA
Abstract
Large-volume injection (LVI) using the
Agilent programmable temperature
vaporizing (PTV) inlet can improve gas
chromatography system detection
limits by one to two orders of
magni-tude over standard methods that call
for 1- or 2-
mmmm
L injections. An Agilent
6890 Series gas chromatograph (GC),
configured with a PTV inlet, a 6890
Series automatic liquid sampler (ALS),
and an Agilent 5973 mass selective
detector (MSD), was used for the
analy-sis of pesticides in standards and
sev-eral food extracts. By making 100-
mmmm
L
injections, several pesticides could be
identified by scanning gas
chromatogra-phy/mass spectrometry (GC/MS) at the
100 ppt (100 ng/L) level. The PTV inlet
tolerated dirty food extracts very well;
Trace Level Pesticide Analysis by GC/MS Using
Large-Volume Injection
were injected into a single PTV liner.
This application note includes
recom-mendations for doing LVI using the
PTV/6890/5973 GC/MSD system.
Introduction
More than 700 pesticides are regis-tered for use in the world1, and many
more continue to persist in the envi-ronment, even though they are no longer being applied. For the protec-tion of human health and the environ-ment, pesticide residues are routinely monitored in food, water, soil, and tissue samples. "Acceptable" residue limits have been set for various foods and environmental samples by agen-cies such as the United States Environmental Protection Agency (U.S. EPA), the Codex Alimentarius Commission2, and many other
governmental organizations around the world. A great many methods have been developed to screen for pesticides in food3-7and the
environ-ment8-10to ensure that risks
associ-ated with pesticide use are minimized.
Recently, concern has increased that certain pesticides and other synthetic chemicals may be acting as pseudo hormones which disrupt the normal function of the endocrine system in wildlife and humans. Birth defects, behavioral changes, breast cancer, lowered sperm counts, and reduced intelligence are among the many dis-orders that have been blamed on these "endocrine disrupting" com-pounds, though much research must be done to verify these assertions. In 1996, Colborn, Domanoski, and Myers11brought these issues into the
public spotlight with the publication of their book Our Stolen Future. Recently, the United States Congress passed legislation calling for increased testing of suspected endocrine disrupters and monitoring their levels in food12and water13
sup-plies. Because the endocrine system can be exquisitely sensitive to extremely low hormone concentra-tions, there is a need to measure con-centrations of suspected endocrine disrupters (many of which are pesti-cides) at very low levels. Initiatives such as the Pesticide Data Program, developed by the United States
Application
Gas Chromatography
September 1997
determine the lowest measurable pes-ticide levels in various foods to develop a total exposure model. Clearly, there is pressure to push pes-ticide detection limits to even lower levels than are routinely achieved today. Most residue measurements are made by gas chromatography using a variety of element-selective or mass spectral detectors (GC/MS). Therefore, to achieve lower detection limits, it is necessary to improve the detection limits of these GC methods. In GC, there are primarily four ways to improve method detection limits: 1) increase the concentration of ana-lytes in a sample, usually by reducing the volume of an extract; 2) increase the sensitivity of the detector; 3) increase the selectivity of the detec-tor to reduce chemical background "noise" or 4) increase the volume of sample injected. Because GC/ MS can be highly selective and extremely sen-sitive, it is often the method of choice for pesticide analysis and/or confir-mation. However, for the reasons dis-cussed above, there are occasions when even greater sensitivity is required. This application note describes a method for increasing GC/MS system detection limits by making large-volume injections (LVI) using Agilent's new programmable temperature vaporizing (PTV) inlet. Because this LVI technique is detec-tor-independent, it is applicable to other GC configurations that may be used for pesticide residue analysis.
Experimental
Pesticide Standard Solution
Stock solutions of 14 pesticides were prepared at 1 mg/mL by adding 10 mg each of trifluralin, hexachloroben-zene, pentachloronitrobenhexachloroben-zene, dichloran, chlorothalonil, chlorpyri-fosmethyl, chlorpyrifos, endosulfan
I, p,p'-DDE, propargite, iprodione, methoxychlor, and fenvalerate (mix of isomers I and II) to individual 20mL vials and diluting with 10.0 mL of acetone. Permethrin was obtained as a mixture of permethrin I and per-methrin II comprising 32 percent and 27 percent of the sample, respec-tively, so 16.95 mg of this mixture was diluted with 10 mL of acetone giving a solution in which the combined per-methrins represented 1 mg/mL. A stock mixture was prepared by adding 4 mL of the permethrin and fenvalerate solutions and 1 mL of each of the other stock solutions to a 100-mL volumetric flask and diluting to volume with acetone. The resultant solution contained 40 ng/mL each of the combined permethrin and
fen-valerate isomers and 10 ng/mL each of the other 12. This sample was diluted further with acetone to prepare standards that were analyzed by LVI. All these pesticides were obtained in neat form from Chem Service (West Chester, PA USA).
Extracts
Fruit and vegetable extracts were obtained from the Florida Depart-ment of Agriculture and Consumer Services (Tallahassee, FL USA). Com-modities were extracted using a ver-sion of the Luke procedure15-17that
gave a final sample representing 1.75 g of the commodity per mL of extract.
Table 1. Instrumentation and Conditions Used for Pesticide Samples GC/MS System
Gas chromatograph 6890 Series GC
Automatic liquid sampler 6890 Series ALS
Mass spectral detector 5973 Series MSD
Programmable temperature vaporizing inlet PTV with CO2cooling Computer for data acquisition and analysis HP Vectra XU 6/200
Software G1701AA Version A.03.00 running
Microsoft® Windows™ 95
Column 30 m x 0.25 mm x 0.25 mm Agilent HP-5MS
Instrumental Conditions GC Parameters
Carrier gas Helium
Inlet liner Prototype deactivated borosilicate with fritted glass on interior walls (part no. 5183-2041)
Syringe size 50 mL
Injection volume 100 mL (Inject 10 mL 10 times)
Injection delay 12 sec
Inlet temperature program 40 °C (4.2 min), 200 °C/min to 320 °C (2 min)
Vent flow 400 mL/min Vent pressure
0.0 psi for 4.00 min Purge flow to split vent 50.0 mL/min at 6.50 min
Column head pressure 0 psi (4 min) then 17.3 psi (constant pressure) Oven temperature program 50 °C (6.13 min), 30 °C/min to 150 °C (2 min), 3 °C/min
to 205 °C (0 min), 10 °C/min to 250 °C (20 min) MSD Parameters
Acquisition mode Scan (35-550 amu)
Temperatures Transfer line = 280 °C, MS quad = 150 °C, MS source = 230 °C
Instrumentation
Table 1 lists the instrumentation and chromatographic conditions used for LVI and GC/MS analysis of pesticide samples.
Brief PTV Tutorial
Before focusing on the PTV/GC/ MS analysis of pesticides, it is important to understand how the PTV inlet operates in the solvent vent mode for large-volume injections.
The PTV Inlet
The PTV inlet has the same basic functions as the split/ splitless inlet except that it is temperature program-mable from -60 °C (using CO2cooling) or -160 °C (using liquid N2cooling) to 450 °C at rates up to 720 °C/min. However, the PTV's design has been optimized for its main uses-LVI and cold split/splitless injection. Although hot split and splitless injections may be made with or without a pressure pulse, care must be taken not to exceed the small internal volume of the PTV inlet. In practice, it is best to choose the Agilent split/splitless inlet for hot injections and the PTV inlet for LVI and cold split/ splitless techniques.
Most GC pesticide methods call for injecting 1-2 mL; splitless injection is used because it is compatible with dirty extracts of food, soil, or water. Pulsed splitless injection allows one to make injections of up to 5 mL using standard equipment18. Enormous
gains in system sensitivity can be real-ized by using the PTV inlet in the "sol-vent "sol-vent" mode, which is compatible with injections of 5-1,000 mL. These large injections may be made manu-ally or automaticmanu-ally using either a standard 6890 Series ALS in the multi-ple injection mode or by using a con-trolled speed injector available from
manual injections are usually imprac-tical and good precision may be hard to achieve.
The 6890 Series ALS is designed to make one or more injections of up to 25 mL into the PTV inlet. After the desired number of injections has been made, the inlet is heated and the chromatography begins. Though the system controls allow up to 99 injec-tions, a reasonable upper limit is about 10, making 250 mL the typical injection volume limit for this system. For even larger injections, the con-trolled speed injector19should be
used. For all of the analyses described below, 100 mL were injected by making 10 sequential injections of 10 mL each.
How the PTV Works in the Solvent
Vent Mode
Figure 1 shows a diagram of the PTV inlet. For large-volume injections, three steps are required. These are: 1) injection and solvent elimination; 2) splitless sample transfer to the GC column; and 3) chromatographic separation and, if desired, a simulta-neous inlet bake-out step. The steps are described more completely below.
Injection and Solvent
Elimination (Step 1)
During injection, the column head pressure is set to 0 psi to eliminate or, in the case of GC/MS, reduce the flow through the column. When mass spec-tral detection is used, there is still
Septumless Sampling Head Carrier Gas Line
Coolant Liner Seal
Heating Coil
Glass Inlet Liner
Capillary Column
Split/Splitless Solenoid
Proportional Valve
Figure 1. The PTV inlet shown with the septumless head. The inlet is also available with a septum head that may be equipped with a standard septum or a Merlin Microseal. (Figure reproduced with permission of Gerstel GMBH.)
Normal
Inlet Flooding
Normal
Volatiles Lost
some flow because the column outlet is under vacuum. At the same time, a steady stream of carrier gas passes through the inlet and out through the split vent. This flow is typically between 100 and 500 mL/min. The sample is injected into the cool liner where it remains as a liquid, dis-persed over the liner walls or any packing material that may be in the liner. The steady flow of carrier gas through the liner causes the solvent (and any volatile fraction of the sample) to evaporate and be swept with the carrier gas out through the split vent. This is analogous to "blow-ing down" a sample with a stream of inert gas, except that this takes place inside the PTV inlet. When most of the solvent has evaporated, the next injection is made and the evaporation process repeats, accumulating more sample in the inlet. To recover an analyte completely, its boiling point should be at least 100 °C greater than that of the solvent; most pesticides fall into this category.
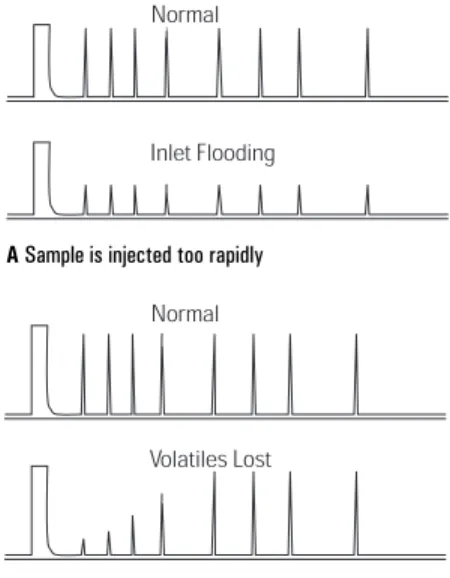
The timing of these multiple injec-tions can be important. If the sample is introduced too rapidly, the liner may become flooded and liquid will be forced out through the split vent. Chromatographically, this shows up as reduced area counts for all ana-lytes (see figure 2A). If there is too much time between injections, all of the solvent may evaporate and more of the volatile analyte fraction may be lost too. This results in poor recovery of volatiles but 100 percent recovery of the less volatile compounds (see figure 2B). Set-points such as inlet temperature, vent flow, and injection delay times can affect recovery of volatiles. Note that for 100 percent recovery, an analyte should have a boiling point at least 100 °C greater than the solvent. One can adjust the delay between injections by entering the desired value in the ChemStation software. Some experimentation is usually necessary when setting this delay for a new method. It will be dependent upon such factors as the solvent type, injection volume, vent flow, and inlet temperature.
Splitless Sample Transfer to the
GC Column (Step 2)
Once the desired number of injec-tions has been made, the column head pressure is restored and the vent flow is tur ned off. At this point, the inlet temperature is programmed up to a value that is sufficient to transfer all of the desired analytes to the GC column. This step is similar to
a splitless injection, except that instead of flash vaporization, the sample is transferred as the inlet tem-perature is programmed up. For the most gentle treatment of labile ana-lytes, slow ramp rates may be used. This allows analytes to be flushed into the column at the minimum tem-perature needed for volatilization. When sample decomposition is not a problem, the inlet may be heated as fast as 720 °C/min.
Chromatographic Separation (Step 3)
During sample transfer, the oven tem-perature is usually held between 30 °C below and 20 °C above the sol-vent's atmospheric boiling point, depending on whether the solvent effect is needed to focus the more volatile fraction of the analytes. Again, some experimentation is nec-essary to optimize peak shapes. After the sample has been transferred in step 2, the oven temperature is pro-grammed up and chromatography begins.After the inlet has reached its maxi-mum temperature and sufficient time has elapsed to transfer the sample to the column, a purge flow of 30-50 mL/min is restored to the split vent. If desired, one can set a very large split flow for a few minutes and bake out the inlet at a higher tempera-ture to remove nonvolatile impurities. To conserve carrier gas, gas saver should be turned on at the end of this bake-out step.
ASample is injected too rapidly
Figure 2. Chromatograms A and B illustrate the result of poor timing of multiple injections. BSolvent evaporates completely between injections
Entering PTV Inlet Parameters into the
Agilent ChemStation
When preparing the PTV portion of a GC method, one should first decide on the sample size and how many injections are required. In this work, ten 10-mL injections were made for a total of 100 mL. When entering para-meters into the ChemStation screen, the Injector icon is first selected (figure 3) under the "GC edit parame-ters" menu. Next, the Configure button is pressed to enter the syringe size and enable multiple injections. From the main injector screen, the injection volume (10 mL) and number of injections are entered10. For this
work, a 12-second delay was chosen between injections to allow for sol-vent evaporation.
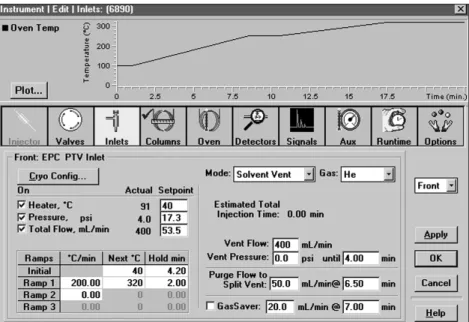
The estimated total injection time is listed on the Inlets screen (figure 4). This is helpful when setting the inlet and oven parameters. First, the vent flow rate (400 mL/min for these analy-ses) is chosen, which sets the vent pressure to 0 psi until the injection sequence is done and solvent from the last injection has largely evapo-rated (4.00 min in figure 4). This is done by entering these values in the following fields:
Vent Flow 400 mL/min Vent pressure 0.0 psi until 4.00 min
Next, the purge flow and elapsed time are set by entering values in the fol-lowing field:
Purge Flow to Split Vent 50.0 mL/min @ 6.50 min
Note that as an aid in setting up the method, the "estimated total injection time" is shown just above the previ-ous data entry fields.
In this example, the normal column head pressure was restored and the vent flow was turned off at 4.00 min. This prepares the inlet for the split-less transfer of the sample to the column. The vent flow remained off until it was set to 50 mL/min at 6.5 min. Thus, there is a 2.5-min period for inlet temperature
programming and splitless sample transfer to the column. In this exam-ple, the inlet was held at 40 oC for
4.2 min, enough time to make 10 injections, turn off the purge flow, and restore the column head pres-sure; the PTV was then programmed to 320 oC at 200 oC/min (figure 4).
Figure 3. The injector screen from Agilent GC and GC/MS ChemStation software showing the setpoints available for multiple injections. To configure the sampler for multi-ple injections, set the syringe size, and choose slow injection, click on the Configure button.
Figure 4. The inlets screen from Agilent GC and GC/MS ChemStation software showing the setpoints available for operation of the PTV inlet in the solvent vent mode.
Although not done for these analyses, the inlet could be baked out by set-ting the "purge flow to split vent" to a large value (perhaps 500 mL/min) at the end of the splitless time (6.50 min) and at the same time, pro-gram the inlet to a higher tempera-ture. After the bake-out period, the inlet temperature is programmed downward and gas saver is turned on. Normally, the GC oven is held at its starting temperature until the splitless injection is complete (6.50 min in this case) at which time oven temperature programming is begun. For this work, the oven temperature program was begun at 6.13 min so that the pesti-cide retention times would match a retention time data base that was in use. Figure 5 diagrams the PTV and GC oven setpoints used for this work.
PTV Inlet Liner Considerations
The correct liner choice is critical to the success of any pesticide analysis by PTV injection. The liner must be thoroughly deactivated or many labile pesticides may decompose or adsorb in the inlet. In general, any liner con-taining glass wool will be unsatisfac-tory for the analysis of labile pesticides, whether or not the glass wool is deactivated. At this time, two PTV liners are suggested for pesticide analysis:• Part no. 5183-2037 is a deacti-vated, open multibaffled liner with no internal packing that may be used for single or multiple injec-tions of 5 mL or less. This liner gives very good recovery for pesti-cides, even extremely difficult ones such as acephate and methamidophos.
• Part no. 5183-2041 is a deactivated liner with an internal coating of sintered glass to give it more sur-face area and is, therefore, suit-able for single or multiple 25-mL injections. This liner gives better than 70 percent recovery for most pesticides, although tests have shown that acephate and methamidophos cannot be ana-lyzed using this liner, and that recoveries of guthion are often less than 50 percent. A prototype version of this liner was used for all of the work described in this application note. Multiple injections
}
12 sec injection delay PTV purge flowColumn head pressure
400 mL/min 4.00 min 0 psi 4.00 min 40°C 4.20 min 6.13 min 0 mL/min 50 mL/min 6.50 min 280°C 200°C/min PTV temperature Oven temperature 30 °C/min 50°C n
Figure 5. Illustration of the GC and sampler setpoints used for 100-mmmmL injections of pesticide samples. Note that normally, the GC oven hold period would have been at least 6.5 min for this method. A value of 6.13 min pesticide retention times to a data base.
Results and Discussion
When compared to a typical 2-µL splitless injection, 100-mL PTV injec-tions can often result in a 50-fold improvement in system detection limits. Selective detectors such as the MSD can help the analyst to realize the full measure of this sensitivity improvement by excluding back-ground that may be introduced from solvent impurities, vial cap extract, and indigenous compounds coex-tracted with the analytes. In this application, it was possible to see most of the pesticides in the 14-component mixture at 100 ppt in the scan mode (400 ppt for the isomer mixes of permethrin and fenvalerate). Figure 6 shows extracted ion chromatograms for trifluralin and hexachlorobenzene (HCB) at 100 ppt. Library searching gave a match quality of 93 for the HCB peak. Fenvalerate isomers I and II were found in the solution in a ratio of about 78:22. Figure 7 shows extracted ion chromatograms for fenvalerate I at a concentration of 311 ppt. Trifluralin (100 ppt) m/z 306 m/z 264 Hexachlorobenzene (100 ppt) Match quality = 93Extracted ions 284, 286, and 282
Fenvalerate I (311 ppt) m/z 167
m/z 125
m/z 225
A Extracted ion current chromatograms of trifluralin
Figure 6. Scanning GC/MS results for a pesticide standard containing Trifluralin and Hexa-chlorobenzene at 100 ppt. (Ten 10-mmmmL injections were made using the PTV inlet.)
Figure 7. Extracted ion current chromatograms of Fenvalerate I at a concentration of 311 ppt in a pesticide standard. (Ten 10-mmmmL injections were made using the PTV inlet.)
Analysis of a bell pepper extract revealed several pesticide residues. As seen in figure 8, chlorpyrifos and the endosulfans were easily detected. The Florida Department of Agricul-ture determined the concentration of chlorpyrifos, alpha-endosulfan, betaendosulfan, and endosulfansul-fate to be 0.210, 0.011, 0.018, and 0.013 ppm, respectively. It is impor-tant to note that these compounds could be detected with very high selectivity by extracting high mass ions that are characteristic of these pesticides but not of the matrix. Using LVI, there is ample signal from these less abundant ions for good quantitation. With normal injection volumes, selectivity may have to be compromised and the most abundant ions extracted in a pesticide spectrum to gain sensitivity.
Phosmet, captan, and propoxur were all easily detected in a pear sample. The total ion current chromatogram (TIC) is shown in figure 9 along with spectrum obtained for captan juxta-posed with the library spectrum. Figure 10 shows the propoxur peak along with 2,4,6-tribromoanisole and 2,4,6-tribromophenol, two other com-pounds that were surprising to find in a pear sample. Though the origin of these brominated compounds is not known, a recent paper by Hoffmann and Sponholz 20 suggests that tribro-mophenol is used to treat storage palettes for the prevention of fire and mold growth, and that the anisole is formed from the phenol microbiologi-cally. Perhaps these pears were shipped in containers that had been similarly treated.
Figure 8. GC/MS Analysis of a bell pepper extract. (Ten 10-mmmmL injections were made using the PTV inlet.) Using LVI, there was sufficient signal to use high mass ions with smaller abundances to achieve greater selectivity.
Figure 9. TIC of a pear extract resulting from a 100-mmmmL Injection (10 x 10 mmmmL). Captan was easily detected, and its spectrum gave a library match quality of 96.
A single sintered glass coated liner of the type described above (part no. 5183-2041) was used for about ten 50- and ten 100-mL injections (ca. 1,500 mL total) of vegetable extracts before it was replaced. All of the extracts were rather dirty, and an inlet bake-out step was not used. Although the liner looked somewhat discolored for about 2 cm where injections were made, it still per-formed well at the time it was replaced.
Conclusion
Using the PTV inlet in the solvent vent mode, it is relatively simple to increase system detection limits by one or two orders of magnitude. When combined with the Agilent 6890 Series automatic liquid sampler,
multiple injections of up to 25 mL each into the inlet can be made, allowing the solvent to vent while pesticides and other less volatile ana-lytes accumulate. After the desired sample volume has been introduced (typically 5-250 mL), the solvent vent is closed and the sample is transferred to the column in a temperature-programmed splitless injection. By making 100-mL injections into a PTV-equipped Agilent 6890 Series GC coupled to the Agilent 5973 MSD, it was possible to see several pesticides at the 100 ng/L level (100 ppt) in the scan mode. With such low detection limits, less abundant ions can be used to identify and quan-titate pesticides at low ppb levels, thereby gaining in selectivity as well.
When performing LVI, there are sev-eral parameters to adjust and some method development time is usually required. However, the method described herein worked well and can be duplicated for the PTV/GC/MS analysis of pesticides in food.
Acknowledgment
The author wishes to thank Ms. Joanne Cook of the Florida Depart-ment of Agriculture and Consumer Services for supplying the food extracts used in these experiments and Dr. Bill Wilson (Agilent Technologies) for supplying liner deactivation test results.
Figure 10. TIC of a pear extract resulting from a 100-mmmmL Injection (10 x 10 mmmmL). Propoxur and two brominated phenolics were easily identified.
Agilent shall not be liable for errors contained herein or for incidental or consequential damages in connection with the furnishing, performance, or use of this material.
Information, descriptions, and specifications in this publication are subject to change without notice.
Microsoft is a U.S. registered trademark and Windows ™ is a U.S. trademark of Microsoft Corporation.
HP®is a registered trademark of Hewlett-Packard Company.
Copyright© 2000 Agilent Technologies, Inc. Printed in the USA 4/2000 5966-1214E
References
1. Tomlin, Clive, ed (1994), The Pes-ticide Manual, Tenth Edition, British Crop Protection Council, Surry, UK.
2. Miller, R. W., This is Codex Alimentarius, Secretariat of the Joint FAO/WHO Food Standards Programme, Food and Agriculture Organization of the United Nations, Rome.
3. McMahon, B. M. and Hardin, N. F. eds. (1994), Pesticide Analytical Manual, Vol I, Third Edition, U.S. Food and Drug Administra-tion, Washington, DC.
4. Lee, S. M., Papathakis, M. L., Feng, H.-M. C., Hunter, G. G., and Carr, J. E. (1991), Fresenius' A. Anal Chem339, 376-383.
5 Fillion, J., Hindle, R., Lacroix, M., and Selwyn, J. (1995), J AOAC Int78, 1252-1266.
6. Working Group on Development and Improvement of Residue-analytical Methods (1996), Analytical Methods for Pesticide Residues in Food-stuffs, General Inspectorate for Health Protec-tion, Ministry of Public Health, Welfare & Sport, The Netherlands.
7. Luke, M. A., Froberg, J. E., Doose, G. M., Masumoto, H. T. (1981),
J Assoc Off Anal Chem64, 1187-1195.
8. Stan, H. J., ed. (1995), Analysis of Pesticides in Ground and Surface Water II, Springer-Verlag, Berlin, Germany. 9. Wagner, R. E., Kotas, W., and
Yogis, G. A., eds. (1994), Guide to Environmental Analytical Meth-ods, 2nd EditionGenium, Schenectady, NY.
10. U.S. Environmental Protection Agency, Test Methods for Evalu-ating Solid Waste, SW-846, Draft Method 8085: Pesticides by GC/AED.
11. Colborn, T., Dumanoski, D., and Myers, J. P. (1996), Our Stolen Future, Penguin, New York, NY. 12.Food Quality Protection Act of
1996, Public Law 104-170, Con-gressional Record pp.
H8127-H8141.
13.Safe Drinking Water Act Amend-ments of 1996, Public Law 104-182, Congressional Record pp. H9680-H9700.
14.Pesticide Data Program Annual Summary Calendar Year 1994, U.S. Department of Agriculture, Agricultural Marketing Service, Washington, DC.
15. Luke, M. A., Froberg, J. E., Doose, G. M., and Masumoto, H. T. (1981), J Assoc Off Anal Chem64, 1187-1195.
16. Luke, M. A., and Doose, G. M. (1983), Bull Environ Contamin Toxicol 30, 110-116.
17. Sawyer, L. D. (1985), J Assoc Off Anal Chem68, 64-71.
18. Wylie, P. L., Phillips, R. J., Klein, K. J., Thompson, M. Q., and Hermann, B. W. (1991), J High Resol Chromatog 14, 649-655. 19. The controlled speed injector is
available from Gerstel US, 1510 Caton Center Dr., Baltimore, MD 21227 USA.
20. Hoffmann, A. and Sponholz, W. (March 1997), American Labora-tory, 22-23.