Development of an Upgrade Selection
Process for Railway Renewal Projects
by
Xindi Chen A thesis submitted to
The University of Birmingham for the degree of
DOCTOR OF PHILOSOPHY
Department of Electronic, Electrical and Systems Engineering
School of Engineering
University of Birmingham
University of Birmingham Research Archive
e-theses repository
This unpublished thesis/dissertation is copyright of the author and/or third parties. The intellectual property rights of the author or third parties in respect of this work are as defined by The Copyright Designs and Patents Act 1988 or as modified by any successor legislation.
Any use made of information contained in this thesis/dissertation must be in accordance with that legislation and must be properly acknowledged. Further distribution or reproduction in any format is prohibited without the permission of the copyright holder.
i
Abstract
Improving a railway system can play a significant role in economic growth. Currently, many railway systems need to be upgraded to meet the demand for rapidly increasing railway capability, environmental concerns and customer satisfaction, while there is a lack of the right models and tools required to support the early decision making stage of railway renewal projects.
In this thesis, the existing decision-making methods and support models and existing performance measurement frameworks in use in the railway industry are reviewed. A new railway selection upgrade process is proposed, which aims to support early stage decision-making in railway renewal projects by finding the most appropriate solutions to take forward for more detailed consideration. The railway selection upgrade process consists of modelling, which includes data collection and model set-up, and simulation, split into macroscopic assessment and microscopic simulation. A high-level feasibility analysis model is developed for the macro assessment in the simulation stage, to help engineers efficiently select the most promising upgrade options for further detailed consideration using microscopic simulation. This process provides a quick and efficient way to quantify evaluation functions, based on the 4Cs (capacity, carbon, customer satisfaction and cost) framework, to give a final suggestion on the most appropriate upgrade options.
Two case studies, based on the East Coast Main Lines and the Northern Ireland railway network, are presented in order to demonstrate the application and verify the feasibility of the high-level feasibility analysis model and the railway upgrade selection process. The results show the advantages of the process on efficiently finding appropriate and systematically selected solutions for railway upgrade projects.
ii
Acknowledgements
First and foremost I am extremely grateful to my supervisors, Prof. Clive Roberts and Dr. Gemma Nicholson for their invaluable advice, continuous support, and patience during my PhD study. Their immense knowledge and plentiful experience have encouraged me in all the time of my academic research and daily life.
I would like to thank Prof. Felix Schmid for his kind support and advice on my research. I would also like thank Ms Menglei Lu and Dr. Ning Zhao for their technical support on my study.
I would like to thank all the members in the Birmingham Centre for Railway Research Education. It is their kind help and support that have made my study and life in UK a wonderful time.
As well, I would like to thank all of my friends for their support.
Finally, I would like to express my gratitude to my husband, my parents and my parents-in-law. Without their tremendous understanding and encouragement in the past few years, it would be impossible for me to complete my study.
iii
Table of Contents
Abstract ... i
Acknowledgements ... ii
Table of Contents ... iii
List of Figures ... vii
List of Tables ... ix
Glossary of Terms / List of Abbreviations ... xi
Chapter 1 Introduction ... 1
1.1 Introduction to railway systems in UK ... 1
1.1.1 Overview on current situation ... 1
1.1.2 Overview on the direction of future development ... 2
1.2 Decision-making in systems engineering ... 3
1.3 General research problem statement ... 7
1.4 Aims & objectives ... 9
1.5 Thesis structure ... 10
Chapter 2 Background ... 12
2.1 Railway systems architecture ... 12
2.1.1 Infrastructure ... 13
2.1.2 Rolling stock ... 17
2.1.3 Operations ... 19
2.2 Modelling & Simulation ... 20
2.2.1 Single-Train Simulator & Multi-Train Simulator ... 22
2.2.2 OpenTrack ... 24
iv 2.3.1 Capacity ... 27 2.3.2 Carbon ... 34 2.3.3 Customer satisfaction ... 38 2.3.4 Cost ... 40 2.3.5 Discussion ... 41 2.4 Summary ... 41
Chapter 3 Review of decision-making for railway renewal projects ... 43
3.1 Complex decision-making process ... 43
3.2 Decision-making problem identification ... 46
3.2.1 Research problem classification ... 48
3.3 Decision-making methods ... 49
3.3.1 Commonly-used decision-making methods ... 50
3.3.2 Problem-specific decision-making support models ... 54
3.4 Summary ... 58
Chapter 4 The railway upgrade selection process ... 59
4.1 Mathematical model ... 60
4.2 The structure of the railway upgrade selection process ... 64
4.2.1 Modelling ... 67
4.2.2 Simulation ... 68
4.2.3 Evaluation ... 94
4.3 Summary ... 94
Chapter 5 Design of the high-level feasibility analysis model ... 96
v
5.1.1 Introduction to the case study based on the East Coast main line ... 97
5.1.2 Preliminary verification of the high-level feasibility analysis model ... 100
5.1.3 Discussion ... 105
5.2 Further development of the high-level feasibility analysis model ... 106
5.2.1 Introduction to the case study based on Northern Ireland railway network 107 5.2.2 Further verification of the high-level feasibility analysis model ... 109
5.2.3 Discussion ... 113
5.3 Summary ... 114
Chapter 6 Application of the railway upgrade selection process ... 116
6.1 Introduction to the Northern Ireland railway network ... 116
6.2 The application of the railway upgrade selection process ... 118
6.2.1 Modelling ... 118
6.2.2 Simulation ... 122
6.2.3 Evaluation ... 133
6.3 Summary ... 137
Chapter 7 Conclusion & future work ... 139
7.1 General summary ... 139
7.2 Findings and contributions ... 140
7.2.1 The railway upgrade selection process ... 140
7.2.2 The high-level feasibility analysis model ... 142
7.3 Future work ... 143
vi
7.3.2 Further development of the railway upgrade selection process on practical
application ... 144
7.3.3 Further validation and verification ... 145
References ... 146
vii
List of Figures
Figure 1-1: Guide to Governance for Railway Investment Projects (GRIP) [28] ... 6
Figure 1-2: Cost influence, cost committed and cost incurred relationship curve against project phases [29] ... 7
Figure 2-1: Relationship between infrastructure, rolling stock and operation in an electrifiedrailway system [43] ... 13
Figure 2-2: Different signalling systems and headway ... 15
Figure 2-3: Relationship between micro and macro modelling and complex projects ... 21
Figure 2-4: Train graphs in STS ... 23
Figure 2-5: Main elements in OpenTrack [57] ... 24
Figure 2-6: An example model in OpenTrack ... 25
Figure 2-7: Blocking time of a block section [50] ... 30
Figure 2-8: Compression method on a double track line section (before (L) and after (R))[72] ... 33
Figure 2-9: Traction energy flow for diesel-electric and electric vehicles [81] ... 35
Figure 3-1: The decision-making process steps [97-100] ... 44
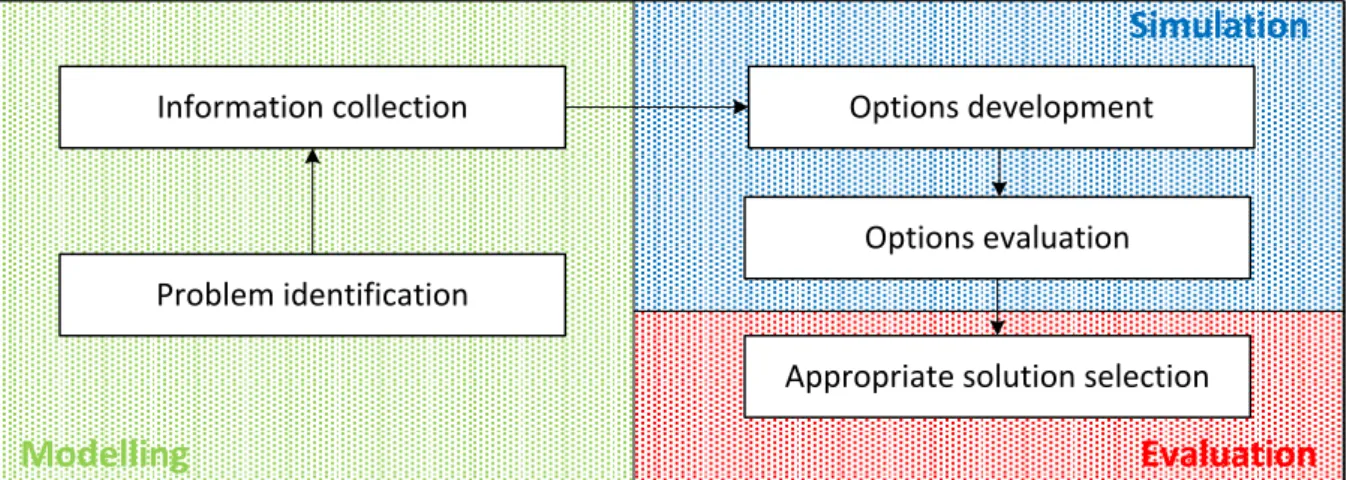
Figure 3-2: Framework of the decision-making process in the early stages of a project .... 45
viii
Figure 4-2: Example of the high-level feasibility analysis model ... 70
Figure 4-3: Full version of the high-level feasibility analysis model ... 71
Figure 4-4: Theoretical relationship between line speed and headway [146] ... 74
Figure 4-5: Impact of curve radius improvement on speed [121] ... 75
Figure 4-6: Heterogeneous (a) and homogeneous (b) timetable [154] ... 81
Figure 4-7: Example of impact assessment process in the HFAM ... 90
Figure 5-1: East coast main line geographic scope [123] ... 98
Figure 5-2: Simplified NIRN map for the investigation ... 108
Figure 6-1: Northern Ireland railway network ... 117
Figure 6-2: Northern Ireland railway network simulation area ... 119
Figure 6-3: Newry to Belfast Great Victoria Street train graph ... 121
Figure 6-4: Londonderry to Belfast Central train graph ... 122
Figure 6-5: Line sections of Main Lines A and B ... 125
Figure 6-6: Train graph of Line Section A3 (Down) ... 127
Figure 6-7: Train graph of Line Section B2 ... 128
ix
List of Tables
Table 4-1: Definitions of KPI function elements ... 86
Table 5-1: Information of two scenarios from Kings Cross to Peterborough ... 99
Table 5-2: 3Cs’ results of two scenarios in original conditions ... 99
Table 5-3: The HFAM results of energy and journey time on Scenario 1 ... 102
Table 5-4: The HFAM results of energy and journey time on Scenario 2 ... 102
Table 5-5: The HFAM results of capacity on Scenario 1/2 ... 103
Table 5-6: Impact results comparisons of scenario 1 ... 104
Table 5-7: Impact results comparisons of scenario 2 ... 104
Table 5-8: Capacity impact results comparisons of two scenarios ... 104
Table 5-9: Results of the HFAM with the final version impact assessment on single-track sections ... 112
Table 5-10: Results of the HFAM with the final version impact assessment on double-track sections ... 112
Table 5-11: Comparison results for the NIRN single-track sections ... 113
Table 5-12: Comparison results for the NIRN double-track sections ... 113
Table 6-1: Current condition of 4 main lines ... 120
x
Table 6-3: Results of the HFAM for Main Line B (Londonderry to Belfast Central) ... 124
Table 6-4: Original conditions of Main Line A ... 126
Table 6-5: Original conditions of Main Line B ... 127
Table 6-6: Upgrade scenarios for Line Section A3 ... 129
Table 6-7: Upgrade scenarios for Line Section B2 ... 130
Table 6-8: Construction cost of upgrade scenarios ... 131
Table 6-9: Results of 4Cs performance of upgrade scenarios on Line Section A3 ... 132
Table 6-10: Results of 4Cs performance of upgrade scenarios on Line Section B2 ... 132
Table 6-11: Comparison results of 4Cs performance on Line Section A3 in percentages 133
xi
Glossary of Terms / List of Abbreviations
Term Explanation / Meaning / Definition4Cs Capacity, Carbon, Customer satisfaction and Cost
AC Alternating Current
AHP Analytic Hierarchy Process
ANT Antrim BAM Bellymena BDR Border BFC Belfast Central BGS Bangor BMY Ballymoney
CBA Cost-Benefit Analysis
CBTC Communications-Based Train Control
CMOOP Constraint Multi-Objective Optimisation Problem
COL Coleraine
CSP Constraint Satisfaction Problem
DC Direct Current
DEFRA Department for Environment, Food and Rural Affairs DEMU Diesel-Electric Multiple Unit
DMU Diesel Multiple Unit ECML East Coast Main Line EMU Electric Multiple Unit
GB Great Britain (England, Scotland and Wales) GRIP Governance for Railway Investment Projects GVS (Belfast) Great Victoria Street
HFAM High-level Feasibility Analysis Model IEA International Energy Agency
KPI Key Performance Indicator
LDY Londonderry
LIS Lisburn
LRH Larne Harbour
xii Term Explanation / Meaning / Definition MCDM Multi-Criteria Decision-Making MOOP Multi-Objective Optimisation Problem MTS Multi-Train Simulator
NIRN Northern Ireland Railway Network
NR Network Rail
NRPS National Rail Passenger Survey
NRY Newry
ORR Office of Rail and Road
PiXC Passengers in excess of capacity’
POR Portadown
PPM Public Performance Measure
PRH Portrush
RUSP Railway upgrade selection Process STS Single-Train Simulator
SWOT Strengths, Weaknesses, Opportunities and Threats TCRP Transit Capacity and Quality of Service Manual UIC International Union of Railways
UK United Kingdom (Great Britain and Northern Ireland) WebTAG Web-based Transport Analysis Guidance
WHA Whiteabbey
WHD Whitehead
1
Chapter 1
Introduction
1.1
Introduction to railway systems in UK
1.1.1 Overview on current situation
The railway plays a significant role in economic growth, both nationally and globally [1-4]. The railway system is an efficient transport model for long distance travel, for transporting both people and goods, and also for shorter urban commuter journeys, since it is fast, safe, high capacity, customer and environmentally friendly [5-7]. As indicated in the figures presented in Transport Statistics Great Britain 2016 [8], trains use less than 2% of the total transport energy use to carry around 10% of the passenger-km and around 12% of the freight tonnes-km, whereas cars carry about 65% passenger-km and emit 58% of total transport CO2
emissions. In addition, National Rail passenger journeys (including all passenger services in Great Britain) have increased by 57% since 2005/06. Railway transport can be the solution to issues raised by rapidly increasing demand for travel, increasingly energy intensive lifestyles and a tendency to choose faster travel [9].
The railway system in the United Kingdom is the oldest in the world, at nearly 200 years old [10]. Nowadays it is one of the busiest railway networks, running more train services than most countries in Europe, with nearly 20% more train services than France, and 60% more than Italy [11]. Since 2010, the number of passenger journeys has grown rapidly and continuously, reaching 1.69 billion in 2015/16 (1.25 billion in 2010/11), as shown in statistical reports by the ORR (Office of Rail and Road) [12, 13]. The pressure on railway services from the demand for railway capacity is therefore increasing significantly, which leads to overcrowding at peak times [14]. Furthermore, due to the limited availability of funds
2
and limited space for new infrastructure [15, 16], an efficient option is to improve an existing railway network to meet the rapidly increasing demand for railway capacity.
1.1.2 Overview on the direction of future development
In the coming decades, cities will be increasing in number, size and geographical spread. The global urban population is rapidly increasing, which means the demand for high capacity and fast rail transport between or inside cities is also rapidly increasing. The growing pace of urbanisation will add stress to the demand for city systems and infrastructure; a safe and more reliable rail transport will be required to meet this demand. More frequent and intensive extreme weather, as a result of climate change, may make transportation infrastructure design, operation and maintenance more difficult, which will also give rise to concerns about the environment. Meanwhile, constraints on available energy and resources may limit economic growth. As a low carbon mode of transport, rail has great potential to meet environmental and resource issues. New advanced technologies may lead to smarter, faster, safe, integrated and intermodal transport solutions. The trends described here will have significant impacts on the direction of future development in the rail industry [17-19].
In order to promote the competitiveness of the rail industry and adapt to trends, capacity, carbon, customer satisfaction and cost (4Cs) have been proposed as strategic objectives by the UK Department for Transport [20]. The optimisation of the 4C targets, which essentially means expanding capacity, reducing carbon emissions, improving cost efficiency and better meeting customer satisfaction, has been used in the GB rail industry as a key strategy in the improvement of the railway [21]. As discussed before, the challenges of future development of the rail industry mainly encompass high capacity demand, being an environmentally-friendly transport mode, limited resources and the tendency towards faster, smarter and safe
3
travel, which could be addressed in the 4Cs strategic objectives. (Details of the 4Cs framework are presented in Chapter 2.3.) A range of research aimed at improvement of each target has been published, for example [22-25], but few of these studies consider the railway as a complete system (which is further discussed in Chapter 2.3.5).
1.2
Decision-making in systems engineering
Systems engineering plays a significant role in developing complex engineering systems (especially railway renewal projects), the core of which is utilising systems thinking principles to form a structured process. Systems thinking refers to considering the interaction between parts of a whole system, rather than concentrating just on the parts. Systems engineering is an interdisciplinary approach, which encompasses (1) the initial definition of system requirements and relating these requirements to specific design criteria to ensure the effectiveness of early decision-making in the design process; (2) addressing all phases, including system design and development, production and construction, verification, deployment, operation, maintenance and support, disposal, etc. over the life-cycle of an engineering system;(3) ensuring that all system objectives are addressed in an effective and efficient way in the process of the system design and development. [26, 27]
As a systems engineering model, Network Rail introduced Governance for Railway Investment Projects (GRIP) to support and guide project managers on investment projects through their lifecycle, as shown in Figure 1-1. GRIP describes how to manage and control railway system upgrade projects, which has proven its ability to help steer upgrade projects from requirements through to delivery [28]. GRIP divides a project into 8 stages from initial definitions, options selection, design and test to project support system closed, including the aims and main outputs of each stage. However, the success of a project depends on
4
appropriate options being explored in the early stages [29-31] (e.g. the 3rd stage in GRIP, option selection). As shown in Figure 1-2 [29], by the time of decision making, the project has only spent around 15% of its budget while over 80% (as estimated by Atkins) of its cost has been committed. Even though the cost incurred in the early stages is low, cost influence on the whole project is quite high. A lack of thought in the decision making in the early stages of a project will result in inevitable changes in the later stages, which could result in unexpected cost and time overruns. In Elliott’s research [32], the later the changes occurred, the greater the unexpected influence has on a complex project. For example, for the modernisation of the Great Western railway network [33, 34], the original budget was £2.1bn in 2013, but the final cost has now overrun to £5.6bn with 18 months of delay due to inadequate planning, such as underestimating the number of bridges for replacement or alteration to make space for overhead lines, and lack of research on the location of some new structures. If engineers had been able to make the right decisions on appropriate solutions at the early stages, the overspend could have been reduced, though the original estimate could have been higher. Similarly, in Netherlands, the government decided to build a freight rail link which would be the only solution to connect Rotterdam Harbour and the Ruhr Area; due to underestimating the capacity of the existing rail network and the costs of new infrastructure (higher than the benefits), alternative solutions were evaluated only at a very late stage which led to unexpected cost overruns [31]. It can be seen that the problem of cost and time overruns is a common phenomenon for large or mega railway renewal projects. [35]
From past experiences of projects which have overrun in terms of cost or time, it can be seen that the main reason for the overruns was inadequate consideration and appraisal at the early stage. In many instances, due to a lack of well-defined requirements from the beginning, the common approach followed has been to ‘deliver it now and fix it later’. In all fields of
5
engineering, the solutions commonly become too technically focussed at a low-level too quickly without consideration of a large number of alternatives, which may result in missing potential alternatives as there seems to be little likelihood of proving their feasibility [36]. In order to avoid this situation, it is better to consider many alternatives than to overlook one that might be preferred. Due to the complexity of railway systems, it is difficult to consider all the interactions between various railway system components at the early stages in a railway renewal project. (A review of railway systems architecture is demonstrated in Chapter 2.1.) McNulty’s report [29] indicates that there is a lack of effective and efficient decision-making support models and tools applied in the early stages, which could allow a large number of possible alternatives to be taken into account, and simultaneously the railways should be considered as a complete system. Over recent decades, many decision-making methods have been proposed to choose solutions from numerous alternatives based on the decision-makers’ preferences, the most popular of which applied to rail projects are analytic hierarchy process (AHP) [37-39], cost-benefit analysis [31, 40] and analytic network process (ANP) [41, 42]. Most of these decision making methods stay at a very high level and can only focus on assessing a limited number of alternatives, rather than a large number of upgrade options. A review of complex decision-making is demonstrated in Chapter 3.
6
7
Figure 1-2: Cost influence, cost committed and cost incurred relationship curve against project phases [29]
1.3
General research problem statement
This thesis focuses on the research problem of how to find appropriate solutions for railway renewal projects.
A railway renewal project refers to complex engineering projects that aim to alter railway system components (infrastructure, rolling stock or operation) to improve the performance (capacity, energy efficiency, reliability, safety, etc.) of the existing railway system with old conditions to meet requirements.
The appropriate solutions refer to those upgrade scenarios that could meet requirements and have better performance.
8
Upgrade category refers to the type of upgrade, e.g., adding wagons, lengthening platforms, improving signalling system.
Upgrade option refers to the specific upgrade, e.g., increasing the number of carriages per trainset from 3 to 4, improving signalling system from 3-aspect signalling to 4-aspect signalling.
Upgrade scenario refers to a combination of upgrade options in one or more categories, e.g., increasing the number of carriages per trainset from 3 to 4 meanwhile lengthening 20m platforms, improving signalling system from 3-aspect signalling to 4-aspect signalling meanwhile increasing line speed from 60 mph to 90 mph.
The scope of this research only includes the existing railway system running in a normal and safe manner, including infrastructure, rolling stock, operation and timetable. It is appropriate not to consider safety as part of the solution identification process, as all solution would be in line with existing safety standards, and therefore be considered to be safe. However, at a later date further works could be focused or compare solutions in terms on construction and operational safety risks. The railway system models considered in this thesis mainly include urban railway systems and mainline railway systems, while some scenarios similar to metro system are also discussed in Chapter 6. The solutions to the research problem identified in this research are high-level, the specific implementation of which in the real-world is not taken into account. For example, with limited investment, improving a signalling system from 3-aspect to a 4-3-aspect signalling system is the most appropriate solution for a rail system, while the precise technical details are outside the scope of this research.
9
1.4
Aims & objectives
The aim of this research is to develop a support process and model for early-stage decision-making of a railway renewal project to find the most appropriate solutions that can meet high-level requirements. It is called the Railway Upgrade Selection Process (RUSP). This aims to help to: (1) reduce the number of design changes in the later stages of a railway renewal project; (2) provide evidence to project sponsors and regulators that a wide range of design scenarios have been considered; (3) make certain that all relevant data has been collected prior to going ahead with a detailed design decision.
The objectives of the research presented in this thesis are as follows:
In order to find appropriate solutions for railway renewal projects, this thesis targets the development of a railway upgrade selection process (RUSP) to support decision making in the early stages.
For an existing railway system, in order to be able to develop appropriate solutions to address high-level requirements, this thesis targets the collection of sufficient data and information that could represent a particular line with qualitative characterisation, including existing problems or bottlenecks, current conditions and requirements. In order to comprehensively evaluate a railway system, this research targets using 4Cs as performance measurements.
An efficient combination of macroscopic and microscopic modelling could potentially benefit the project planning process. In order to evaluate every possibility, this research aims to develop a high-level feasibility analysis model (HFAM) to assist decision makers to remove infeasible options and identify candidate solutions with a straight-forward and quick evaluation of a large number of upgrade options for further
10
detailed consideration using microscopic modelling. The candidate solutions are further evaluated in microscopic modelling to determine the appropriate solutions, which could be a combination of upgrade options.
In order to verify the feasibility of the high-level feasibility model and the railway upgrade selection process, this thesis presents two case studies.
1.5
Thesis structure
The structure of the thesis is set out as follows:
Chapter 1 is a general introduction to the background and research motivation (including an overview of the current situation, the direction of future development of the railway system in the UK, existing problems or bottlenecks when improving the railway system and the introduction to systems engineering), aims and objectives and thesis structure.
Chapter 2 provides an introduction to railway system architecture, including infrastructure, rolling stock and operation. A review of modelling and simulation is also taken into consideration in this chapter, including the importance of M&S, category thereof (macro and micro simulation), and commonly-used simulators. This chapter also reviews a wide range of railway system performance measurements, mainly surrounding 4Cs, including the different definitions and measurements. The knowledge presented in this chapter will support the new methods for the decision-making process, including the methodology (Chapter 4) and case study (Chapter 5 and Chapter 6). Chapter 3 provides a review of established decision-making processes, definitions and
methods thereof. This chapter discusses how to define the existing problem into an academic research problem and relevant researches and methods. The knowledge
11
presented in this chapter aims to support the modelling phase (in Chapter 4) and propose that the existing decision-making methods still have some drawbacks to solve this specific research problem.
Chapter 4 presents a method to solve the research problem set out in Chapter 1.3, which is the railway upgrade selection process. This chapter details the structure of the RUSP, which consists of three stages: data collection and system analysis, candidate solution identification (including details of the high-level feasibility analysis model) and evaluation and optimisation (micro simulation).
Chapter 5 demonstrates the development process of the high-level feasibility analysis model, which is part of the simulation stage of the RUSP. An initial version of the HFAM was proposed at the beginning of the design process of the HFAM. A case study based on the East Coast main line is presented to verify the feasibility of the initial version. Based on the outcomes of the initial version and its verification, an updated final version of the HFAM has been proposed and is verified based on the Northern Ireland railway network case study.
Chapter 6 details the application of the RUSP on the Northern Ireland railway network, including the results of the HFAM gained in Chapter 5 and the simulation results of candidate scenarios in OpenTrack.
Chapter 7 draws a conclusion on major contributions, limitations and further work of the research demonstrated in this thesis.
12
Chapter 2
Background
This chapter gives an overview of the British railway architecture, including infrastructure, rolling stock and operations. Thus, there are various alternatives in each component associated with railway renewal projects. Due to the complexity of a railway system, modelling and simulation (M&S) plays an important role in testing solutions before implementation in real life. Therefore, an overview of M&S and widely-used software tools is given in this chapter. The evaluation of the performance of a railway system depends on the choice of performance indicators and measurements. As introduced in Chapter 1.1.2, the 4Cs framework is the key strategy for railway system optimisation, thus the fundamental knowledge of 4Cs is also presented in this chapter.
2.1
Railway systems architecture
Railway transport is a means of conveyance of passengers and goods on wheeled vehicles running on tracks, which is comprised of different systems, such as urban railway systems, high-speed railway systems, and metro railway systems. Generally, a railway system consists of three essential components: infrastructure, rolling stock and operations. Rolling stock can be running in the network, based on infrastructure support and operation control. The relationship between these three key components is presented in Figure 2-1.
13
Figure 2-1: Relationship between infrastructure, rolling stock and operation in an electrifiedrailway system [43]
2.1.1 Infrastructure
Infrastructure is the fundamental base for a railway system. The choice of route (where the tracks are laid) is usually largely dictated by traffic demands and existing physical constraints (such as ground conditions, water levels, existing building foundations, cost), while in some instances alternatives such as bridges and tunnels can be taken into consideration to reduce operation costs and allow higher speeds.
Track
Track guides hard steel flanged wheels to keep rolling stock on the track without active steering, which traditionally consists of two parallel rails set using timber or concrete sleepers to maintain a standard gauge, supported by track ballast. There are also other structures, such as ballastless track, ladder track or continuous longitudinally supported track. No matter
Infrastructure
Rolling Stock
Operation
Electrification Signalling
Station & Track
Power supply Command Control Support Control Information exchange Information exchange
14
whether it is complicated layouts at terminal stations or a simple single-track rail with passing loops, all railways require turnouts (known as switches or points) at a railway junction to direct trains from one track to another and crossings to allow trains to cross other tracks. Any assembly of points and crossings is called a layout. Due to passing trains, weather and day/night conditions, track maintenance is essential to ensure trains run safely and efficiently. [43]
The most common rail lines are single-track, double-track, triple track or quadruple track. Single track is usually found on lower traffic lines or branch lines, where trains share the same track when running in both directions. In order to create more capacity on single-track sections, passing loops are required to allow trains travelling in both directions to pass each other, when more than one train is running on the same single-track sections. Single track is relatively cheap to build but takes less capacity. Double-track lines allow trains to run on one track for each direction, which can take more capacity, allow higher speed trains, and have lower operation risks, compared with single-track lines. Lines with more than two tracks allow more trains with different velocities to run parallel and share infrastructure in stations and junctions.
Signalling
Signalling systems are used to control and maintain trains running in a safe manner with a headway distance as pre-planned, to prevent conflict movements and to ensure that points are locked in the correct positions. Due to the low friction between wheels and rails, a long braking distance is essential to prevent collision when trains are running at high speed. In order to avoid collision, trains are not allowed to occupy the same track section at the same time, known as blocks. Most blocks are fixed, but not all. Fixed blocks are controlled using
15
fixed signals, which are placed at the beginning of each block. The signalling is a means of showing whether blocks are clear or not, which is detected by track circuits or other means such as axle counters. The train is given permission to proceed only if the signal is ‘green’.
Figure 2-2: Different signalling systems and headway
Train 1 Signal separation Sighting distance Braking distance Train 2
OverlapTrain length Sighting
point
Signal 1
Signal 1R Signal 2R Signal 2
2-aspect signalling
Block Block
Sighting
distance Braking distance
Train 2 Train 1
OverlapTrain length Sighting
point
Signal 1 Signal 2 Signal 3
3-aspect signalling Block Sighting distance Block Block Braking distance Train 2 Sighting point Train 1 OverlapTrain length
Signal 1 Signal 2 Signal 3 Signal 4
Braking distance Safety margin Train 1 Train 2
4-aspect signalling
16
The modern signalling system can encompass fixed block signalling (such as 2-aspect signalling, 3-aspect signalling, 4-aspect signalling) and moving block signalling, as shown in Figure 2-2. The headway is the minimum time or distance interval that can be run between trains, which consists of the braking distance, sighting allowance, overlap and train length. The more aspects a signalling system has, the shorter a headway can be. One of the disadvantages of fixed block signalling is that a longer stopping distance is required to allow fast trains to run safely, so a longer block is required, thus reducing the line capacity. If the train location can be defined precisely, moving block signalling can be introduced to increase the line capacity. Radio-based communications-based train control (CBTC) systems are sometimes deployed to use moving block principles. [43-46]
Station
A railway station enables passengers to embark and disembark and allow efficient and reliable access and interchange. When designing or improving a station, numerous facilities need to be taken into consideration, such as ticket halls, car parking, access for the disabled, access for emergency services, interchange facilities, passageways, staircases, escalators, footbridges, level crossings, and platforms, which are related to customer satisfaction in rail transport. Station platforms play a crucial role as part of the infrastructure of any railway systems, which should provide sufficient spaces for passengers to wait, board and get off trains. The location of entrances and exits to platforms is also important to keep dwell time to a minimum (the time a train spends at a scheduled stop). Meanwhile, the width and curve of a platform should be carefully considered to ensure passenger safety in crowded conditions. The length of a platform also needs to be taken into account to match the length of rolling stock. [43]
17
The railway electrification system is a power supply for trains (excluding DMUs), which results in lower operation costs than running diesel locomotives but requires large capital investment for construction. With a power supply, trains are allowed to run under a continuous conductor along the track. There are two forms of power supply: mainlines and tram systems usually have an overhead line suspended from poles or towers along the track, whereas metro systems usually use a ground third rail. The two most common electrification systems for mainline railways are the 25 kV 50 Hz AC (alternating current) single phase system and the 750 V DC (direct current) system. Metro and light railways also use these systems, but often adopt lower voltages. High voltage AC systems require cheaper fixed equipment but more expensive locomotives; in contrast, medium voltage DC systems require cheaper locomotives but more extensive and expensive lineside equipment. [43, 47, 48]
2.1.2 Rolling stock
Railway rolling stock runs on hard wheels along the track. A wide range of rolling stock is used for different railway systems, such as passenger vehicles, freight vehicles, multiple units, trams, and maintenance trolleys. Motive power for the train is provided by a separate locomotive or individual motors built in each carriage, known as multiple units. Multiple units are more energy-efficient, have easier acceleration, shorter turnaround times and lighter axle loads than locomotive-hauled trains, but they are noisier, more difficult to maintain or replace when they fail, and have less flexibility to be split or joined. [43]
Traction type
The first locomotive using steam motive power was developed in Great Britain in 1804, but steam was gradually superseded by diesel and electric traction. The power of electric traction comes from an overhead line or third rail, while the power of diesel traction comes from
18
diesel engines. Most rolling stock running on railway systems in Great Britain are either locomotives or multiple units, which can be classified by their traction types, including diesel locomotives and diesel multiple units (DMU) or electric locomotives and electric multiple units (EMU). Electro-diesel locomotives or diesel-electric multiple units (DEMU) can run as electric locomotives or EMU on electrified sections and as diesel-electric locomotives or DEMU on electrified sections, which have a diesel engine to drive a generator producing electricity for traction motors.
Passenger/ freight trains
Passenger trains carry passengers between stations while freight trains haul goods between freight depots or individual plants. Passenger trains often run on long-distance intercity railway systems, daily commuter railway systems, or local urban transit railway systems. In order to meet the requirements of different railway systems, the performance of passenger trains varies, such as operation speed, specialised vehicles (dining cars or sleeping cars), stops and service frequency. Generally, long-distance railways (inter-city railways) require higher speeds and lower station frequency, while short-distance railways (daily commuter railways and urban transit railways) require higher station and service frequency. Some freight trains share tracks with passenger trains, whereas others run on specialised freight railway systems between ports and various factories carrying standard containers. The railway has proven its advantages in terms of cost and energy efficiency for moving freight, especially over long distances. Approaching 100 million tons of freight a year is transported on the railway in the UK. [49]
19 2.1.3 Operations
Railway operation is through a system of control to ensure that the railway system runs in a safe and efficient manner; nowadays this is usually achieved by electronic and computerised control systems.
Timetabling
Timetabling is the process of planning a feasible schedule for each train path based on the available infrastructure and rolling stock. A railway timetable should coordinate the train paths for optimum use of the infrastructure, ensure sufficient train separation and avoid traffic conflicts, provide traffic information to passengers, and support traffic control, rolling stock usage and crew scheduling. In passenger operation, a pre-defined timetable is currently essential since it is not feasible to coordinate on-demand trains whilst ensuring safe operation when traffic is busy. In freight operation, due to changing demands from shippers, extra freight trains are allowed to replace pre-defined on-demand paths through computer-based timetabling. An extra train has to be scheduled as accurately as a regular train, but on a dynamic basis. [50]
In the UK, timetable generation starts with the train operators submitting their service bids for track access to the infrastructure manager (i.e. Network Rail). The infrastructure manager then solves the operational conflicts and develops a draft timetable. After that, a negotiation between the infrastructure manager and train operators will be undertaken to modify the draft timetable and solve further operational differences. The final timetable is published 6 months before implementation to allow Network Rail to allocate spare capacity and operators to sell tickets. [51]
20
Train services are usually run based on a pre-defined conflict free timetable in daily operation. However, in reality, for various different reasons (such as human behaviour, infrastructure failure, and weather) disturbances occur, and one or more trains may be delayed. In this scenario, the control centre must reschedule train services using methods such as re-timing, re-order, re-route or cancellation to help reduce the influence of delays and recover from the timetable disturbance. [52]
Maintenance
Every railway system relies upon proper maintenance of infrastructure (including stations, track, signalling, and electrification) and rolling stock to ensure that efficient, reliable and safe operation is sustained. All components of maintenance and maintenance costs need to be taken into consideration in the early planning stages. Both short-term and long-term maintenance need to be carried out. Railway depots are set up to maintain rolling stock, thus the location and design of depots is important. For instance, due to main line railway operation patterns, depots are usually required to be close to termini for passenger trains or to the origin or destination points for freight trains. [43]
2.2
Modelling & Simulation
A model is an external and explicit representation of a system as seen by the people who wish to use it to understand, manage or control the real-world system, which is built through extracting the critical characteristics and the factors from a real-world problem [53]. A simulation is used to imitate the action of a physical system by means other than that actually employed by the system [54]. Modelling and simulation (M&S) is normally used to support the early stages of a railway renewal project in order to verify the feasibility of technical decision making, save major resources and time, increase the quality of solutions, and
21
investigate safety issues before implementation. Generally, the higher degree of details there is in the modelling, the more useful the result of the modelling will be to the decision maker.
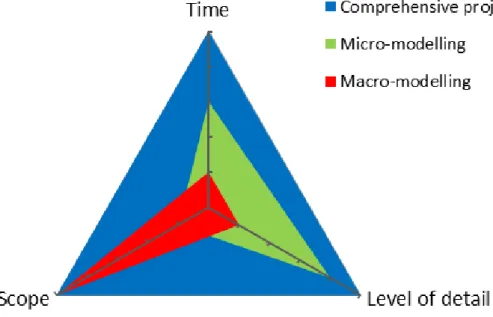
Figure 2-3: Relationship between micro and macro modelling and complex projects M&S can be divided into two categories: macroscopic and microscopic. The function of macroscopic and microscopic modelling for complex projects is shown in Figure 2-3, which demonstrates 3 key indicators of a comprehensive project (as the blue triangle), including long time, large scope and high level of details. Macroscopic modelling can efficiently provide an overview but less detail (as the red triangle), while microscopic models are closer representations of real-world systems. However, microscopic simulations (as the green triangle) can be technically challenging to perform, although they can give the fine scale details that are often required as part of project planning. It is common to use either macroscopic or microscopic simulation to support decision making in real-life problems. As discussed in Chapter 1.2, at the outset of a railway renewal project, promising upgrade options and innovations could potentially be missed without a systematic exhaustive
22
consideration of all possible options. However, it would be prohibitively time consuming to perform detailed simulation of every upgrade option and combination thereof (e.g. double-tracking a single-track section, replacing point machines, upgrading the control system). It is also a challenge to collect all possible upgrade options for a railway upgrade project. Therefore, an efficient combination of macroscopic and microscopic modelling could potentially benefit complex engineering projects.
The application of M&S encompasses running time and headway calculation, capacity calculation, conflict detection and timetable design, signalling system depiction, energy consumption calculation, operational simulation and train driving simulation, etc. In general, macroscopic modelling, which is an abstract view of a system, is usually preferred for long-term planning tasks [50]. Typical applications in the rail industry include VIRIATO [55], which aims to assess timetable robustness and support strategic timetable planning. Microscopic modelling is concerned with more details such as track information (including speed limits, gradient, radius, etc.), the signalling system (including signals, block sections, etc.), rolling stock (including vehicle types, mass, power, traction, capacity, maximum speed, etc.) and some operational information (including timetable, routes, alternative platforms, etc.). Commonly used microscopic rail simulators are RailSys [56] and OpenTrack [57]. The examples of simulators presented in the following sections aim to support the case studies in Chapter 5 and Chapter 6.
2.2.1 Single-Train Simulator & Multi-Train Simulator
Both the Single Train Simulator [58] and Multi-Train Simulator [59, 60] are microscopic simulation software, developed in MATLAB at the University of Birmingham. The STS aims to evaluate the kinematic vehicle model to provide the mechanical power delivered at the
23
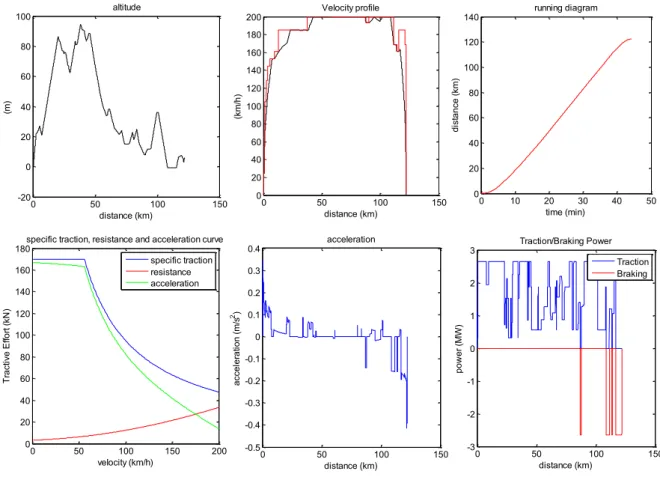
wheels. The input data of the STS mainly involves vehicle models (including resistance characteristics based on the Davis equation, traction, mass, maximum speed, etc.) and route information (including station stops, gradient profile, and speed limit profile). The STS is capable of providing a variety of train graphs and the data thereof, including the altitude profile graph, velocity profile graph, running diagram, traction, resistance and acceleration curve, acceleration vs. distance graph and traction/braking power graph, as shown in Figure 2-4, and the results of energy consumption at the wheel.
Figure 2-4: Train graphs in STS
Due to a lack of interaction analysis between two consequent running trains in the STS, the MTS adds a signalling system to the system based on the STS. The MTS also can analyse the impact on the mechanical power of the second vehicle when the first vehicle is delayed. The
0 50 100 150 -20 0 20 40 60 80 100 altitude distance (km) (m ) 0 50 100 150 0 20 40 60 80 100 120 140 160 180 200 Velocity profile distance (km) (km /h ) 0 10 20 30 40 50 0 20 40 60 80 100 120 140 running diagram time (min) d ist a n ce ( km ) 0 50 100 150 200 0 20 40 60 80 100 120 140 160
180specific traction, resistance and acceleration curve
velocity (km/h) T ra ct ive E ffo rt ( kN ) specific traction resistance acceleration 0 50 100 150 -0.5 -0.4 -0.3 -0.2 -0.1 0 0.1 0.2 0.3 0.4 acceleration distance (km) a cce le ra tio n ( m /s 2) 0 50 100 150 -3 -2 -1 0 1 2 3 Traction/Braking Power distance (km) p o w e r (M W ) Traction Braking
24
input and output data of the MTS is similar to that of the STS. These two simulators are user-friendly, but only focus on an evaluation of the energy consumption of train movements and they lack operation simulation (such as timetabling, traffic management).
2.2.2 OpenTrack
OpenTrack is a well-established, integrated commercial simulator, which was originally developed in the mid-1990s at the Swiss Federal Institute of Technology’s Institute for Transportation Planning and Systems. OpenTrack allows the modelling of different types of railway systems (such as intercity rail, commuter rail, metro and high speed rail) and supports numerous tasks (such as capacity analysis of lines and stations, running time calculation, timetable construction, signalling system design, energy consumption calculation).
25
Figure 2-6: An example model in OpenTrack
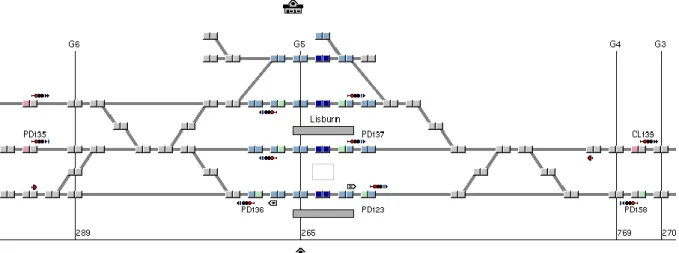
The elements of input and output included in the OpenTrack are demonstrated in Figure 2-5. The input data involve infrastructure, rolling stock and timetable, as shown on the left of Figure 2-5. A railway network is described in double vertex graphs, as shown in Figure 2-6, which can be easily edited. Each vertex represents a change which has happened in the infrastructure (such as gradient changes, speed limit changes, signals or junction location), and each edge (connecting two adjacent vertex) contains the data of the infrastructure (such as length, gradient, speed limit for different train categories). The characteristics of locomotives and trainsets (such as tractive effort/speed diagrams, length, load, number of carriages per trainset) and timetable (such as arrival and departure times, dwell time) are organised in a database. During the simulation, animation of the train movement is provided, which is under the constraints of the signalling system and timetable. The output is in the form of diagrams, train graphs, occupation diagrams and a statistics log file, as shown on the right of Figure 2-5. [57, 61]
26
2.3
Railway performance
The European railway system is facing the challenge of accommodating the rapid growth of transport demand, whilst simultaneously improving train punctuality and safety and saving energy. More specifically, to improve a railway system, is to improve the performance of a railway system. Performance measurement, commonly applied in industry or business, is the process of providing objectives and quantitative indicators of various aspects with respect to the performance of a system [62, 63]. The aims can be summarised in Behn’s research [64]: (1) evaluate how well a system performs, (2) control subordinates doing the right thing, (3) allocate budget, (4) motivate staff, stakeholders and citizens, (5) promote the organisation, (6) celebrate success, (7) learn strength and weaknesses, and (8) improve performance. In general, performance measurement has been widely used in the rail industry and is crucial for railway planning and management.
Numerous researches of performance measurement framework development have been proposed to provide a more comprehensive view of a railway system. For instance, Onatere et al. [65] aims to collect and standardise the performance of urban transport services in Nigeria to support decision makers, who categorised KPIs into safety, security, environment, finance, traffic management and customer satisfaction, and listed most of the measurement units of each KPI. Lu et al. [66] proposed a railway performance measurement framework to support European railway improvements for timetabling, real time traffic management, operational management and driver advisory systems, using accommodation, journey time, connectivity, punctuality, resilience, passenger comfort, energy and resource usage and listed system properties as influencing factors, categorised into strategic and tactical factors, such as rolling stock, infrastructure, traffic management, human factors. Due to the complexity of railway systems, the definitions of KPIs vary depending on different objectives, the level of details,
27
and relevant systems. For example, Gonzalez-Gil et al. [67] provided a hierarchical list of KPIs for optimising energy consumption of urban rail systems, including traction power supply, vehicle traction, regenerative braking, vehicle auxiliaries, waste heat recovery, depots, stations and infrastructure. Compared with two researches for the entire railway system, Gonzalez-Gil et al. [67] put more emphasis on energy performance indicators and the selection and definition of KPIs is more specific. Therefore, the challenges are what related KPIs need to be used, how to integrate data, and how to present and interpret them.
As introduced in Chapter 1.1.2, the UK Department for Transport proposed a 4C strategic framework for further railway systems development. The 4C framework, including expanding capacity, reducing carbon emissions, improving cost efficiency and better meeting customer satisfaction, represents four trends of railway system improvement, which can also cover most KPIs listed in the researches previously mentioned. For instance, in Lu et al.’s and Onatere et al.’s researches, the customer satisfaction indicator comprises those KPIs such as journey time, connectivity, punctuality, resilience, passenger comfort, and safety, the capacity indicator comprises traffic management and resource usage, the carbon indicator comprises environment and energy, and the cost indicator comprises finance. Therefore, as the basis of railway system improvement, the definitions, measurements and improvements of each 4C target are presented in the following chapters.
2.3.1 Capacity
Commonly, when improving a railway system, the first consideration is to increase capacity. A large number of researches have been undertaken to improve railway capacity, and numerous railway components have a significant influence on capacity [68]. However, different stakeholders have various views on railway capacity. For instance, customers focus
28
on more on satisfying peak values (number of trains) and shorter journey times, while infrastructure planners put more emphasis on guaranteeing profitable utilisation of the infrastructure [69]. Therefore, capacity is defined in different ways by the different requirements of various stakeholders. The International Union of Railways (UIC) [69] provided the definition of capacity as “the total number of possible paths in a defined time window”. E. Kozan [70] defined “the capacity of a single line is the total number of standard train paths that can be accommodated across a critical section in a given time period”. M. Abril [68] proposed that capacity is “the maximum number of trains that would be able to operate on a given railway infrastructure, during a specific time interval, given the operational conditions”.
In practice, railway capacity is often associated with the capability of infrastructure to accommodate train traffic. Therefore, the most widely used measurements of existing railway capacity can generally be categorised into two different areas: traffic volume capability and infrastructure utilisation. The most common definition of railway capacity is traffic volume capability, addressed by UIC leaflet 405. The infrastructure utilisation is addressed by UIC leaflet 406, which is usually used to identify bottlenecks and for planning new or upgrading existing infrastructure.
2.3.1.1 UIC 405 method
UIC 405 was proposed by the International Union of Railways in 1983 to determine the line capacity [71]. Although this method has been superseded, it still provides a basic, direct and theoretical assessment of capacity in terms of the number of trains per given time period. UIC 405 can be expressed in function (2-1).
29
𝐿 = 𝑇
𝑡𝑓𝑚+ 𝑡𝑟+ 𝑡𝑧𝑢(𝑡𝑟𝑎𝑖𝑛𝑠 𝑟𝑒𝑓𝑒𝑟𝑒𝑛𝑐𝑒 𝑝𝑒𝑟𝑖𝑜𝑑⁄ )
(2-1)
where:
𝐿 is capacity of a line section; 𝑇 is the reference period;
𝑡𝑓𝑚 is the average duration of minimum train headway time; 𝑡𝑟 is an extra time margin;
𝑡𝑧𝑢 is additional time.
Minimum headway time (𝑡𝑓𝑚)
The average duration of minimum train headway time is the minimum possible time between two consequent trains that the signalling system will permit. The headway time is the time to clear the headway distance, which consists of braking distance, sighting distance, overlap distance and train length, as shown in Figure 2-7.
30
Figure 2-7: Blocking time of a block section [50]
Figure 2-2: different signalling systems, presented in Chapter 2.1.1, also illustrates what the headway time for each signalling system consists of. For a 2-aspect signalling system, the headway time can be calculated by Equation (2-2); for an n-aspect signalling system (n≥3), the headway time can be calculated by Equation (2-3); and for a moving block signalling system, the headway time can be calculated by Equation (2-4).
𝐻𝐷𝑡 = 𝐵𝐷𝑡+ 𝑆𝑆𝑡+ 𝑆𝐷𝑡+ 𝑂𝐿𝑡+ 𝑇𝐿𝑡 (2-2) 𝐻𝐷𝑡 = [ 𝑛 − 1 𝑛 − 2]𝐵𝐷𝑡+ 𝑆𝐷𝑡+ 𝑂𝐿𝑡+ 𝑇𝐿𝑡 (2-3)
31
𝐻𝐷𝑡 = 𝐵𝐷𝑡+ 𝑆𝐷𝑡+ 𝑂𝐿𝑡+ 𝑇𝐿𝑡
(2-4)
where:
𝐻𝐷𝑡 is the headway time, second;
𝐵𝐷𝑡 is the time to clear braking distance, second;
𝑆𝑆𝑡 is the time to clear signal separation (only for a 2-aspect signalling system), second;
𝑆𝐷𝑡 is the time to clear sighting distance, second; 𝑂𝐿𝑡 is the time to clear overlap length, second; 𝑇𝐿𝑡 is the time to clear train length, second; 𝑛 is the number of aspects (only for 𝑛 ≥ 3);
Extra time margin (𝑡𝑟)
The extra time margin is a “breathing space” added after each minimum train headway time to reduce the risk of delay occurrence, which varies depending on the maximum permission occupation. The value of the extra time margin is suggested based on experiments carried out by certain railways, stated in UIC leaflet 405. If the maximum permissible occupation of the determinant sector of line is 60%, the extra time margin will be 𝑡𝑟 = 0.67 × 𝑡𝑓𝑚. If the maximum permissible occupation of the determinant sector of line is 75%, the extra time margin will be 𝑡𝑟 = 0.33 × 𝑡𝑓𝑚.
32 Additional time (𝑡𝑧𝑢)
The additional time is another “double insurance” time allowed after each train headway time to achieve an acceptable quality of service over the whole line section, which varies depending on the number of sectors of line, 𝑡𝑧𝑢 = 𝑎 × 0.25, where 𝑎 is the number of sectors of line.
2.3.1.2 UIC 406 method
Defining railway capacity as traffic volume capability (addressed by UIC 405) is easily measurable and understandable, but cannot reflect quality of service. Therefore, infrastructure utilisation has been proposed to define railway capacity, which is addressed by UIC leaflet 406 [72]. This method is applied on existing timetables to evaluate infrastructure capacity using a compression method, which can be summarised into four steps: [72, 73]
Defining target railway system
This step puts emphasis on defining the infrastructure and timetable boundaries, with consideration of corridors, lines, interlockings, and areas excluded in the defined railway system.
Defining sections for evaluation
This step aims at determining line sections, which are split from the whole railway line when any infrastructure (such as signalling system, number of tracks in the line section) or timetable (such as beginning or ending services, different number of trains, train mixture) varies. This criterion is usually applied on a double-track line, rather than a single-track line. Landex [74] proposed that, for a single-track line, a split in a line section is not suggested when a passenger loop appears, in order to enable a consistent capacity statement. If UIC 406 is
33
strictly applied, the railway line should be divided at every passing loop or crossing station, which may result in the theoretical capacity being much higher than the actual capacity.
Calculating occupancy time
Occupancy time is the time to compress all train paths together with minimum theoretical headway time in a line section train graph which reflects a real timetable, as shown in Figure 2-8. It is highly recommended to define a time period longer than two hours. Train paths which enter the line section before the beginning or after the end of the defined time period are not included, as shown in the left figure of Figure 2-8. Through the compression method, all train paths are pushed close to each other but without overlap, as shown in the right figure of Figure 2-8.
Figure 2-8: Compression method on a double track line section (before (L) and after (R))[72] Evaluating capacity consumption
Based on the characteristics of line sections defined above, capacity consumption can be calculated by Function (2-5), where additional time includes any time (e.g., buffer time)
34
added to ensure quality of operation and the defined time period is recommended to be longer than two hours.
𝐶𝑎𝑝𝑎𝑐𝑖𝑡𝑦 𝑐𝑜𝑛𝑠𝑢𝑚𝑝𝑡𝑖𝑜𝑛 [%] =𝑂𝑐𝑐𝑢𝑝𝑎𝑛𝑐𝑦 𝑇𝑖𝑚𝑒 + 𝐴𝑑𝑑𝑖𝑡𝑖𝑜𝑛𝑎𝑙 𝑇𝑖𝑚𝑒𝑠
𝐷𝑒𝑓𝑖𝑛𝑒𝑑 𝑇𝑖𝑚𝑒 𝑃𝑒𝑟𝑖𝑜𝑑 × 100
(2-5)
The line section with the highest capacity consumption is the bottleneck of the whole railway line.
2.3.2 Carbon
As evidenced by the data in the Railway Handbook 2015 by the IEA (International Energy Agency) and the UIC (International Union of Railways) [75], rail is only responsible for 1.3% of energy use in Europe in 2012, lower than 72.2% for road, 12.7% for shipping and 12.4% for aviation, whereas the rail share of transport activity is 8.7% in total (including 7.6% passenger (PKM) and 10.6% freight (TKM)), compared with 69.6% for road, 15.9% for shipping and 5.8% for aviation. In general, rail transport is more energy efficient and environmentally friendly than other modes of transport. Even through rail is already a low carbon mode of transport, it is still essential to keep reducing carbon emissions and considering environmental issues, such as climate change, sustainable energy sources [76, 77]. The key method of reducing carbon emissions is improving propulsion systems and using more energy-efficient modes [78]. Statistics reported by the ORR [79] indicate that CO2
emissions per railway passenger kilometre have declined by 23.9% since 2005-06, while CO2
emissions per freight tonne kilometre are up 20.1% since 2005-06. CO2 emissions are
converted from traction energy consumption, which is the total traction electricity (kWh) and diesel usage consumption (litres) from actual and estimated data for both passenger and
35
freight trains, using standard conversion factors (in kgCO2 per kWh or in kgCO2 per litre)
published every year by the Department for Environment, Food and Rural Affairs (DEFRA) [80].
Figure 2-9: Traction energy flow for diesel-electric and electric vehicles [81]
However, traction energy consumption is more straightforward and easily estimated than CO2
emissions when assessing a railway system. Traction energy flow for diesel-electric and electric vehicles is demonstrated in Figure 2-9, where the given percentage may vary depending on different vehicles and railway systems. The major energy consumed within a
36
railway system is used to power the trains, which accounts for up to 80% of the total energy consumption from the power supply. In diesel-electric traction the engine has significant losses, and in electric traction there are conversion losses between the national grid and catenary. Meanwhile, some power is used for the auxiliary functions, sometimes known as ‘hotel’ power, such as heating, air conditioning, lighting, to improve the comfort of passengers [81].
2.3.2.1 Measurements of energy consumption
As the energy losses and ‘hotel’ power would ideally be considered as a fixed portion of the total energy consumption, the energy consumption usually considered is generated by train movement. Generally, the energy consumed per train per journey is expressed in terms of kWh. The methods used to solve the dynamic movement equations have been listed in earlier researches, [58-60, 81, 82]. These equations are used to evaluate the energy consumption of the vehicle at the wheels, which is also the basis of the STS and the MTS, mentioned in Chapter 2.2.1.
Train motion is governed by Lomonossoff’s equation, which is based on Newton’s Second Law, and can be expressed in Equation (2-6):
𝑀𝐸×
𝑑2𝑠
𝑑𝑡2 = 𝐹𝑇− 𝑅 − 𝐹𝛼
(2-6)
where:
𝑀𝐸 is the effective mass of the vehicle (𝑀𝐸 = 𝑀(1 + 𝜆), M is the mass of the vehicle, 𝜆 is a constant of rotary allowance).
37 𝑑𝑑𝑡2𝑠2 is the acceleration.
𝐹𝑇 is the traction force. 𝑅 is the vehicle resistance.
𝐹𝛼 is the force due to the gradient.
The vehicle resistance R can be described by the Davis Equation (2-7).
𝑅 = 𝐴 + 𝐵𝑑𝑠 𝑑𝑡+ 𝐶( 𝑑𝑠 𝑑𝑡)2 (2-7) where:
𝐴, 𝐵, 𝐶 are vehicle specific coefficients related to the static resistance, rolling resistance and aerodynamic resistance respectively.
𝑑𝑠𝑑𝑡 is the velocity of the vehicle.
The power (P) of the train can be computed by Equation (2-8), and the energy consumption (E) of the train at the wheel can be computed by Equation (2-9).
𝑃 = 𝐹 ×𝑑𝑠 𝑑𝑡 (2-8) 𝐸 = ∫ 𝑃 × 𝑑𝑡 𝑡 0 (2-9)
38
The equations listed here are the basis principle of the STS and the MTS to describe the physics of train movement, mentioned in Chapter 2.2.1.
2.3.3 Customer satisfaction
The needs and aspirations of the customer should be kept at the forefront when planning, constructing, maintaining, or improving any railway system. The passengers’ basic needs are comfortable travel and safe arrival on time, and the freight customer needs safe and on time delivery of their goods [43]. Transport Focus collects the opinions of more than 50,000 passengers each year to publish the National Rail Passenger Survey (NRPS), which provides a wide view of customer satisfaction with rail travel. According to the statistical reports by Transport Focus [83], a wide range of performance indicators are listed in the report, including journey planning, ticket service, station layout, punctuality, reliability, crowding, etc.
Some performance indicators are listed here, which are widely used to measure customer satisfaction.
Journey time
Passengers usually prefer faster travel, in other words, a shorter journey
![Figure 1-1: Guide to Governance for Railway Investment Projects (GRIP) [28]](https://thumb-us.123doks.com/thumbv2/123dok_us/604084.2572330/20.1262.190.1076.128.683/figure-guide-governance-railway-investment-projects-grip.webp)
![Figure 1-2: Cost influence, cost committed and cost incurred relationship curve against project phases [29]](https://thumb-us.123doks.com/thumbv2/123dok_us/604084.2572330/21.892.181.756.130.551/figure-cost-influence-committed-incurred-relationship-project-phases.webp)
![Figure 2-1: Relationship between infrastructure, rolling stock and operation in an electrifiedrailway system [43]](https://thumb-us.123doks.com/thumbv2/123dok_us/604084.2572330/27.892.180.751.133.506/figure-relationship-infrastructure-rolling-stock-operation-electrifiedrailway.webp)
![Figure 2-7: Blocking time of a block section [50]](https://thumb-us.123doks.com/thumbv2/123dok_us/604084.2572330/44.892.193.737.129.521/figure-blocking-time-block-section.webp)
![Figure 2-9: Traction energy flow for diesel-electric and electric vehicles [81]](https://thumb-us.123doks.com/thumbv2/123dok_us/604084.2572330/49.892.131.801.268.850/figure-traction-energy-flow-diesel-electric-electric-vehicles.webp)
![Figure 3-1: The decision-making process steps [97-100]](https://thumb-us.123doks.com/thumbv2/123dok_us/604084.2572330/58.892.339.593.126.536/figure-the-decision-making-process-steps.webp)