'85,1*7+(60(/7,1*2):(((
:,7+&233(56&5$3
A Thesis submitted in fulfilment of the requirements for the
degree of Doctor of Philosophy (PhD)
Alicia Anindya
B. Eng (Chemical Engineering, Hons.)
School of Civil, Environmental & Chemical Engineering
Science, Engineering & Technology (SET) Portfolio
RMIT University
March 2012
Declaration
I, Alicia Anindya certify that except where due acknowledgement has been made, the work is that of the mine alone; the work has not been submitted previously, in whole or in part, to qualify for any other academic award; the content of the thesis is the result of work which has been carried out since the official commencement date of the approved research program; any editorial work, paid or unpaid, carried out by a third party is acknowledged; and, ethics procedures and guidelines have been followed.
Alicia Anindya
Abstract
Electronic equipment, especially computers and mobile phones, plays a major role in increasing our standard of living, but they quickly become obsolete because developments in technology are very rapid. The superseded equipment, including all components, sub-assemblies and consumables, becomes waste and is commonly referred to as WEEE – waste electrical and electronic equipment.
The annual amounts of WEEE being generated throughout the world are large and increasing more rapidly than the rate of general municipal waste. In the past WEEE was usually landfilled, but this is no longer acceptable in most countries because toxic materials leach from WEEE into the water table. WEEE also contains significant amounts of many scarce and valuable metals like gold, silver and indium and so should be regarded as “urban ore” which contains higher concentrations of these metals than many natural ores. Collecting and reprocessing WEEE to recover as many of these metals as possible would make a contribution to their sustainability by increasing the lifetime of natural ore deposits.
Reprocessing WEEE mainly involves pyrometallurgical methods, but presents many technical challenges. The combination of metals found in WEEE is not the same as that found in ores, so the smelting techniques and slag systems that produce high recoveries of valuable metals from concentrates may not also produce high recoveries from WEEE. Including this waste in the feed to primary smelters is practiced in some parts of the world, but in Australia these smelters are very far from capital cities so transport costs become prohibitive. A more attractive option is to add WEEE to the feed of secondary copper smelters which process general copper-bearing wastes because these smelters are usually close to the cities where WEEE is generated. These smelters use a technology known as “black copper smelting”. However, technical information relating to black copper smelting is lacking because the companies involved are too small to have sustained a significant research effort. This impedes the optimal design of WEEE reprocessing operations.
In this work, the behaviour of two metals of interest in WEEE under black copper smelting conditions was investigated. The metals chosen were tin and indium because both are valuable and the natural supply of indium in particular is very small. The way in which tin and indium distribute between copper and slag under a range of oxygen partial pressures and slag compositions in the CaO-SiO2-FeOx (FCS) slag
system at 1300 °C was investigated experimentally.
The method chosen was the three-phase equilibration method. Copper and slag were brought to equilibrium in contact with a CO/CO2 gas mixture. A small amount of tin
or indium was initially added to either the copper or the slag. Experiments were conducted to determine the minimum time required to reach equilibrium. Several difficulties and sources of error were experienced. The range of Fe/SiO2 ratios in the
slag that could be investigated was limited due to interaction between the slags and the magnesia crucibles used to hold them. At high CaO contents the slag expanded sufficiently on cooling to break the crucible and spill its contents. The concentration of tin and indium had to be kept very small (~1 wt% Sn, ~1 wt% In) to ensure that their activity coefficients in copper and that of their oxides in slag were constant. However this led to significant relative errors in the analysis of these metals.
It was concluded that tin is present in slag as SnO (Sn2+) between oxygen partial pressures of 3 x 10⁻⁹ atm and 10-6 atm. This is in accord with the literature for iron silicate slags, but contrary to that for calcium ferrite slag and calcium magnesium silicate slag where SnO2 becomes predominant at the higher oxygen partial pressures.
It was also found that, under the same conditions, indium appeared in slag as InO (In2+). This is in accord with one previous study, but contrary to another where InO1.5
was said to be the oxide present.
The distribution ratios for both tin and indium were found to be dependent on the slag composition. The slag/metal distribution ratios decreased as the CaO content increased. It was also found that the Fe/SiO2 (w/w) ratio had a minimal effect on the
distribution ratios. As a result, the iso-distribution ratio lines plot as almost horizontal lines on a Kongoli phase diagram for the copper-saturated CaO-SiO2-FeOx
system. This behaviour is characteristic of “neutral” metal oxides within the context of the acid/base theory of metal oxide interactions in slags.
The activity coefficients of SnO(l) and InO(g) in the slags were calculated from the
distribution ratios and from agreed values for the limiting activity coefficients of tin and indium in molten copper. The gaseous standard state must be used for InO because this species only exists as a gas at 1300 °C. Activity coefficients are inversely proportional to slag/metal distribution ratios, so the iso-activity coefficient lines also plot horizontally on the Kongoli phase diagram. The activity coefficient of SnO varied from 1.0 at 5 wt% CaO to 3.5 at 25 wt% CaO while that of InO(g) varied
from 1.0 x 10⁻⁷ at 5 wt% CaO to 9.0 x 10⁻⁷ at 25 wt% CaO.
Computational thermodynamic models were created for both the reduction and oxidation stage of black copper smelting. In the reduction stage the CaO content in slag does not greatly affect the recovery of copper, lead, zinc and tin to the black copper. The indium recovery to copper increases a little when the CaO content in the slag increases. However it is unlikely that the use of high CaO slag could be economically justified. The reduction stage can be considered successful in that only very minor amounts of tin and indium are lost to the slag. When the black copper is next oxidised significant amounts of lead and zinc are removed as fume. However, tin and indium are predicted not to be fumed and report almost entirely to the slag. Recovery of tin and indium from slag are predicted not to be high so it must be concluded that the black copper smelting route for processing WEEE is not suitable for the recovery of all metals of interest from WEEE.
This work has produced novel information on the behaviour of indium in CaO-SiO2-FeOx slags and confirmed that of tin. It has contributed to the fundamental
understanding by confirming theoretical predictions of the acid/base behaviour of indium and tin oxides based on ionic bond strengths and the fractional ionic character of the bonds in the oxides, in that SnO and InO were found to be neutral in character. Finally, it has made use of the calculated activity coefficients of SnO and InO to analyse the performance of the black copper smelting route for reprocessing WEEE and found it to be inefficient for tin and indium recovery.
Acknowledgments
I would like to show my deepest and sincere gratitude to my supervisor, Professor Douglas Swinbourne, whose encouragement, guidance and stimulating support from the initiation of this Ph.D. project, writing of this thesis, to the completion of this thesis and enabling me to develop an understanding of the subject. Without his encouragement and support, I would not have completed this thesis.
I would also like to thank Professor Markus Reuter and Mr Robert Matusewicz from Outotec Oyj who gave me the opportunity to work with them in this project and supported me in every respect from the beginning of the project through to its completion. They also provided financial support, along with the Australian Research Council (ARC Linkage Grant LP0776721) and for this I am very grateful.
I would also like to thank Mr Gordon Percival from Outotec Oyj, 12 Kitchen Rd, Dandenong, who analysed my experimental samples.
I am grateful to Dr Tak Seng Kho for his guidance in the techniques of laboratory experimentation.
Lastly, I owe my loving thanks to my husband, Michael Aria Sugianto. Without his encouragement and understanding, the completion of this thesis would not have been possible. I would also like show my loving gratitude to my family (Dad, Mum, and brother), my Ph.D. friends and my ‘Cell’ Group, Sel Santa Maria who gave me huge emotional support throughout the thesis writing stage.
Thank you
Table of Contents
Declaration...ii
Abstract ...iii
Acknowledgments ...vi
Table of Contents ...vii
List of Figures...xi
List of Tables ... xviii
List of Symbols ...xxi
1.
Introduction ...1
2.
Literature Review 1 ...4
2.1. WEEE/E-Waste...4 2.1.1 Definitions...4 2.1.2 Growth of WEEE...6 2.1.3 Composition of WEEE...8 2.1.4 Disposal of WEEE...102.1.5 Health and Environmental Hazards...13
2.1.6 WEEE as a Resource...13
2.2. Current Treatment of WEEE...14
2.3. Reprocessing of WEEE with Copper Materials...17
3.
Literature Review 2 ...20
3.1. Secondary Copper Smelting...20
3.2. Copper Smelting Slags ...24
3.2.1 Iron Silicate Slag...24
3.2.2 Calcium Ferrite Slag...25
3.2.3 Ferrous Calcium Silicate Slag...26
3.2.4 Comparison of Copper Smelting Slags...30
3.3. Thermodynamics of Impurity distribution ...31
3.4. Distribution Behaviour of Tin ...37
3.4.1 Distribution Data from Literature...37
3.4.2 Tin Speciation in Slags...39
3.4.3 Activity Coefficient of Tin Oxide...43
3.4.4 Acid-Base Nature of SnO...52
3.4.5 Conclusion...56
3.5. Distribution Behaviour of Indium ...57
3.5.1 Distribution Data from Literature...57
3.5.2 Indium Speciation in Slags...58
3.5.3 Activity Coefficient of Indium Oxide...63
3.5.4 Acid-Base Nature of InO...71
3.5.5 Conclusion...74
3.6. Overall Conclusions ...74
5.
Experimental Methodology...77
5.1. Materials...77
5.1.1 Metal and Oxide...77
5.1.2 Gases...78
5.1.3 Crucibles...78
5.2. Equipment ...79
5.2.1 Furnace...79
5.2.2 Gas Flow Rate Calibration...83
5.2.3 Furnace Oxygen Partial Pressure...84
5.3. Experimental Plan ...86
5.4. Preparation of slags and copper alloys...88
5.4.1 Master Slags...88
5.4.2 Copper Master Alloy...90
5.5. Experimental Procedure ...90
5.6. Experimental Limitations and Problems ...91
5.7. Chemical Analysis...93
5.8. Error analysis...94
5.8.1 Furnace Temperature...95
5.8.2 Gas Composition...96
5.8.3 Sample Analysis...96
5.8.4 Total Relative Error in Distribution Ratio...100
6.
Results and Discussion...102
6.2. Oxygen Partial Pressure ...108
6.2.1 Tin...108
6.2.2 Indium...115
6.3. Distribution Ratio as a Function of wt% CaO...119
6.3.1 Fe/SiO2 (w/w)= 0.86 ± 0.043...120
6.3.2 Fe/SiO2 (w/w)= 1.07 ± 0.053...124
6.3.3 Comparison of Fe/SiO2 (w/w) = 0.86 and 1.07 results...129
6.4. Distribution Ratio as a Function of Fe/SiO2...131
6.5. Effect of CaO and Fe/SiO2 (w/w) on distribution ratios ...138
6.6. Iso-L lines on the FeOx-CaO-SiO2 Phase Diagram ...139
6.7. Activity Coefficient of Metal Oxide in Slags...144
7.
Computational Thermodynamic Modelling...159
7.1. HSC Input Data ...159
7.2. HSC Output – Reduction Stage...162
7.3. HSC Output – Oxidation Stage ...168
7.4. HSC Conclusion...172
8.
Conclusions ...173
9.
References ...175
10.
Appendices ...186
10.1. Summary of individual error from analysis of results...186
List of Figures
Figure 3.1.1. Simplified flowsheet of the black copper smelter. ...21
Figure 3.1.2. Activity coefficients of SnO in CaO-SiO2-FeOx slags
(Yazawa, 1994). ...23
Figure 3.2.1. Liquidus region and iso-equilibrium oxygen partial pressure (pO2)
lines at 1300 °C for the system of FeO-Fe2O3-SiO2 (dashed lines) and
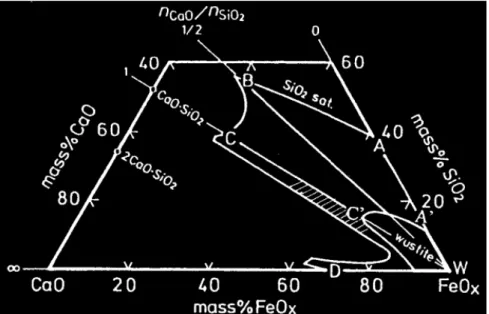
FeO-Fe2O3-CaO (solid lines) (Yazawa et al., 1981)...24 Figure 3.2.2. Liquid region in the FeOx-SiO2-CaO system at 1300 °C and the
composition range for FCS slags (shaded) (Yazawa et al., 1999). ...27
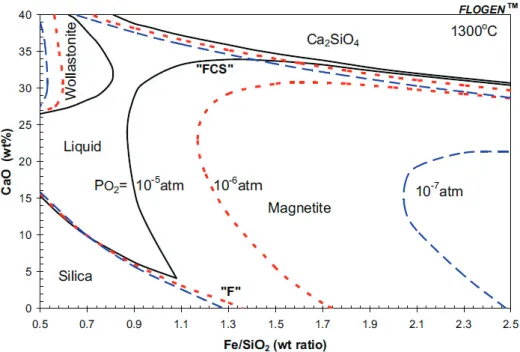
Figure 3.2.3. The effect of oxygen partial pressure on the liquid region of FCS slag (Kongoli et al., 2006). ...28
Figure 3.2.4. The effect of Cu2O addition on the liquid region of
FeOx-SiO2-CaO slag (Kongoli et al., 2006)...28 Figure 3.2.5. The effect of temperature on the liquid region of CaO-Fe2O3-SiO2-Cu2O slag saturated with blister copper (Kongoli et al., 2006)...29 Figure 3.3.1. Activity coefficients of oxides against the mole fraction of oxides in the slag at 1250 °C (Yazawa et al., 1983)...33
Figure 3.3.2. Total Moles of constituents in 100 g of slag, matte, and metal phase (Yazawa et al., 1983) ...33
Figure 3.3.3. Distribution ratios of Co, Sn, Sb, and As between slag and liquid copper in sulphur free system at 1250 °C (Yazawa et al., 1983)...35
Figure 3.3.4. Distribution ratios of Zn, Pb, Cu, Bi, and Ag between slag and liquid copper in sulphur free system at 1250 °C (Yazawa et al., 1983). ...36
Figure 3.4.2. The reported slag/copper distribution ratios for tin as a function of oxygen partial pressure and temperature for several different slags (Takeda et al., 1983, Nagamori and Mackey, 1977, Gortais et al., 1994, See and Rankin, 1981). ...40
Figure 3.4.3. Comparison of tin distribution ratios from Brixlegg data (Woerz and Wallner, 1988) with accepted laboratory data of Takeda et al. (1983)...42
Figure 3.4.4. Activity coefficient of SnO(l) at 1250 ºC in iron silicate slag
(dashed line) and calcium ferrite slag (solid line) (Takeda et al., 1983). ...49
Figure 3.4.5. The activity coefficient of SnO(l) in FeOx-SiO2-CaO slag
(Takeda and Yazawa, 1989). ...50
Figure 3.4.6. Periodic Table (Mendeleyev, 2012). ...52
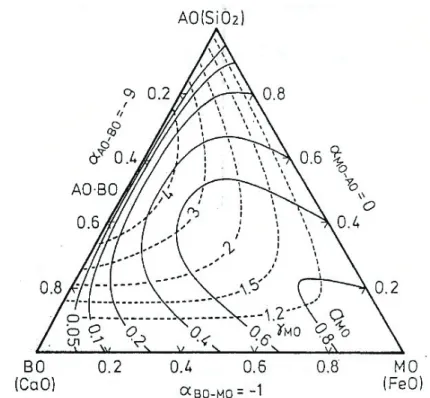
Figure 3.4.7. Iso-activity and iso-activity coefficient lines for a neutral oxide in the AO-BO-MO system. aMO (solid lines), γMO (dashed lines) (Yazawa, 1994)...55
Figure 3.4.8. Iso-activity coefficient lines of γSnO(l) and total loss of tin (MT) in
FeOx-SiO2-CaO slags. f(MT)=1/(γSnO)(NFeO) (Yazawa, 1994). ...55
Figure 3.4.9. Iso-activity coefficient lines of γSnO(l) in FeOx-SiO2-CaO slags
presented in a Kongoli diagram (Yazawa, 1994, Kongoli, 2009). ...56
Figure 3.5.1. Indium price (values are stated in $/kg) (Crusader, 2011). ...58
Figure 3.5.2. The reported slag/lead distribution ratios for indium as a function of oxygen partial pressure at 1200 °C for CaO-SiO2-FeOx slags (Hoang and
Swinbourne, 2007)...60
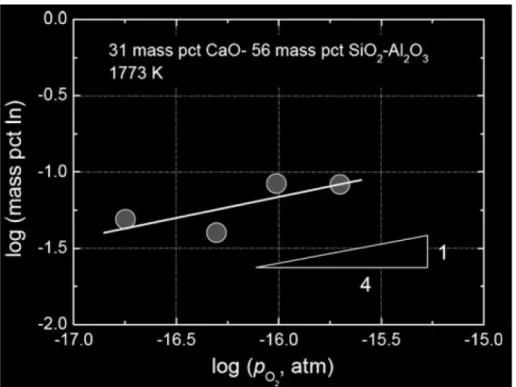
Figure 3.5.3. The reported slag/lead distribution ratios for indium as a function of oxygen partial pressure at 1200 °C for CaO-SiO2-FeOx slags. ...61 Figure 3.5.4. The reported results of indium distribution as a function of oxygen partial pressure at 1500 °C for CaO-SiO2-Al2O3 slags (Ko and Park,
Figure 3.5.5. Activity-composition relationship for the copper-indium system
(Azakami and Yazawa, 1976)...65
Figure 3.5.6. The relation between ∆GEXIn2O and the molar content of SiO2 (Ko and Park, 2011)...66
Figure 3.5.7. Indium metal/slag distribution ratio at 1200 °C between 10-12 atm and 10-10 atm (Hoang and Swinbourne, 2007). ...67
Figure 3.5.8. Activity coefficient of InO(g) at 1200 °C between 10-12 atm and 10-10 atm in a Kongoli diagram (Hoang and Swinbourne, 2007)...68
Figure 3.5.9. Thallium distribution ratio as a function of (CaO+MgO)/SiO2. Hollow points : 0.5 wt% Tl, solid points: 1.0 wt% Tl. (Johnson et al., 1983)...72
Figure 3.5.10. Thallium distribution ratio as a function of FeO/SiO2. Hollow points : 0.5 wt% Tl, solid points: 1.0 wt% Tl (Johnson et al., 1983)...73
Figure 5.1.1. Crucible arrangement for minor element distribution experiments...79
Figure 5.2.1. Equipment set up. ...80
Figure 5.2.2. Vertical tube furnace ...81
Figure 5.2.3. Four channel mass flow controller ...81
Figure 5.2.4. Varian gas clean moisture, CP17971 with colour indicator (left – non-saturated filter, right – saturated filter) ...82
Figure 5.2.5. Temperature profile of the vertical tube furnace ...83
Figure 5.3.1. Experimental plan – constant wt% CaO, varying Fe/SiO2 ratio...87
Figure 5.3.2. Experimental plan – constant Fe/SiO2 ratio, varying wt% CaO...87
Figure 5.4.1. Heating curve for master slag experiment...88
Figure 5.4.2. Liquid region of FeO-Fe2O3-SiO2-CaO at 1300 °C and pO2 = 10-7 atm with experimental slag compositions. ...90
Figure 5.6.1. Zirconia crucible attacked by the slag ...92
Figure 6.1.1. Tin distribution ratio at pO2 = 10-7 atm, 1300 °C, master slag
batch “OS016” ...104
Figure 6.1.2. Indium distribution ratio at pO2 = 10-7 atm, 1300 °C, master slag
batch “OS016” ...104
Figure 6.1.3. Copper distribution ratio at pO2 = 10-7 atm, 1300 °C, master slag
batch “OS016” ...105
Figure 6.1.4. Copper solubility in FCS slag in oxygen partial pressure range from iron saturation to Cu2O saturation (Yazawa et al., 1999) ...107 Figure 6.2.1. Tin distribution (LSn s/m) as a function of pO2 (atm) – 1300 °C
and Fe/SiO2 (w/w) ≈≈≈≈ 1 and CaO ≈≈≈ 12.9 wt%. ...110 ≈ Figure 6.2.2. Accepted results on tin distribution (LSn s/m) as a function of
pO2 (atm) – 1300 °C and Fe/SiO2 (w/w) ≈≈≈≈ 1 and CaO ≈≈≈≈ 12.9 wt%...111 Figure 6.2.3. Tin distribution (LSn s/m) as a function of pO2 (atm) – 1300 °C,
and Fe/SiO2 (w/w) ≈≈≈≈ 1.1 and CaO ≈≈≈ 20.5 wt%...113 ≈ Figure 6.2.4. Accepted results on tin distribution (LSn s/m) as a function of
oxygen partial pressure at 1300 °C and Fe/SiO2(w/w) ≈ 1.1 and
CaO ≈ 20.5 wt%...114
Figure 6.2.5. Indium distribution (LIn s/m) as a function of oxygen partial
pressure. ...117
Figure 6.2.6. Accepted results on indium distribution (LIns/m) as a function of
oxygen partial pressure pO2...118 Figure 6.3.1. Accepted results for LSn s/m as a function of wt% CaO at an
Fe/SiO2 (w/w) ratio of 0.86...121 Figure 6.3.2. Accepted results for LIn s/m as a function of wt% CaO at an
Figure 6.3.3. Accepted results for LCu s/m as a function of wt% CaO at an
Fe/SiO2 (w/w) ratio of 0.86...123
Figure 6.3.4. Accepted results for LSn s/m as a function of wt% CaO at an Fe/SiO2 (w/w) of 1.07. ...125
Figure 6.3.5. Accepted results for LIn s/m as a function of wt% CaO at an Fe/SiO2 (w/w) ratio of 1.07...125
Figure 6.3.6. Accepted results for LCu s/m as a function of wt% CaO at an Fe/SiO2 (w/w) ratio of 1.07...128
Figure 6.3.7. Combined data sets for LSn s/m as a function of wt% CaO. ...129
Figure 6.3.8. Combined data sets for LIn s/m as a function of wt% CaO...130
Figure 6.3.9. Combined data sets for LCu s/m as a function of wt% CaO...130
Figure 6.4.1. Accepted data for LSn s/m as a function of Fe/SiO2 (w/w) at 13 wt% CaO...135
Figure 6.4.2. Accepted data for LSn s/m as a function of Fe/SiO2 (w/w) at 13 wt% CaO...136
Figure 6.4.3. Accepted data for LIn s/m as a function of Fe/SiO2 (w/w) at 13 wt% CaO...137
Figure 6.4.4. Accepted data for LCu s/m as a function of Fe/SiO2 (w/w) at 13 wt% CaO...137
Figure 6.6.1. LSn s/m of FeOx-CaO-SiO2 phase diagram. ...140
Figure 6.6.2. LIn s/m of FeOx-CaO-SiO2 phase diagram...141
Figure 6.6.3. LCu s/m of FeOx-CaO-SiO2 phase diagram...141
Figure 6.6.4. Accepted results - Iso-LSn s/m lines of FeOx-CaO-SiO2 phase diagram. ...142
Figure 6.6.5. Accepted results - Iso-LIn lines of FeOx-CaO-SiO2 phase
diagram. ...143
Figure 6.6.6. Accepted results - Iso-LCu s/m lines of FeOx-CaO-SiO2 phase diagram. ...143
Figure 6.7.1. γSnO(l) as a function of wt% CaO with Fe/SiO2 (w/w) ratio between 0.86 – 1.07. ...151
Figure 6.7.2. γInO(g) as a function of wt% CaO with Fe/SiO2 (w/w) ratio between 0.86 – 1.07. ...151
Figure 6.7.3. γCuO0.5(l) as a function of wt% CaO with Fe/SiO2 (w/w) ratio between 0.86 – 1.07. ...152
Figure 6.7.4. Integer values of ȖSnO(l) on the copper-saturated FeOx-CaO-SiO2 phase diagram at 1300 oC. ...153
Figure 6.7.5. Integer values of ȖInO(g) on the copper-saturated FeOx-CaO-SiO2 phase diagram at 1300 oC. ...153
Figure 6.7.6. Integer values of ȖCuO0.5(l) on the copper-saturated FeOx-CaO-SiO2 phase diagram at 1300 oC. ...154
Figure 6.7.7. ȖSnO(l) in CaO-FeOx-SiO2 slag at 1300 ºC (Takeda and Yazawa, 1989). ...155
Figure 6.7.8. ȖCuO0.5(l) in CaO-FeOx-SiO2 slag at 1300 ºC and pO2 = 10-8 atm – 10-6 atm (Takeda and Yazawa, 1989). ...155
Figure 6.7.9. ȖInO(g) in CaO-FeOx-SiO2 slag at 1200 ºC and pO2 = 10-12 atm – 10-10 atm Values stated are x 107 (Hoang and Swinbourne, 2007). ...156
Figure 6.7.10. iso-ȖSnO(l) lines of FeOx-CaO-SiO2 phase diagram. ...156
Figure 6.7.11. iso-ȖInO(g) lines of FeOx-CaO-SiO2 phase diagram. ...157
Figure 7.2.1. Results of HSC computation modelling for copper distribution at
a low CaO content slag. ...162
Figure 7.2.2. Results of HSC computation modelling for lead distribution at a low CaO content slag. ...163
Figure 7.2.3. Results of HSC computation modelling for zinc distribution at a low CaO content slag. ...163
Figure 7.2.4. Results of HSC computation modelling for tin distribution at a low CaO content slag. ...164
Figure 7.2.5. Results of HSC computation modelling for indium distribution at a low CaO content slag. ...165
Figure 7.2.6. Results of HSC computation modelling for tin distribution at a high CaO content slag...166
Figure 7.2.7. Results of HSC computation modelling for indium distribution at a high CaO content slag. ...167
Figure 7.3.1. Equilibrium composition of metal phase of the oxidation stage. ...169
Figure 7.3.2. Lead distribution during the oxidation stage. ...170
Figure 7.3.3. Zinc distribution during the oxidation stage...170
Figure 7.3.4. Tin distribution during the oxidation stage...171
List of Tables
Table 2.1.1. WEEE Definition and its Variation...5
Table 2.1.2. WEEE Categories according EU Directive (UNEP, 2007) ...6
Table 2.1.3. Global WEEE production, disposal, recovery, and import/export estimates in millions of tonnes in 2010 (Pink B. (Australian Bureau Statistics), 2010, Zoeteman et al., 2010) ...7
Table 2.1.4. Composition of a Personal Desktop Computer (EMPA, 2009) ...9
Table 3.2.1. Comparison of slag types for copper processes (Ausmelt, 2006, Yazawa et al., 1999)...30
Table 3.4.1. Tin distribution between phases at the Montanwerke Brixlegg smelter (Woerz and Wallner, 1988)...39
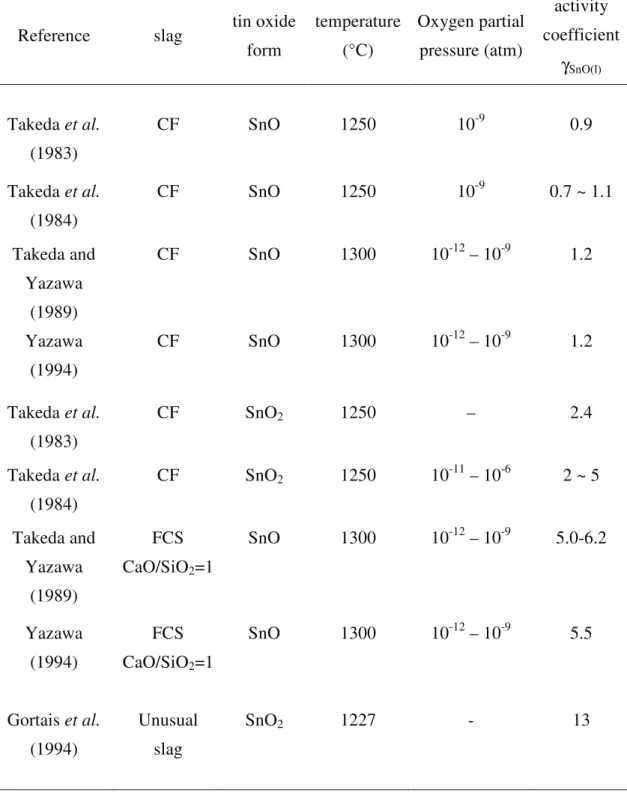
Table 3.4.2. Literature values for the limiting activity coefficient of tin in liquid Copper under the conditions specified...44
Table 3.4.3. The activity coefficient of tin oxide in iron silicate slag...47
Table 3.4.4. The activity coefficient of tin oxide in calcium ferrite slag and an unusual slag system...48
Table 3.5.1. Literature values for the limiting activity coefficient of indium in liquid ...64
Table 3.5.2. Comparison of the effect of slag composition on indium oxide activity coefficient. ...70
Table 5.2.1. CO2/CO ratios to product the required oxygen partial pressure. ...84
Table 5.2.2. EMF reading from the oxygen probe calibration ...86
Table 5.7.1. Minimum detection limit of the instrument for analysis...94
Table 5.8.1. Relative error and equilibrium constant (K) for the elements oxidation reactions (HSC Chemistry 5.1, 2002)...95
Table 5.8.2. The range of oxygen partial pressure – calculated with relative error of gas flow rate compare to value measured using oxygen probe ...96
Table 5.8.3. Absolute instrument errors ...97
Table 5.8.4. Analysis results of tin in slag and in copper metal and summary of error from analysis. ...98
Table 5.8.5. Analysis results of indium in slag and in copper metal and summary of error from analysis...99
Table 5.8.6. Total relative error in distribution ratio...101
Table 6.1.1. Distribution ratio at pO2 = 10-7 atm, 1300 °C, master slag batch “OS016”...103
Table 6.2.1. Tin distribution ratios as a function of oxygen partial pressure at 1300 °C ...109
Table 6.2.2. Average and standard deviation of LSns/m...111
Table 6.2.3. Tin distribution ratios as a function of oxygen partial pressure at 1300 °C ...112
Table 6.2.4. Average and standard deviation of LSns/m...114
Table 6.2.5. Indium distribution ratio, 1300 °C and Fe/SiO2 (w/w) ≈≈ 1 and ≈≈ CaO ≈≈≈≈ 12.9 wt%...116
Table 6.3.1. LM s/m at Fe/SiO2 (w/w) of 0.86 ± 0.043 with variable wt% CaO. ...122
Table 6.3.2. LM s/m at Fe/SiO2 (w/w) of 1.07 ± 0.053 with variable wt% CaO. ...126
Table 6.7.1. Calculated results of activity coefficient, γM...148
Table 7.1.1. Assumed composition of the feed to the reduction stage...160
Table 7.1.2. Activity coefficient data for the reduction stage models. ...161
Table 7.3.1. Black copper input to the reduction stage. ...168
List of Symbols
Symbol Description
a the distance between the cation (in Gilchrist ratio) – equivalent to the sum of the radii of the ions. aM activity of metal M
E sensor electromotive force in mV
F Faraday constant
f(ionic) ionic bond fraction
γoM limiting activity coefficient of metal M
γM activity coefficient of metal M
∆GEX Gibbs excess free energy
K equilibrium constant
LMs/m distribution ratio of metal M between slag to metal
MM atomic weight of metal M
n number of charges (in Nernst equation)
nT total number of moles of monocation constituents in 100 g in
each phase
NM mole fraction of metal M
2
O
p oxygen partial pressure
R gas constant
T temperature in Kelvin
XA Pauling electronegativity of oxygen
XC electronegativity of the metal
z charge on the cation (in Gilchrist ratio) z/a2 Gilchrist ratio
( )
represents the value in slag phase[ ]
represents the value in metal phase1. Introduction
Electronic equipment plays a major role in increasing our standard of living, but developments in technology are so rapid that electronic goods quickly become obsolete and must be replaced. The superseded equipment becomes waste and is often referred to as WEEE – waste electrical and electronic equipment.
According to the European Union (EU) Directive 2002/96/ECD (European Parliament and of the Council, 2003) WEEE is defined as;
“Electrical or electronic equipment which is waste. . . including all components, sub-assemblies and consumables, which are part of the product at the time of discarding.”
WEEE is a very serious emerging problem because the volume of it being generated is so large and is increasing rapidly. It constitutes one of the fastest growing categories of consumer waste, growing at a rate of 3-5% per annum which is three times faster than that of any other municipal waste category (Widmer et al., 2005).
The cheapest way to deal with WEEE is to dispose of it in landfill close to the source of supply, but many governments now limit or prohibit this practice. Landfilling of WEEE has a negative impact on the environment due to the leaching of harmful substances such as lead, mercury, arsenic, and cadmium from the waste (Zoeteman et al., 2010, Puckett et al., 2002).
WEEE can also be viewed as an “urban ore” because it is an excellent resource of a wide range of materials. It contains more than 60 different substances, including 40 elements from the Periodic Table and many of these elements are scarce and very valuable. Disposing of WEEE to landfill disperses many of these valuable elements so widely that recovery becomes impossible. Lost metals need to be replaced from natural resources in the earth’s crust, but many of these resources are rapidly being depleted. A significant contribution to the sustainability of metal production can be made if the metals in WEEE are recycled.
Reprocessing WEEE to recover valuable metals is not a simple matter. Aside from the practical difficulties of collection and sorting from non-valuable municipal waste, WEEE itself is a complex heterogeneous mixture of metallic and non-metallic substances. Components containing valuable metals are bonded strongly to other components which have little value. Reprocessing WEEE is currently dominated by pyrometallurgical methods (Antrekowitsch et al., 2006) and this is likely to remain the case for many years to come. 'However, some of the materials in WEEE can adversely affect processing operations e.g. aluminium, lithium, titanium and barium very adversely affect slag properties e.g. raise the liquidus temperature and/or viscosity and in the case of lithium, make the slag more corrosive towards refractories.
There is another significant issue relating to WEEE which makes the optimal design of smelting processes for WEEE difficult. The combination of elements in WEEE does not match that in common primary mineral concentrates, for which smelting technology has been optimised over many years and for which a large database of information has accumulated. Little information exists for the separation of the combinations of elements in WEEE. This requires a rethinking of traditional processing techniques, which must be based on knowledge of how these unusual minor elements distribute between phases during smelting.
WEEE can be smelted in operations whose primary feed is copper concentrates, however such smelters are sited close to the mines and so are often remote from large cities which are the source of WEEE. Transporting WEEE large distances is uneconomic. A more attractive way to reprocess WEEE and minimise the transport barrier is to incorporate it into secondary copper smelting operations. These recycling plants are close to large cities, which are the source of general metallic scrap. The first stage of reprocessing involves reduction because a large part of the scrap feed is oxidic dross materials. The copper produced contains many of the other elements in the feed and is termed “black copper”. Some partitioning of elements occurs during reduction, some during the next oxidation stage and some during final electrorefining of the copper. Partition of elements into slag often means their irretrievable loss so processes must be designed to minimise this.
In this thesis the behaviour of two metals of interest in WEEE, under black copper smelting conditions, will be investigated. The elements chosen are tin and indium because both are valuable and the natural supply of indium in particular is very small. Tin is the more common metal, so limited distribution data for it exists and this will enable validation of the experimental technique used. Indium is much rarer and is never recovered in primary copper smelters, so no data is available regarding its distribution behaviour. This data will constitute the novel contribution of this work to the existing body of knowledge.
The classical three phase equilibration technique was chosen for this work. Copper and a slag of chosen composition are equilibrated in a small crucible in contact with a gas phase of controlled oxygen partial pressure. The temperature and oxygen partial pressure are those appropriate to black copper smelting. A very small amount of tin or indium is initially added to either the copper or the slag. After equilibration the sample is cooled and the copper and slag analysed. Entrainment of one phase in the other is one significant source of difficulty with this technique, but there are other problems and they will be examined and their impact on the results considered.
Minor element distribution data alone is useful for process design, but the data can be manipulated to yield the activity coefficient of the minor element oxide in the slag provided that the limiting activity coefficient of the minor element in copper is known. The reliability of this data will be assessed in this thesis. Once the activity coefficients of the minor element oxides in slag are known then computational thermodynamics modelling can be employed to explore the effect of changes in processing parameters on the recovery of the minor elements. This will be demonstrated for tin and indium during black copper smelting by examining the effect of changes in slag composition on tin and indium recovery.
Activity coefficient data for oxides in slags also provides fundamental knowledge which increases our understanding of the solution thermodynamics of slags and in particular of the nature of the interactions between species in slags. As such this work also contributes to theoretical understanding.
2. Literature Review 1
2.1.
WEEE/E-Waste
2.1.1 Definitions
WEEE, e-waste and e-scrap are often used interchangeably as common abbreviations for electronic waste. However, Lehner (2011) distinguishes between WEEE, e-waste and e-scrap. Sinha-Khetriwal et.al (2006) describe WEEE simply as the electronic items that consumers dispose of after those items reach the end of their useful life. Different countries have their own prescriptive definitions and interpretations of the terms WEEE / e-waste / e-scrap. Table 2.1.1 gives the three definitions by different initiatives, conventions, agencies, NGOs (non-government organisations) and countries. The definition used is important in connection with reported collection figures. In this thesis, the definition according to the European Union (EU) Directive, referenced to the Basel Convention, is going to be used since this is the most widely accepted definition.
WEEE, according to the EU Directive, consists of unwanted electrical and electronic equipment, including the components, subassemblies and consumables of the product at the time of discarding. This waste includes equipment which depends on the presence of electric currents or electromagnetic fields to work and/or equipment for the generation, transfer and measurement of such currents and fields; and those that have voltage rating below 1000V AC or 1500V DC (UNEP, 2007). The voltage limits are intended to ensure that large industrial equipment is not covered as WEEE, but includes all other appliances run by electricity, from large household devices to consumer electronics to computers which have reached the end of their life and/or are no longer wanted. These technologies are concentrated in large cities and so WEEE is generated mostly as part of consumer waste in such cities.
Table 2.1.1. WEEE Definition and its Variation
Reference Definition
EU E-WASTE Directive (European Parliament and of the Council, 2003)
“Electrical or electronic equipment which is waste. . . including all components, sub-assemblies and consumables, which are part of the product at the time of discarding.” Directive 75/442/EEC, Article 1(a) defines “waste” as “any substance or object, which the holder disposes of or is required to dispose of pursuant to the provisions of national law in force.”
Basel Action Network – BAN
(Puckett et al., 2002)
“E-Waste encompasses a broad and growing range of electronic devices ranging from large household devices such as refrigerators, air conditioners, cell phones, personal stereos, and consumer electronics to computers which have been discarded by their user." Organisation for Economic
Cooperation and Development – OECD (OECD, 2001)
“Any appliance using an electric power supply that has reached its end-of-life.”
StEP Initiative (StEP, 2011)
E-Waste is a term used to cover almost all types of electrical and electronic equipment that has or could enter the waste stream. It includes almost any household or business item with circuitry or electrical components with power or battery supply.
Australia (1800ewaste, 2009)
There is no specific definition of E-waste/ WEEE in law. It is generally referred to as all old technology, cluttering your home, garages and landfill, either in a state of disrepair, obsolete, or simply something that has been replaced by its newer, shinier model.
USA (UNEP, 2007)
According to USEPA, electronic products that are “near” or at the “end of their useful life” are referred to as “e-waste” or “e-scrap.” Recyclers prefer the term “e-scrap” since “waste” refers only to what is left after the product has been reused, recovered or recycled.
Lehner (2011)
e-waste as defined by North American legislation does not include large household goods, etc)
e-scrap is the metal containing fraction from WEEE or e-waste sent/traded to specialised smelters for end-processing.
The EU Directive has further classified electrical and electronic equipment into ten categories, as listed in Table 2.1.2. According to Widmer (2005), categories 1 to 4 constitute about 95% or more of WEEE generated and these four categories are those that most countries count in the total of WEEE they generate.
Table 2.1.2. WEEE Categories according EU Directive (UNEP, 2007)
No Category No Category
1 Large household appliances 6 Electrical and electronic tools 2 Small household appliances 7 Toys, leisure and sports equipment 3 IT and telecommunications
equipment 8 Medical devices
4 Consumer equipment 9 Monitoring and control instruments
5 Lighting equipment 10 Automatic dispensers
2.1.2 Growth of WEEE
WEEE is a major emerging problem because the volume being generated is so large. In the European Union WEEE constitutes about 8% of municipal waste; in USA, it accounts for 1-3% of municipal waste, while in other developed countries it constitutes on average 2% of total solid waste. Currently, available data on WEEE is limited and estimation techniques are required to predict the amount of WEEE generated globally. Estimation and comparison of the total amount of WEEE generated in various countries is made difficult because WEEE streams are not consistently defined and monitored (example Table 2.1.1). Table 2.1.3 gives an estimation of global WEEE production, disposal, recovery, and import/export in 2010.
Table 2.1.3 shows some interesting points on WEEE flows in different countries: • in USA and Australia, more than half of WEEE produced is landfilled, stored,
other countries. This is an environmentally unacceptable and unsustainable practice.
• in India and Africa, the quantity of WEEE being landfilled, stored and incinerated is larger than that being produced. This is because WEEE is being exported to these countries.
• in the EU-25 and Japan, the amount of WEEE being landfilled, stored and incinerated is small compared to that being produced.
Table 2.1.3. Global WEEE production, disposal, recovery, and import/export estimates in millions of tonnes in 2010 (Pink B. (Australian Bureau Statistics), 2010, Zoeteman et al., 2010)
Country Annual household production landfilling, storage, & incineration domestic recovery annual export annual import USA 8.4 5.7 0.42 2.3 - EU-25 8.9 1.4 5.9 1.6 - Japan 4.0 0.6 2.8 0.59 - China 5.7 4.1 4.2 - 2.6 India 0.66 0.95 0.68 - 0.97 West Africa 0.07 0.47 0.21 - 0.61 Australia 1.02 0.49 na na na Thailand 0.06 na na na na Total 28.8 13.7 14.2 4.49 4.18
The global WEEE generation rate is accelerating quickly due to market growth for these technologies. The market is far from saturated and as the world shifts to the so- called “digital divide” WEEE grows exponentially because the market for those products is booming (Kuehr, 2010). Cui & Forssberg (2003) stated that in Europe, the production of electrical and electronic equipment is one of the fastest growing
business sectors. Another reason that the WEEE generation rate is growing so quickly is that rapid innovation is making the lifespan of these digital products shorter, and this is especially true for information communication technology (ICT) products and office equipment, flat screen televisions and computer monitors. As an example, the growth rate of ICT demand in China was 22% between 2000 and 2005 and the lifespan of computer CPUs in 1997 was 4 – 6 years but by 2005 it had dropped to only 2 years (Culver, 2005). High demand for electrical products also leads to lower prices for many electrical goods, which increases global sales for these products (Kuehr, 2010).
As a result of the above issues, in the European Union the growth rate of WEEE is about five times as fast as the general municipal waste growth rates, with WEEE generation growing at a rate 3-5% per year (Widmer et al., 2005). In Australia WEEE is growing at about three times the municipal waste rate. In countries like China and India WEEE is growing at an exponential pace due to increasing “market penetration” and the “high obsolescence rate” of electronic products (UNEP, 2007).
2.1.3 Composition of WEEE
WEEE is a heterogeneous combination of non-metallic materials such as plastics, rubber, wood, ceramics and glass, and metallic materials, both ferrous and non-ferrous. An example of WEEE is a personal desktop computer, whose typical composition is shown in Table 2.1.4. A personal desktop computer is taken as an example because it contains printed wire boards (PWBs) which have the most complex mix of substances (Schluep et al., 2009). WEEE comprises more than just personal computers so the typical composition of WEEE is different to that of a personal desktop computer. Unfortunately there are very limited resources detailing the composition of WEEE so generalisations have to be resorted to. WEEE is said (EMPA, 2009, Babu et al., 2007) to contain;
• 65-70 wt% of metals, • 19-21 wt% of plastics and • 5 wt% glass.
Table 2.1.4. Composition of a Personal Desktop Computer (EMPA, 2009) Constituent Substances Composition (%) Constituent Substances Composition (ppm) Constituent Substances Composition (ppm)
Silica 24.9 Manganese 300 Mercury 20 Plastics 23.0 Silver 200 Germanium 20 Iron 20.5 Tantalum 200 Indium 20 Aluminium 14.2 Beryllium 200 Gold 20 Copper 6.9 Titanium 200 Ruthenium 20 Lead 6.3 Cobalt 200 Selenium 20 Zinc 2.2 Antimony 90 Gallium 10 Tin 1.0 Cadmium 90 Arsernic 10 Nickel 0.85 Bismuth 60
Barium 0.03 Chromium 60
Steel comprises almost a half of the mass of WEEE and non-ferrous metals make up about 13% of European Union WEEE. WEEE may contain more than 60 different substances, including 40 elements from the Periodic Table. The non-ferrous elements in WEEE can be divided (Wilkinson et al., 2001) into;
• those that are “valuable” e.g. copper, gold, silver, platinum, tin, & indium, and
• those that are “hazardous” e.g. lead, cadmium, arsenic, and mercury
The non-metallic components, mostly plastic, contain flame retardants which are often bromine and antimony compounds which are also hazardous.
The composition of WEEE also changes from source to source and over relatively short time periods from any given source. However, some general observations can be made (Babu et al., 2007, Hagelüken and Kerckhoven, 2006, Brusselaers et al., 2006);
• “brown goods”, which are light electronic household appliances such as televisions, DVD players and computers, contain a high percentage of valuable metals,
• “white goods”, which are major household electrical appliances such as refrigerators, stoves, and dishwashers contain much less valuable metals than brown goods,
• commercial IT and telecommunication systems usually contain a higher percentage of valuable metals than both brown and white goods,
• older equipment contains a higher proportion of valuable elements than modern equipment, but unfortunately also contains higher concentrations of hazardous substances.
2.1.4 Disposal of WEEE
It has already been noted on Table 2.1.3 that, currently, WEEE has the following destinations;
• storage in homes or warehouses, • disposal in municipal landfill sites,
• incineration in municipal solid waste disposal facilities,
• illegal export into regions with inappropriate recycling systems, and • returned to the manufacturer or recycling facilities to be recycled.
The UNEP reported that in USA consumers have two to three obsolete computers stored in their homes awaiting eventual disposal. Storage is clearly not a final destination for WEEE.
The cheapest way to deal with WEEE is to dispose of it in landfill close to the source of supply. Landfilling of WEEE has a negative impact on the environment from the leaching of harmful substances into the water table. Landfilling WEEE is also
contrary to the principles of sustainability in that it takes metals out of the materials cycle, so many countries have started to construct legislation to reduce WEEE disposal to landfills (Zoeteman et al., 2010). Although it has been argued that landfilling WEEE makes landfills the “mines of the future”, the carryover of impurities, the wide dispersal of metals and their dilution makes it almost impossible to recover them (Reuter et al., 2005). As a result, land-filling shortens the remaining years of availability of metals and worsens the rates of resource depletion of these metals. In USA in 2005 about 78% of WEEE was landfilled, while 20% was recycled and 2% was incinerated. In Germany, separate collection of WEEE is required and public collection points for WEEE are available free of charge, but WEEE is still often disposed of together with municipal waste (Elektrogesetz, 2010). Chancerel (2010) reported that less than 60% of WEEE was actually collected and directed into recycling.
Another way to dispose of WEEE is to export it to developing countries. This happens because environmental and occupational regulations are not well enforced in some developing countries and the labour costs are much lower than in industrialised countries. Although exporting WEEE may be cost effective, it is dangerous due to the toxic nature of WEEE and is therefore subject to legislation. An example of an international agreement to control the movement and reduce the transfer of hazardous wastes across national borders is the ‘Basel Convention’, which came into force in 1992 (Babu et al., 2007, Zoeteman et al., 2010). The Convention puts an obligation on exporting countries to ensure that the waste can be appropriately managed in the importing countries. In 1994 there was a consensus for a total ban on all exports of hazardous wastes from rich OECD (Organization for Economic Cooperation and Development) countries to non-OECD countries. This consensus, the Basel Ban, was to come into force in December 1997, however many countries and businesses continue to sabotage and avoid this agreement (Puckett, 1997) and by 2005 the Basel Ban Amendment had still not come into force (UNEP, 2005). Despite these laws and global agreements, some countries still ship and dump hazardous waste illegally to third world countries. The United States, one of the non-ratifying countries, ships 50% to 80% of their WEEE to destinations like China (Puckett et al., 2002). Recently there was a shipment of used lead acid batteries and cathode ray tube monitors from
Canada to HongKong and China by the Jieyang Sigma Metal Plastic Incorporation. The company was fined only $30,000 for this breach (Canada NewsWire, 2011).
The only way to address the sustainability problem resulting from the landfilling of WEEE is to implement a system for recycling and reprocessing. In order for recycling or reprocessing to be practiced, WEEE has to be collected. The Extended Producer Responsibility (EPR) is an environmental protection strategy to reach the environmental objective of a decreased total impact from a product by making the manufacturer of the product responsible for its entire life cycle, especially for taking back, recycling, and final disposal of the product (Lindhqvist, 2000).
Recycling metals from WEEE can reduce the amount of primary ores that must be mined and processed and so conserves scarce resources. Mining primary metals, especially for precious metals where the metals concentration is low, uses considerable amounts of land for mining, creates waste water and sulphur dioxide (SO2), consumes a large amount of energy and creates large carbon dioxide (CO2)
emissions. Reprocessing WEEE can minimise the potential harm to humans and/or the environment. The leakage and emission of toxic elements is minimised by bringing WEEE back into the metals cycle. Moreover, WEEE reprocessing provides the opportunity to reduce overall energy consumption due to metals essentially only having to be remelted.
CO2 emission produced annually to produce WEEE metals is a total of 23.4 million
tonnes per annum. This total value does not include CO2 emissions from other metals
used in electrical and electronic equipment like steel, nickel, aluminium or the CO2
emissions arising from the manufacturing of the equipment. Previous research by Hageluken (2008) showed that recovering metals by recycling generates less CO2
emissions. As an example, the production of 1 kg of aluminium by recycling uses 1/10 of the energy required for its primary production. It also prevents the creation of 1.3 kg red mud residue from bauxite processing, 2 kg of CO2 emissions, and 0.011 kg
2.1.5 Health and Environmental Hazards
The amounts of toxic elements in WEEE are usually beyond the threshold quantities specified in legislation. As a result, WEEE is officially classified as a hazardous waste and if it is disposed of without any controls, it will have negative impacts on the environment and on human health (Puckett et al., 2002).
The landfilling and incineration of WEEE causes the leakage and emission of toxic elements to the environment. Puckett (2002) reported that 70% of heavy metals in US landfills comes from WEEE while Rotter (2002) reported that about 47% of lead, 50% of cadmium and 31% of mercury in municipal waste is from WEEE. Previous research by Brigden (2005) and Puckett (2002) on the impact of WEEE on the environment states that landfilling cathode ray tubes (CRTs) causes leaching of lead and other heavy metals into ground water and incinerating WEEE, which contains brominated flame retardants, creates dangerous dioxins and furans emissions. Other materials that can create problems during incineration are arsenic, asbestos and nickel because these substances may act as catalysts to increase the formation of dioxins (UNEP, 2007). UNEP (2007) also reported that river pollution in China from excessive releases of metals such as arsenic, chromium, silver, cadmium and lead from WEEE may cause brain damage, allergic reactions and cancer, and soil pollution by polycyclic aromatic hydrocarbons (PAH) may cause difficulty in reproduction, birth defects, cancer, liver, and skin diseases. Furthermore, they also reported on air pollution near a WEEE disposal site where there were dioxin concentrations 15-56 times higher than the WHO recommended maximum. Thus, landfilling WEEE as part of municipal waste and incinerating WEEE is environmentally unacceptable and unsustainable.
2.1.6 WEEE as a Resource
WEEE is potentially an excellent resource for a wide range of materials. However, landfilling of WEEE results in the dissipation of valuable non-renewable metals so that they cannot be easily recovered and returned to the materials cycle. This increases the rates of resource depletion. Recovering valuable metals from WEEE
through reprocessing is necessary for increasing the sustainability of the world’s increasingly scarce metal resources.
Some metals are present in WEEE at higher concentration (10-100 ppm) than they are in typical ores (1-10 ppm) and they are easier and cheaper to access, compared to mining ores, if a collection system is in place. For example, one tonne of phone handsets without the battery contains 130 kg of copper, 3.5 kg of silver, 0.34 kg of gold, and 0.14 kg of palladium. A typical personal computer (PC) or laptop contains 500 g of copper, 1000 mg of silver, 220 mg of gold, and 80 mg of palladium per tonne. Furthermore, a Li-ion mobile phone battery contains 3.8 g of cobalt and a PC/laptop battery contains 65 g of cobalt. Although these amounts seem small, a huge number of units are sold, i.e. 1.2 billion mobile phones in 2007 and 255 million PC/laptop computers in 2007, so the amount of contained metals is very significant. They are equivalent to 15% of annual world mine production of cobalt, 13% of palladium, 3% of gold and silver and 1% of copper (StEP, 2011, Schluep et al., 2009). The growth rates of other electronic devices such as liquid crystal displays (LCDs) and televisions, electrical and electronic devices are a major driver of the demand for, and prices of, some metals. For example, copper used for cables and wires and tin used for solders make up about 30% of the world’s demand of these metals, while indium used for LCD glass, solder, transparent conductive layers, and semiconductors makes up almost 80% of the world’s demand for indium. The monetary value of the annual demand by electrical and electronic equipment for metals represents USD 45 billion based on 2007 average prices (Schluep et al., 2009).
It is clear that WEEE represents a source of valuable metals that is easier to access than ore in the earth’s crust, and has a higher grade of many of these metals than are found in most ores. If unrecovered, WEEE is a sink for many scarce metals that will lead to their early depletion so WEEE reprocessing for their recovery is essential.
2.2.
Current Treatment of WEEE
In order to realise the opportunities associated with WEEE, an appropriate recycling chain system including collection, dismantling/preprocessing, and metal
recycling/end processing is required. The efficiency of the recycling chain system depends on how well each step is managed.
The first step, collection, is obviously important because it determines the amount of the material that is available for recycling. Dismantling/preprocessing through mechanical separation is necessary to liberate and concentrate the valuable metals. Preprocessing is also important to remove and to safely treat hazardous substances (Hagelüken and Kerckhoven, 2006). The various fractions obtained from the preprocessing stage are enriched in certain materials. These fractions are then directed to further treatment by appropriate pyrometallurgical or hydrometallurgical methods. The preprocessing stage is not always required, for example small and complex electronic devices like mobile phones and MP3 players can be treated directly by metal recycling/final processing after the removal of the battery and device housing.
Pyrometallurgical processes include incineration, smelting, melting and reactions in a gas phase at high temperatures. In these processes the WEEE is charged to a furnace or a molten bath and the refractory oxides form a slag phase together with some metal oxides (Cui and Zhang, 2008). The valuable metals report to the molten metal. Hydrometallurgical treatment includes acid or caustic leaching of solid material, isolating and concentrating the metal of interest by solvent extraction, precipitation, cementation, ion exchange, filtration and distillation (Antrekowitsch et al., 2006).
Each of these treatment methods has advantages and disadvantages. With pyrometallurgical treatment, often more than one metal can be obtained and there is no problem dealing with composite materials because they are burnt in the furnace or in a molten bath during the melting process. However, the disadvantages of pyrometallurgical processes include the generation of waste gases and flue dusts which contain toxic elements, although an offgas handling system can be used to overcome this issue. Pyrometallurgical processes also only achieve a partial separation of metals (Cui and Zhang, 2008). Another disadvantage is that noble metals stay for a long time in the process and are only recovered at the end, so the realisation of their value is delayed and their investment value is decreased. Also, less noble metals like aluminium and iron cannot be directly recovered with these
processes as they are transferred into the slag. Hydrometallurgy processes lead to high purity metals and provide the possibility to selectively leach metals using different solvents. The disadvantages of hydrometallurgy methods are the high volumes of leach solutions, which are often corrosive and toxic, and also high volumes of waste water. Another disadvantage is that there are increased metal losses when complex composite materials are treated (Antrekowitsch et al., 2006).
Nowadays WEEE treatment to recover valuable metals is dominated by pyrometallurgical methods (Antrekowitsch et al., 2006). The outputs from the pretreatment stage are directed to three main destinations;
• steel plants take the ferrous fractions for the recovery of iron, • secondary aluminium producers take the aluminium fractions, and
• integrated non-ferrous metals smelters takes copper/lead fractions, circuit boards, and other fractions containing precious metals.
Both copper and lead are the main elements found in WEEE after preprocessing, so WEEE can be best be sent to an integrated smelter that accepts mostly lead scrap, or copper scrap. A copper smelter has many inherent advantages over a lead smelter;
• a copper smelter produces much less toxic fumes than a lead smelter, so a smelter sited near the population centres which provide WEEE is more environmentally and socially acceptable when it is based on copper recycling,
• recovery of precious metals from copper is convenient because electrorefining, which will always be needed to produce saleable copper, concentrates the precious metals in anode slime, from which they are readily recovered. Lead electrorefining is possible, although it uses a very corrosive electrolyte, but lead is usually refined by multistep pyrometallurgical methods which are accompanied by toxic fume emissions,
• lead scrap will mostly comprise used lead-acid batteries which contain lead sulphate. Smelting batteries is complex, uses fluxes like sodium carbonate
and produces environmentally hazardous solid waste products. However, the lead produced can be directly recycled to battery manufacturers. Adding WEEE would force the secondary lead smelter to refine the lead, and so greatly increase their costs.
2.3.
Reprocessing of WEEE with Copper Materials
WEEE can conveniently be fed into primary or secondary copper smelters, along with the copper-bearing raw materials.
Primary copper smelters are usually located far from large cities while WEEE originates almost entirely in those cities. The long distance between cities and primary smelters, and the cost of transporting the WEEE, reduces the economic attractiveness of processing WEEE in the primary smelter. Australia is especially affected by this problem because it has a small population spread over a very large area and its two primary smelters are in very remote locations. Moreover, BHP Billiton’s Roxby Downs smelter is a direct-to-blister flash smelting operation which cannot process much scrap due to the nature of the smelting process. Xstrata’s Mt. Isa smelter could consume WEEE in their Peirce-Smith converters but it is 1800 km from the nearest large city and, in any case, will be closed in early 2016 (Schwarten, 2011).
Where a smelter is in close proximity to population centres then WEEE can be economically fed in to the process at the converting stage. Xstrata’s Horne Smelter in Rouyn-Noranda, Quebec, is a good example. It is located close to Ottawa, Toronto and Montreal – and also not far from the major cities in the USA north-east like Chicago and New York - and has become the world's largest processor of WEEE. The valuable metals in WEEE report to the copper anodes, which are shipped to Montreal for electrorefining and recovery of those precious metals (Xstrata Copper, 2011).
Secondary copper smelters, which process copper-bearing scrap, have a significant advantage in that they can be co-located with large population centres and are economic at much smaller throughputs than primary smelters. They can process a wide variety of copper-bearing wastes, including WEEE, and produce refined copper together with precious metals, base metals and other specialty metals. They can operate in one of two processing styles;
• a sulphur-based route, where copper matte is formed, and then converted, and
• a black copper route, where reduction produces crude copper which is then refined by oxidation in a converter.
The two processes routes will be explained further in Section 3.1.
A good example of secondary copper smelting is Umicore at Hoboken Belgium. Umicore is one of the world’s largest precious metal recycling facilities. In 2005 Umicore invested heavily in a new metallurgical operation whose focus shifted from concentrates as feed to recyclable materials. Hageluken (2005) said that the innovative plant increased productivity, had greater efficiency and maximised metal recovery rates.
Another good example of a secondary copper smelting operation is that which is located at Boliden’s Ronnskar Smelter near Skelleftea in Northern Sweden. Sweden is a developed and densely populated country and a strong connection with the domestic market gives Ronnskar Smelter access to WEEE which has experienced minimum transport. Recycling WEEE provides a higher margin of profitability compared to traditional copper production (BOLIDEN AB, 2011).
More example of a secondary copper smelter are Kayser recycling system operated by Aurubis Lunen and Montanwerke Brixlegg AG smelter in Austria. Kayser recycling system is able to process materials with low copper, precious metal contents, and complex materials (AURUBIS, 2011).
Metallo-Chimique N.V. operate a secondary smelter at Beerse in Belgium and a smaller smelter at Vizcaya in Spain which produces only black copper granules and ships it to Beerse for further refining (METALLO, 2011).
2.4.
Conclusions Literature Review 1
The amount of WEEE being generated is already large, and is increasing rapidly. The disposal of WEEE into landfill is no longer acceptable in most countries because WEEE contains toxic materials which cause environmental damage when they leach from landfill. However, WEEE contains significant amounts of valuable metals and thus represents a potential resource for these metals. Recycling WEEE reduces the amount of primary ores that must be mined and processed and so conserves increasingly scarce resources. It also reduces overall energy consumption because recycling consumes less energy than primary smelting. WEEE reprocessing is currently dominated by pyrometallurgical methods. An attractive option for reprocessing WEEE is to add it to the feed of a secondary copper smelter, which provides advantage in terms of location and economically.
3. Literature Review 2
3.1.
Secondary Copper Smelting
One attractive option for reprocessing WEEE to recover valuable metals is to add it to the feed to a secondary copper smelter. Primary copper smelters deal with concentrates in which impurities like sulphur and iron are removed by oxidation due to their greater affinity for oxygen. Most other impurities, such as lead, arsenic and antimony are only present in relatively low contents. Secondary copper smelters deal with highly contaminated copper scrap in which impurities like iron, zinc, lead and tin are present in significant amounts, totalling up to more than 30% of the feed. The complexity of the feed makes refining expensive and difficult (Kryczun and Melcher, 1978).
Secondary copper smelters cope with the complexity of their feeds by operating in one of two distinct processing styles;
• they can utilise a sulphur-source to produce a copper matte and a slag. Lead in the feed will report to the slag, from which it is recovered by reduction e.g. in a blast furnace. The copper matte is then converted to copper. During converting, elements distribute between the fume, slag and copper. This method has the advantage of quickly separating precious metals from base metals and it provides a number of separation opportunities for minor metals. It has the disadvantage of producing sulphur dioxide in the waste gases and this requires sulphur capture facilities e.g. a sulphuric acid plant. This method is typified by the Umicore plant near Antwerp in Belgium (Vanbellen and Chintinne, 2007),
• they can accept metallic copper scrap and oxidic copper drosses etc. and reduce them with carbon to impure “black” copper, followed by oxidation of the black copper to remove many of the impurities as shown in Figure 3.1.1.
This is the most popular method and is practiced by the Montanwerke Brixlegg AG smelter in Austria (Woerz and Wallner, 1988), Boliden’s Ronnskar Smelter in Northern Sweden and the Aurubis Lünen smelter in Germany (AURUBIS, 2011). If mostly metallic copper scrap is available, with very little oxide materials, then the reduction and oxidation stages can be reversed.
Figure 3.1.1. Simplified flowsheet of the black copper smelter.
Table 2.1.4 shows that typical WEEE does not contain sulphur so the first method based on sulphur chemistry requires a sulphur-bearing material in the inputs. The second method, the black copper route, can take the normal scrap composition which consists mostly of metals and metal oxides and so it is the preferred method. An advantage of secondary copper smelting is al