ESSAYS IN LABOR AND EDUCATION ECONOMICS
A Dissertation
Presented to the Faculty of the Graduate School of Cornell University
In Partial Fulfillment of the Requirements for the Degree of Doctor of Philosophy
by
Nolan Andrew Kopkin May 2013
iii
ESSAYS IN LABOR AND EDUCATION ECONOMICS Nolan Andrew Kopkin, Ph. D.
Cornell University 2013
In chapter 1, I explore the relationship between discrimination towards blacks and the black-white self-employment rate gap, and provide the first direct empirical evidence that discrimination negatively impacts black self-employment. As a proxy for discrimination, I construct a measure of prejudicial attitudes using responses from the 1993-2010 General Social Survey. After compiling an index of prejudicial attitudes, I estimate the relationship between self-employment and this index of prejudicial attitudes using the 2005-2009 American Community Survey. I find that an amount of prejudice equal to the difference in the least and most prejudiced census divisions increases the black-white self-employment rate gap by 24.2%-34.5%.
In chapter 2, I examine how income tax rates affect the labor migration decisions of NBA free agents. By using a dataset of professional basketball players' free agent contracts from the National Basketball Association (NBA) between the 2001-2002 and 2007-2008 seasons, I am able to identify the effect that changes in income tax rates have on the labor migration decisions of NBA free agents. I find that an increase in the marginal income tax rate faced by NBA basketball players that play for a given team leads to a decrease in the average skill of the NBA free agents that migrate to that team.
In chapter 3, I study how a nutritional improvement in school provided meals affects student outcomes. There has recently been an emphasis on decreasing childhood obesity and increasing the health of schoolchildren in the United States. Improving the nutritional content of school meals is one potential mechanism for achieving these goals. In addition to direct health benefits, these interventions may provide positive effects on students’ academic and behavioral outcomes. In 2007, the Buffalo Public School District implemented the Healthier Options for Public Schoolchildren (HOPS) program, which increased the nutritional content of food provided at school. I find that students in HOPS schools experienced a statistically significant increase in
iv
standardized math test scores, particularly among low ability, high income, and female students. Additionally, I find that the intervention had no impact on standardized English test scores, attendance, or suspensions.
v
BIOGRAPHICAL SKETCH
Nolan Andrew Kopkin was an economics Ph. D. student at Cornell University from August 2007 to May 2013. His research interests include labor economics, applied econometrics, and the economics of education. Additionally, Nolan has a strong interest in the economics of discrimination. In August 2013, he will join the faculty in the Africology Department at the University of Wisconsin – Milwaukee. As an undergraduate at the University of Florida, Nolan received a double-major in Economics and Mathematics, and minored in Statistics and Business Administration. Prior to graduate school, Nolan worked for a year at the Bureau of Labor Statistics in Washington, DC.
vi
vii
ACKNOWLEDGMENTS
I would like to especially thank the members of my graduate committee: Lawrence Kahn, Kevin Hallock, and Michael Lovenheim, who have continued to push me to improve and expand upon my research. I also wish to thank John Abowd, John Bishop, Diane Burton, Damon Clark, Ronald Ehrenberg, Freeha Fatima, George Jakubson, David Just, Matthew Freedman, Genevieve K. Landers, Robert Hutchens, Richard Mansfield, Mirinda Martin, Jordan Matsudaira, Emily Owens, Victoria Prowse, and other attendees of the Cornell University labor economics seminar and economics of education seminar for their many helpful comments. I would also like to thank NORC for the provision of the GSS Sensitive Data Files that are essential to Chapter 1, and the Buffalo Public School District and Bridget Wood for the restricted-use data and information about the HOPS program that are essential to Chapter 3.
viii
TABLE OF CONTENTS
Chapter 1: Does Discrimination Affect Black Entrepreneurship ...1
1.1 Introduction ...1
1.2 Discussion and Related Literature ...4
1.3 Data ...5
1.3.1 General Social Survey Sensitive Data Files ...6
1.3.2 American Community Survey Public Use Microdata Sample ...9
1.4 Methodology ...10
1.5 Results ...14
1.5.1 Role for Customer Discrimination and Business Financing ...18
1.5.2 Heterogeneous Effects Across the Distribution of Ability ...21
1.5.3 Robustness Checks...22
1.6 Conclusion ...25
Tables: Chapter 1 ...27
Figures: Chapter 1 ...40
Appendix 1.A. Questions from the General Social Survey, 1993-2010 ...45
Appendix 1.B. Additional Tables ...47
References: Chapter 1 ...49
Chapter 2: Tax Avoidance: How Income Tax Rates Affect the Labor Migration Decisions of NBA Free Agents ...52
2.1 Introduction ...52
2.2 Literature Review ...52
2.3 Taxes and the NBA ...53
2.4 Theoretical Framework ...55
2.5 The Data ...57
2.6 Methodology ...60
2.7 Conclusion ...66
Tables and Figures: Chapter 2 ...68
ix
Chapter 3: How the Nutritional Content of School Provided Meals Affects Student
Outcomes (joint with Mirinda L. Martin) ...79
3.1 Introduction ...79
3.2 Background Studies ...81
3.3 The HOPS Program ...83
3.4 Data Description ...84
3.4.1 Selection ...86
3.5 Methodology ...87
3.6 Results ...88
3.6.1 Heterogeneous Treatment Effects ...90
3.6.1.1 High Ability vs. Low Ability Students ...91
3.6.1.2 Economically Advantaged vs. Economically Disadvantaged ...91
3.6.1.3 Male vs. Female ...92
3.7 Conclusion ...93
Tables: Chapter 3 ...95
Figures: Chapter 3 ...104
1 CHAPTER 1
DOES DISCRIMINATION AFFECT BLACK ENTREPRENEURSHIP?
1.1 Introduction
Over the last hundred years in the United States, the black self-employment rate has been roughly one-third to one-half of the white self-employment rate (Fairlie and Meyer, 2000). According to the 2010 American Community Survey, while 6.8% of whites own their own businesses, only 3.6% of blacks do.1 In fact, whites own 83.4% of the businesses in America, compared to only 7.1% for blacks. However, recent survey findings show that there is a strong demand among blacks to start their own businesses. In a survey conducted by Gallup on high-school students’ attitudes towards entrepreneurship, 75% of black high-high-school students stated that they wanted to start their own business in the future, compared to 68% of all other high-school students (Kourlisky and Esfandiari, 1997). Furthermore, a survey of working-age Americans found that blacks are 78 percent more likely to attempt to start new companies, even after controlling for demographic characteristics (Shane, 2008).
If blacks are so interested in starting their own businesses, then why are there so few black entrepreneurs in America? Some of the most common reasons that have been cited in the literature as to why blacks are less likely to start their own businesses are a lack of human capital, both in terms of the education and experience necessary to run a business, a lack of role models or family figures who own their own businesses, a lack of financial capital necessary to facilitate business formation or business success, or the lack of social networks to help one through the process of starting one’s own business. For instance, Singh and Crump (2007) suggest that, since blacks with entrepreneurial intentions are more educated than those without entrepreneurial intensions, in order to improve the black self-employment rate, more focus toward improving the educational attainment of blacks is necessary. Fairlie (1999) finds that, while educational attainment explains a small amount of the black-white gap in business formation, racial differences in asset levels and the probability of having a self-employed father account for a much larger share of the gap. Furthermore, Fairlie and Robb (2007) observe that lack of work experience in a family business among blacks negatively affects the outcomes of
1
These tabulations are based on 2010 American Community Survey 3-year estimates for male and female self-employed workers in own not incorporated business, as a percentage of the civilian self-employed population 16 years of age and over.
2
black-owned businesses. Others cite lack of financial capital or lack of access to financial markets as reasons for such large gaps in black-white business formation and business success.
Discrimination against blacks could cause or exacerbate many of these problems facing aspiring black entrepreneurs. Due to discrimination in wage employment, blacks are likely to have lower asset levels than whites (Charles and Guryan 2008). Blacks facing discrimination also may have larger challenges securing business loans or outside investments in their companies (Cavalluzzo, Cavalluzzo, and Wolken 2002; Blanchflower et al 2003; Cavalluzzo and Wolken 2005; Coleman 2008). They are less likely to get an education equal in quality to whites or be able to move into managerial positions to earn the experience necessary for entrepreneurial success (Card and Krueger 1992; Giuliano, Levine, and Leonard 2011). Furthermore, this discrimination may lead to intergenerational effects and lower-quality social networks (Lentz and Laband 1990; Dunn and Holtz-Eakin 2000; Hout and Rosen 2000; Fairlie and Robb 2007). However, no previous empirical studies have explored the relationship between discrimination towards blacks and the black-white self-employment rate gap. This paper explores that relationship, and provides the first direct empirical evidence that discrimination negatively impacts black self-employment.
There are a number of reasons why we should care whether discrimination is negatively affecting black self-employment. Blacks are underrepresented in business ownership despite the strong demand among blacks to start their own businesses, and self-employment may provide a route for economic advancement among blacks when compared to opportunities in wage-employment (Holtz-Eakin, Rosen, and Weathers 2000; Fairlie 2004a; Fairlie 2004b). Moreover, many of the black individuals that fail to become self-employed as a result of discrimination come from the upper half of the skill distribution, and might be successful business owners in the absence of discrimination. Furthermore, the government may be able to intervene to reverse the effect of discrimination if they can determine the mechanisms through which discrimination is most heavily impacting black self-employment.
In this paper, I explore the relationship between discrimination towards blacks and the black-white self-employment rate gap by examining the effect that prejudicial attitudes towards blacks have on the black-white gap in self-employment. While I cannot directly measure discrimination, as a proxy for discrimination, I construct a measure of prejudicial attitudes towards blacks using survey responses from the 1993-2010 General Social Survey Sensitive Data
3
Files. These are restricted-access data files maintained by the Nation Opinion Research Center (NORC) at the University of Chicago and are obtained under special contractual arrangements. In each year, the survey includes an independently drawn sample of roughly 2,000-3,000 English or Spanish speaking persons 18 years of age or over, living in non-institutional arrangements within the United States. The GSS contains demographic, behavioral, and attitudinal questions, plus topics of special interest, designed to take the “pulse of America.” I use some of these questions to compile an index of the prejudicial attitudes of whites at the state level. Then, I merge my index of the prejudicial attitudes of whites with the 2005-2009 American Community Survey (ACS) Public Use Microdata Sample, which contains detailed information about survey respondents. To determine what impact the prejudicial attitudes of whites have on the black-white self-employment rate gap, I estimate regressions of self-employment status, from the ACS, on the state-level index of prejudicial attitudes, controlling for the characteristics of individuals and states that could be correlated with both racial prejudice and with the black-white self-employment rate gap.
I find that a one standard deviation increase in the average prejudice of whites increases the black-white self-employment rate gap by between 0.58-0.83 percentage points, and these results are statistically significant at the 5% level. An amount of prejudice equivalent to the difference in the least prejudiced and most prejudiced census divisions causes the black-white self-employment rate gap to widen by between 1.35-1.93 percentage points. These estimates translate into increases in the black-white self-employment rate gap of 24.2%-34.5%. Additionally, I find that the effect of an increase in average white prejudice on the black-white self-employment rate gap is due almost entirely to a decrease in the black self-employment rate, not an increase in the white self-employment rate. I show that these results are robust to various model and data assumptions.
Additionally, I test whether an increase in average white prejudice widens the black-white self-employment income gap. I find no evidence of a relationship between the average prejudice of whites at the state-level and the black-white self-employment income gap. Thus, while prejudice impacts whether blacks become self-employed, once they are self-employed it does not have an effect on their income.
I also investigate the mechanisms through which prejudice is impacting the black-white self-employment rate gap. Specifically, I consider the role that customer discrimination and
4
financial constraints play in driving the effect of prejudice on the black-white self-employment rate gap. I find suggestive evidence that discrimination is causing blacks to have more difficulty financing their businesses, and that customer discrimination may be playing some smaller role, however these results are mostly inconclusive due to imprecision in the estimates.
Finally, I examine whether prejudice has a stronger effect on the black-white self-employment rate in certain parts of the ability distribution. I find suggestive evidence that the effect of prejudice on the black-white self-employment rate gap is most heavily concentrated in the 4th quintile of the ability distribution, and least heavily concentrated in the 1st quintile. Again, these results are mostly inconclusive because the estimates are imprecise.
In this paper, I explore the relationship between discrimination towards blacks and the black-white self-employment rate gap, and provide the first direct empirical evidence that discrimination negatively impacts black self-employment. However, I find no evidence of an effect on income among self-employed blacks. I find evidence that suggests that discrimination causes increased difficulty for black entrepreneurs in acquiring business financing, and that customer discrimination may be playing some smaller role. I also find suggestive evidence that discrimination has the largest effect on self-employment in the 4th quintile of the ability distribution.
The next section of this paper discusses some background information and reviews the related literature. Section 1.3 describes the data. Sections 1.4 and 1.5 explain the methodology I employ and the results that follow, respectively. Section 1.6 concludes.
1.2 Discussion and Related Literature
My paper most closely relates to literature pertaining to the black-white self-employment rate gap, access to business capital, and lender discrimination. This paper adds to the existing literature by providing empirical support for the role that discrimination plays in explaining why blacks are both less likely to start businesses and less likely to have business success. While there is a sizable literature explaining this gap, no previous empirical studies have analyzed the relationship between discrimination towards blacks and the black-white self-employment rate gap. Some previous studies have used discrimination as a possible explanation for their findings, but none have been able to empirically indentify how discrimination towards blacks affects black entrepreneurship.
5
Much of the previous literature on the black-white self-employment gap focuses on the role of racial demographic differences. Racial differences in educational attainment (Singh and Crump 2007), asset levels (Fairlie 1999), the probability of having a self-employed father (Fairlie 1999; Hout and Rosen 2000), work experience in family businesses (Fairlie and Robb 2007), and self-employment patterns in previous generations (Lentz and Laband 1990; Dunn and Holtz-Eakin 2000) are all cited as reasons for the black-white gap in self-employment. However, each of these explanations for the black-white self-employment rate gap may be partially driven by discrimination.
Others cite access to business capital as a prominent reason for why there are so few black entrepreneurs. Bates (1997) finds that the startup capital of a new business is partially determined by the human capital of its owner, and since blacks have less human capital they also have less startup capital available for use in new businesses. Fairlie and Robb (2008) report that black-owned businesses have much lower levels of startup capital than white-owned businesses, and these differences persist across industries. Additionally, Robb, Fairlie, and Robinson (2009) show that blacks are much less likely to access external financial markets or to inject additional capital into their businesses in their companies’ early years. Moreover, Cavalluzzo, Cavalluzzo, and Wolken (2002), Blanchflower et al (2003), Cavalluzzo and Wolken (2005), and Coleman (2008) all find a measureable black-white gap in loan denial rates. As with demographic differences, racial differences in human capital, startup capital, and access to external financial markets also may be driven in part by discrimination.
Despite the vast amount of research that has been done on the black-white self-employment gap, no previous empirical studies have analyzed the relationship between discrimination towards blacks and the black-white self-employment rate gap. This is a significant oversight in the literature, as discriminatory beliefs could be a primary driving force behind the factors that others have identified as being important in generating this gap. In this paper, I focus on directly investigating the relationship between the black-white self-employment rate gap and discrimination towards blacks, as measured by prejudicial attitudes, in order to explore the potential role of this underlying mechanism.
1.3 Data
6
Sensitive Data Files and the 2005-2009 American Community Survey (ACS) Public Use Microdata Sample.
1.3.1 General Social Survey Sensitive Data Files
I use the GSS Sensitive Data Files to measure the extent of racial prejudice across states. This data contains state-level geographic identifiers and responses to demographic, behavioral,
and attitudinal questions for each individual, and is obtained under special contractual arrangements with NORC.23 In each year, the survey utilizes an independently drawn sample of roughly 2,000-3,000 English or Spanish speaking persons 18 years of age or over, living in non-institutional arrangements within the United States, using full-probability sampling.4 Therefore, the GSS is a repeated cross-sectional dataset, and each year is representative of the U.S. population. While the GSS is not designed to be representative at the state level, Brace et al (2002) show that state samples obtained from the GSS are remarkably representative, and that representativeness improves by pooling additional years of the GSS because of the joint effects of adding more primary sampling units and more individual observations. Representativeness can be improved further by adding additional decades, which correspond to different sampling frames (Brace et al 2002). I therefore pool the 1993-2010 survey results to measure prejudicial attitudes across states.
The GSS asks many questions that are particularly focused on determining white individuals’ attitudes towards blacks.5 However, many of these questions focus on issues that are less directly related to racial prejudice, such as government assistance towards blacks or affirmative action. Including only those questions that one-dimensionally focus on attitudes towards blacks, I compile a racial prejudice index for each white individual in each state. Table 1.1 shows the years that each question was asked for those questions that are included in the racial prejudice index. Using the racial prejudice index of each individual, I then estimate the average prejudice of whites towards blacks at the state level, pooling across the 1993-2010
2
Some of the data used in this analysis are derived from Sensitive Data Files of the GSS, obtained under special contractual arrangements designed to protect the anonymity of respondents. These data are not available from the author. Persons interested in obtaining GSS Sensitive Data Files should contact the GSS at GSS@NORC.org. 3
The General Social Survey has been used in work by Cutler, Glaeser, and Vigdor (1999), Hout and Rosen (2000), Card, Mas, and Rothstein (2008), and Charles and Guryan (2008).
4
Spanish speakers were added starting in 2006. 5
For a complete list of questions that focus on whites attitudes towards blacks asked in the GSS from 1993-2010, see Appendix A.
7 surveys.
To create a racial prejudice index for each white individual in the GSS, I use the method introduced by Charles and Guryan (2008).6 First, I make higher values correspond to more prejudiced answers. For instance, for the question that asks each respondent for an opinion to the statement “White people have a right to keep Blacks out of their neighborhoods if they want to, and Blacks should respect that right,” I code a response of “Agree Strongly” as three points, a response of “Agree slightly” as two points, a response of “Disagree slightly” as one point, and a response of “Disagree strongly” as zero points. I then normalize the response to each question by the overall mean and standard deviation in 1993, the first year of the analysis.7 I divide by the 1993 value of the standard deviation so that the relative weight of a particular question does not change over time. Formally, let be respondent i’s response to question q in year t. Then respondent i’s normalized response to question q in year t, call it , is given by
=
[
, ]
( , ). (1)
Figure 1.1 shows how the normalized responses to each question have changed over time from 1993-2010. While prejudice has generally fallen over time, there is some variance in this decline across questions. For instance, while many more individuals state that they would vote for a qualified black candidate for president in 2010 than in 1993, the number of individuals that believe that blacks have less motivation, willpower, and in-born ability to learn has declined at a much slower rate.
Once I have normalized the response to each question for each individual in each year, I
6
Where available, I use the same questions that Charles and Guryan (2008) use in creating my index, with a few notable exceptions. I use two questions that ask “On the average blacks have worse jobs, income, and housing than white people. Do you think these differences are because most blacks have less in-born ability to learn?” and “On the average blacks have worse jobs, income, and housing than white people. Do you think these differences are because most blacks just don't have the motivation or will power to pull themselves up out of poverty?”, while Charles and Guryan (2008) exclude these questions from their analysis. Moreover, they include the question “Irish, Italians, Jewish and many other minorities overcame prejudice and worked their way up. Do you believe blacks should do the same without special favors?” I exclude this question, as it also focuses on views pertaining to the appropriate role of government and affirmative action. Another notable difference in the index created by Charles and Guryan (2008) is that they use GSS waves from 1972-2004 and use 1977 as the base year in their analysis, while I use GSS waves from 1993-2010 to more accurately assess a measure of current prejudice. In their index, they also use other questions which were no longer asked post-1991.
7
Three of the questions were not asked in 1993. For these questions, I normalize by the mean and standard deviation from the first year in which the question was asked.
8
then calculate the average of the normalized responses for each individual in year t. Formally, let = ∑ ⁄, where is the total number of prejudice questions in year t. I then estimate a regression of on individual year fixed effects to find the residual, which I will henceforth refer to as the individual-level prejudice index. I use this method to control for the fact that, while discrimination may be decreasing over time, the sample size from each state is changing over time as well, and I wish to separate the state-specific component of the individual-level prejudice index from the time-specific component.8 Table 1.2 shows the pairwise correlations between each of the normalized individual-level prejudice questions, and the pairwise correlations between each of the normalized questions and the individual-level prejudice index. All of the prejudice questions are positively correlated, and most are highly correlated with other prejudice questions and with the individual-level prejudice index.
Using the individual-level prejudice index and the standardized responses to each question, I estimate a regression of each outcome on age, years of education, and an indicator variable for male, as well as state and year fixed effects, to determine how prejudice varies across the population; by conventional wisdom, older people, the less educated, and men tend to be more prejudiced. Regressions describing the individual-level prejudice index and the standardized responses to each question are shown in Table 1.3. On average, the individual-level prejudice index increases with age, decreases with education, and is larger for males. I cannot reject that the same is true of the standardized responses to each question. These results are consistent with Charles and Guryan (2008). Table 1.2 and Table 1.3 provide confidence that the individual-level prejudice index is an accurate measure of prejudicial attitudes.
Once I have obtained the individual-level prejudice index, , for each individual, I then find the average of in each state to create an index of the average prejudice of whites at the state level. To do this, I weight by the number of adults in the household of each individual, and I correct the weights for survey non-response where possible.9 This is done because the full-probability GSS samples are designed to give each household an equal full-probability of inclusion in the sample, and each adult in the household then has an equal probability of inclusion in the survey. Left unweighted, this would serve to under-represent individuals from large households
8
As a robustness check, I also include a specification that does not disentangle the state-specific and time-specific components of each individual-level prejudice index. This does not qualitatively change my estimate of the effect of average white prejudice on the black-white self-employment rate gap.
9
9 and over-represent individuals from small ones.10
Figure 1.2 shows the distribution of prejudice across census divisions. The East South Central division (AL, KY, MI, TN) is the most prejudiced, followed by the West South Central (AR, LA, OK, TX) and South Atlantic divisions (DE, DC, FL, GA, MD, NC, SC, VA, WV). The New England (CT, ME, MA, NH, RI, VT), Mountain (AZ, CO, ID, NM, MN, UT, NV, WY), and Pacific divisions (AK, CA, HI, OR, WA) are the least prejudiced.11 These tabulations follow closely with conventional wisdom. Figure 1.3 shows how prejudice has changed over time in each census division. In the majority of census divisions, there is not much movement in the prejudice index over time. It is important to note that fluctuations in the prejudice index over time might occur not only because prejudice is changing, but also because the mix of questions asked and the individuals sampled in each year also are changing. Stability of the prejudice index within each census division over time further supports the use of the average state-level prejudice index over this time span.
It is technically accurate that prejudicial attitudes do not necessarily imply discriminatory behavior. However, since Charles and Guryan (2008) find evidence that an increase in the prejudicial attitudes of whites increases the black-white wage gap, which implies that whites are acting upon these attitudes, I will henceforth ignore the distinction.
1.3.2 American Community Survey Public Use Microdata Sample
The ACS is a cross-sectional dataset that gathers detailed information from survey respondents annually. I make use of information about each respondent’s location, sex, race, age, educational attainment, self-employment status, self-employment income, industry, occupation, and other demographic characteristics. While the GSS contains similar information about each respondent, I use the ACS to study self-employment outcomes due to the scope of the survey; the GSS samples 2,000-3,000 persons each year, approximately half of whom are males, but I am able to observe over 3 million males in a five year period with the ACS.
Using the ACS, I define someone as self-employed if he reports being self-employed with a job at the time of the survey, and not self-employed if he reports being wage-employed or
10
As a robustness check, I include a specification where I create the state-level prejudice index using unweighted GSS data. The use of weights has no substantive impact on the estimate of the effect of average white prejudice on the black-white self-employment rate gap.
11
Based on the contractual arrangements with NORC, the census division is the finest level of geography at which I am permitted to display statistics from the GSS Sensitive Data Files.
10
unemployed at the time of the survey. In my basic definition of self-employment, I exclude those individuals who report being out of the labor force. However, as a robustness check, I use an alternative definition of employment that defines these individuals as not being self-employed. This does not qualitatively change my results.
Table 1.4 shows summary statistics for the full sample of males age 18-64 and for subsamples of males age 18-64 separated by race and self-employment status.12 In this study I focus on the self-employment decisions of males since female labor supply decisions are typically both more complex than and dissimilar to male labor supply decisions. Furthermore, it has been found in the literature that females are generally much less interested in self-employment than males (Pryor and Reedy, 2009). Approximately 11.4% of the individuals in the sample are self-employed at the time of the survey. Those that are self-employed have more years of experience, are more likely to have a college degree, are more likely to be U.S. citizens, are more likely to be immigrants, are more likely to be married, are less likely to be black, and are less likely to be military veterans. Among the self-employed, blacks have fewer years of experience, are less likely to have a college degree, are less likely to be U.S. citizens, are more likely to be immigrants, are less likely to be married, are more likely to be military veterans, and are less likely to speak English poorly than whites.13
1.4 Methodology
In this paper, I seek to identify the effect that racial prejudice has on the self-employment rate gap between blacks and whites using a time-invariant measure of racial prejudice that varies at the state level. Ordinarily, to identify this effect, one would estimate a regression of whether an individual is self-employed on an indicator variable that is equal to 1 if an individual is black, the average prejudice of whites at the state level, and an interaction term between the two, controlling for the characteristics of individuals and states that could be correlated with both racial prejudice and with the black-white self-employment rate gap. Because of the complex sampling design of the American Community Survey, the appropriate standard errors should use a repeated replication method utilizing the replicate weights contained therein (U.S. Census
12
Experience is defined as max(age-years of education-6, 0). 13
Hispanic blacks and Hispanic whites are included in counts for blacks and whites, respectively. As a robustness check, I include a specification which excludes all individuals of Hispanic origin. This does not qualitatively change my estimate of the effect of average white prejudice on the black-white self-employment rate gap.
11
Bureau, 2009).14 Since I have merged each individual observation in the ACS with state-level data, the standard errors should be clustered at the state level as well. This would indicate that either using repeated replication with the ACS replicate weights alone or clustering the standard errors at the state level alone will not retrieve the appropriate standard errors, and there is no method that allows one to do both simultaneously. To circumvent this problem, I use a two-step feasible generalized least squares (FGLS) estimation method proposed by Hanushek (1974) and used by Borjas (1982) and Lewis and Linzer (2005).
In the first step, I estimate a regression of whether an individual is self-employed on each of his individual-level characteristics separately for each state:
( != 1) = #($%+ $'!()*+,!+ $-!.!+ /!), (2)
where ! is equal to 1 if individual i in state s is self-employed, ()*+,! is an individual-specific indicator variable equal to one if individual i in state s is black and equal to zero if individual i in state s is white, .! is a vector of individual-specific characteristics, and /! is an error term. For each individual, I control for the set of demographic characteristics shown in Table 1.4, as well as a quadratic in potential labor market experience. When f is a linear function, $'! is the state-specific black-white self-employment rate gap controlling for individual-level characteristics. Since each of these regressions include only individual-level characteristics, standard errors can be correctly estimated by repeated replication making use of the ACS replicate weights.
To identify the effect that racial prejudice has on the black-white self-employment rate gap, in the second step I estimate a regression of the state-specific black-white self-employment rate gap on the state-level prejudice index. Specifically, I estimate
$0 = 1'! % + 1'234! + 1-5! + 6! , (3)
14
Standard errors estimate the variation in a statistic across multiple samples of a given population, and the true standard error of any characteristic calculated from a single sample can never be known with certainty. Replicate weights allow a single sample to simulate multiple samples and generate more informed standard error estimates that retain all of the information about the complex sampling design of the ACS (U.S. Census Bureau, 2009). There are 80 separate replicate weights in the ACS that allow researchers to derive standard error estimates empirically (U.S. Census Bureau, 2009). The standard error of an estimate using replicate weights in the ACS can be calculated using the formula 78(9) = 4/80 ∑ (9?%@' − 9)-, where 9 is the estimate using the full-sample weight and 9 is the estimate from the analysis using the rth set of replicate weights (U.S. Census Bureau, 2009).
12
where $0'! is the predicted state-specific black-white self-employment rate gap controlling for individual-level characteristics that is taken from the estimation of equation (2), 234!is an index of the average prejudice in state s, 5!is a vector of state-level characteristics, and 6! is the state-level error term. For each state, I control for the natural log of the fraction of the population that is black, the natural log of the population, the average amount of contact in wage employment for males, the fraction of the black male population and the white male population that has a high school diploma, and the fraction of the black male population and the white male population that had a self-employed father present as a child.15 The natural log of the fraction of the population that is black, the natural log of the population, the fraction of the black male population that has a high school diploma, and the fraction of the white male population that has a high school diploma are calculated by summing over the relevant subpopulations in the ACS. To determine the fraction of the black male population and the white male population that had a self-employed father present as a child, I use a GSS question that asks “Was your father normally self-employed or did he work for someone else while you were growing up?” and then sum over the relevant subpopulations.
To determine the average amount of customer contact in wage employment for males in each state, I use the Occupational Information Network (O*NET). O*NET is administered by the Employment and Training Administration of the U.S. Department of Labor (USDOL/ETA), and is the nation’s primary source for occupational information. O*NET indexes abilities, interests, knowledge, skills, activities, context, and values specific to each occupation in their database. I use an index of the importance of ‘Working directly with the Public’ as a measure of the amount of customer contact in each occupation. This index ranges from an importance of 98 for public address announcers and sheriffs to an importance of 0 for mathematical technicians. I match the amount of customer contact in each occupation to each male worker in the ACS by the Standard Occupational Classification (SOC) given in both datasets and then estimate the average amount of customer contact in wage employment for males in each state.
Identification of the coefficient 1' in equation (3) is based on the covariance between the
15
The race-specific fraction of the male population that graduated from high school in each state may serve as a measure of the race-specific quality of schooling in that state. It also may help to represent the race-specific quality of potential social networks in that state. The race-specific fraction of the male population that had a self-employed father present as a child may serve as a proxy variable for the probability that an individual in each state had experience in a family business as a child. It may also control for past race-specific self-employment rates in the case that past self-employment affects the current level of the average prejudice of whites in each state.
13
black-white self-employment rate gap controlling for individual-level characteristics and the index of the average prejudice of whites, controlling for all state-specific characteristics. 1' can be interpreted as the increase in the black-white self-employment rate gap brought about by a one standard deviation increase in average white prejudice, controlling for all individual and state-specific characteristics.
Since the dependent variable in equation (3) is estimated, 6! can be decomposed into sampling error, A!, and standard regression error, B!. Weighting equation (3) by the inverse standard deviation of the error term, 1 (C⁄ -+ D!-), where C-=Var(B!) and D!-=Var(A!), will produce the most efficient parameter estimates. Since C- is not observed, it must be estimated by feasible generalized least squares; D!- is approximated using the estimate of the sampling variance of $0'! from equation (2). Using FGLS, C- is approximated by estimating equation (3) by unweighted OLS. From the unweighted OLS regression, I retrieve the residuals, 6E!. Then, since equation (2) is estimated using a linear probability model, C- can be estimated by
CE- = ∑ FEG GH∑ IJG GHKLMN
′NOPQN′RNS
TU , (4)
where 6E! is the residual for state s from the second-step unweighted OLS regression, DJ!- is the estimated sampling variance of $E'!, . is the matrix of state-level independent variables, V is the diagonal matrix with D!- as the diagonal elements, S is the number of states, and k is the number of state-level independent variables including the constant. Equation (3) is then re-estimated, weighted by 1 (CE⁄ -+ DJ!-).
One detail that is often overlooked in related studies is that, since the state-level prejudice index is an estimated regressor from a relatively small sample, as are the other regressors that come from the GSS, standard errors that do not account for this variability will likely be biased downward.16 To correct for the imprecision in the estimated regressors that come from the GSS, I bootstrap the standard errors, stratifying on GSS year and primary sampling unit.1718
16
While regressors from the ACS are also estimated, the ACS sample is more than one hundred times larger than the GSS sample. Failure to account for the estimation of regressors from the ACS should have no substantial impact on the standard errors.
17
Each bootstrapped standard error is calculated using 1000 replications. 18
In some specifications, ordinary heteroskedasticity-robust standard errors may be biased downward by over 25%, highlighting the importance of accounting for imprecision in the regressors.
14
1.5 Results
I estimate the model using the two-step FGLS procedure discussed in Section 1.4. The distribution of the state-level black-white self-employment rate gap controlling for individual-level characteristics is shown in Figure 1.4. The estimates in Figure 1.4 can be directly compared to those in Figure 1.2. In terms of the magnitude of the black-white self-employment rate gap controlling for individual-level characteristics, the Pacific, which is the least prejudiced census division, has four out of its five states in the lowest twenty; on the other hand, the East South Central, which is the most prejudiced, has only one.
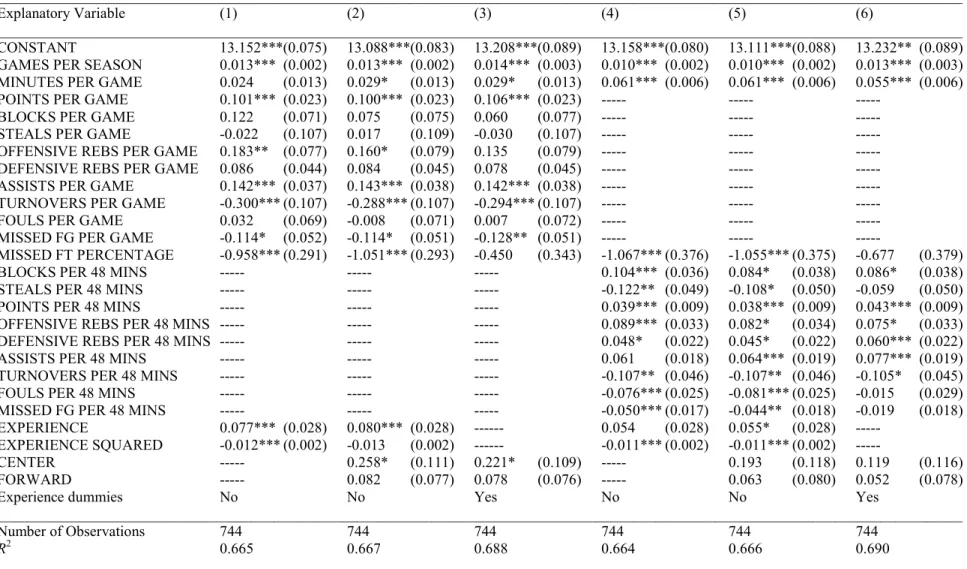
The results from the estimation of equation (3) are shown in Table 1.5. If a coefficient in equation (3) is negative, this refers to a widening of the black-white self-employment rate gap, and if a coefficient is positive, this indicates a narrowing of the gap. I add control variables across columns to illustrate the effect that the additional controls have on the estimate of the effect of average white prejudice. A one standard deviation increase in average white prejudice at the state level widens the black-white self-employment rate gap by between 0.58-0.83 percentage points, all else equal, depending on the specification, and these results are statistically significant at the 5% level in all specifications. An amount of prejudice equivalent to the difference in the least prejudiced and most prejudiced census divisions causes the black-white self-employment rate gap to widen by between 1.35-1.93 percentage points. Since the nationwide black-white self-employment rate gap controlling for observable characteristics is approximately 5.59 percentage points, this represents a 24.2%-34.5% increase. An increase in the average amount of customer contact in wage-employment also widens the black-white self-employment rate gap, and this result is statistically significant at the 5% level.19 Sequentially adding additional control variables tends to have very little effect on the average white prejudice coefficient.20
19
I lack power when estimating state-level regressions which include interaction terms between each individual-level characteristic and the black dummy variable. However, when including these interaction terms in the first step, point estimates of the effect of a one standard deviation increase in average white prejudice on the black-white self-employment rate gap are quantitatively similar to the results presented in Table 1.5.
20
The results are robust to whether a linear probability model, probit regression, or logistic regression is estimated in the first step, and a linear probability model allows me to interpret the coefficients as average marginal effects; Appendix Table 1.B1, which displays the coefficients from the second step when the first step is a probit regression, shows that qualitatively similar conclusions can be drawn. Borjas and Sueyoshi (1994) and Huber, Kernell, and Leoni (2005) show that this two-step procedure is possible when the first step is a non-linear model. When the first-step is estimated by a probit regression, each second-first-step regression is weighted by 1 (C⁄ -+ D!-), and C- is estimated by CE-=∑Gϵ̂GH∑ IG GH
15
The results from Table 1.5 show that a one standard deviation increase in average white prejudice at the state level widens the black-white self-employment rate gap, however, they do not show whether or not the effect of a one standard deviation increase in average white prejudice at the state level lowers the self-employment rate of blacks. To determine the effect of a one standard deviation increase in average white prejudice on the black self-employment rate, I first estimate the state-level black self-employment rate that is not due to observable characteristics. Specifically, I estimate the linear probability model shown in equation (2) separately for each state, but with the black indicator variable omitted. Then, to find the state-level black self-employment rate that is not due to observable characteristics, I calculate the average residual from the first-step regression among blacks in each state. Finally, I use the average residual, which represents the state-level black self-employment rate that is not due to observable characteristics, as the dependent variable in the second-step regression.
The results from this second-step regression are shown in Table 1.6. A one standard deviation increase in average white prejudice at the state level decreases the black self-employment rate by between 0.62-0.75 percentage points, in specifications (2)-(6). These results are statistically significant at the 5% level in specifications (2)-(5) and at the 10% level in specification (6). Specifications (2)-(6) of Table 1.5 show that a one standard deviation increase in average white prejudice at the state level widens the black-white self-employment rate gap by between 0.63-0.83 percentage points. Therefore, the impact of an increase in average white prejudice on the black-white self-employment rate gap is due almost entirely to a decrease in the black self-employment rate, not an increase in the white self-employment rate. Sensibly, an increase in prejudice against blacks should cause black self-employment to decline while having little effect on white self-employment.
It is of some concern that unobservable individual-level characteristics may be able to explain a large portion of the black-white self-employment rate gap that I have attributed to discrimination. It also is of some concern that individuals will react endogenously to observed discrimination; for example, in the presence of discrimination, blacks might acquire less education because they no longer plan to start a business. To provide evidence on these potential sources of bias, I show that observable characteristics of individuals are uncorrelated with the
D!- is the estimated sampling variance of $'!, S is the number of states, and k is the number of state-level independent variables including the constant. The resultant coefficients in the second-step regression can be interpreted in the same way as coefficients from a probit regression.
16
average prejudice of whites in each state. If observable characteristics of individuals are uncorrelated with the average prejudice of whites, then unobservable characteristics of individuals can only be correlated with the average prejudice of whites if they are uncorrelated with the observable characteristics of individuals; furthermore, it would rule out that blacks are reacting endogenously to discrimination by changing their observable characteristics.
At the individual level, education, experience, citizenship, immigration, and marriage are positively correlated with self-employment, while military experience and poor English speech are negatively correlated with self-employment. To determine whether observable individual-level characteristics are correlated with the average prejudice of whites, I calculate the state-individual-level black-white gap in each characteristic of interest, and then estimate a bivariate regression of each state-level gap on the average prejudice of whites. Of particular interest is whether observable individual-level characteristics other than race predict a self-employment rate gap that is correlated with the average prejudice of whites. These results are shown in Column (1) of Table 1.7. Together, all of these characteristics imply an increase in the black-white self-employment rate gap of 0.04 percentage points for every one standard deviation increase in average white prejudice, and this result is not statistically significant. Since the combination of observable characteristics that predict self-employment is uncorrelated with the average prejudice of whites, it is unlikely that unobservable characteristics are able to account for the black-white self-employment rate gap that is brought about by the average prejudice of whites, or that blacks are reacting endogenously to prejudice by altering their behavior.
An increase in average white prejudice widens the black-white self-employment rate gap. It is worth asking whether an increase in average white prejudice also widens the black-white self-employment income gap. Prejudice may directly impact the self-self-employment income of blacks through higher-interest business loans or discrimination from suppliers or consumers; however, since prejudice widens the black-white self-employment rate gap, it also may affect which blacks become or remain employed. If average white prejudice widens the black-white self-employment rate gap by making it more difficult for blacks to finance their businesses, then blacks that become or remain self-employed in more prejudiced states will likely be more highly skilled than blacks in less prejudiced states. This might cause estimates of the effect of average white prejudice on the black-white self-employment income gap to be biased toward narrowing the gap, since I cannot control for unobserved individual characteristics. To provide evidence
17
that unobservable individual-level characteristics of self-employed individuals are uncorrelated with the average prejudice of whites, I show that observable characteristics of the self-employed are uncorrelated with the average prejudice of whites in each state.
To determine whether observable characteristics of self-employed individuals are correlated with prejudice levels, I calculate the state-level black-white gap in each characteristic of interest among the self-employed, and then estimate a bivariate regression of each state-level gap on the average prejudice of whites. These results are shown in Column (2) of Table 1.7. Based on observable characteristics, there is no statistically significant evidence that self-employed blacks are more highly skilled in more prejudiced states than less prejudiced states when compared to the self-employed whites in those states. Thus, it is unlikely that self-employed blacks are more highly skilled in more prejudiced states than less prejudiced states when compared to the self-employed whites in those states, based on unobservable characteristics.
To estimate the effect of an increase in average white prejudice on the black-white self-employment income gap, I again use the two-step FGLS procedure discussed in Section 1.4. I use the natural log of self-employment income as the dependent variable in the first-step regressions.21 The results from the second-step regressions are shown in Columns (1)-(3) of Table 1.8. There is no statistically significant relationship between the average prejudice of whites at the state-level and the black-white self-employment income gap.22 Since some employed workers may pay themselves a wage or salary that should actually be reported as self-employment income, I also estimate the regressions using the natural log of self-self-employment income plus wage and salary income for all self-employed workers as the dependent variable in the first-step regressions. The results from these second-step regressions are shown in Columns (4)-(6) of Table 1.8 and are not qualitatively different from the results in Columns (1)-(3).
As previously mentioned, estimates of the effect of average white prejudice on the black-white self-employment income gap are biased toward narrowing the gap if the black individuals that become or remain self-employed in more prejudiced states are unobservably more highly
21
In the regressions I exclude all self-employed workers with self-employment income less than or equal to zero. This includes only 1.12% of self-employed blacks and 1.21% of self-employed whites. The mean self-employment income of blacks with self-employment income below zero is similar to the mean self-employment income of whites with self-employment income below zero.
22
Using the subset of self-employed workers who have greater self-employment income than wage and salary income, or who have no wage or salary income, does not qualitatively change the results.
18
skilled than blacks in less prejudiced states.23 It is not clear if there is no effect of an increase in average white prejudice on the black-white self-employment income gap, or if I fail to find an effect because the black individuals that are observed as self-employed in more prejudiced states are more highly skilled than blacks in less prejudiced states in some unobservable way. However, based on Column (2) of Table 1.7, it is unlikely that the black individuals that are observed as self-employed in more prejudiced states are unobservably more highly skilled than blacks in less prejudiced states.
1.5.1 Role for Customer Discrimination and Business Financing
I have not yet addressed the potential reasons why an increase in average white prejudice widens the black-white self-employment rate gap. One possible explanation could be that a higher level of prejudice among whites widens the black-white self-employment rate gap because white customers discriminate against black-owned businesses. In this case, discriminatory whites only would purchase from black-owned businesses at lower prices than white-owned businesses would charge for identical products, in order to compensate themselves for the disutility that they experience when purchasing from blacks (Becker 1957). In order for customer discrimination to exist, there must be contact between customers and the group that is discriminated against.
I define an individual as being employed in a high contact occupation if they are self-employed in an occupation where the importance of ‘Working directly with the Public’ is above the median level, and I define an individual as not being self-employed in a high contact occupation if they are not self-employed, or if they are self-employed in an occupation where the importance of ‘Working directly with the Public’ is below the median level. I use an analogous definition for self-employment in a low contact occupation.24
To test whether the average prejudice of whites has a greater effect on the black-white self-employment rate gap in occupations with large amounts of customer contact than in occupations with small amounts of customer contact, I use the two-step FGLS procedure discussed in Section
23
If the black individuals that become or remain self-employed in more prejudiced states are more highly skilled than blacks in less prejudiced states, but this skill difference is observable, then estimates of the effect of average white prejudice on the black-white self-employment income gap are not biased. They are only biased if this skill difference is unobservable.
24
The median level of the index of the importance of ‘Working directly with the Public’ is 49.86. The mean of the index is 50.21.
19
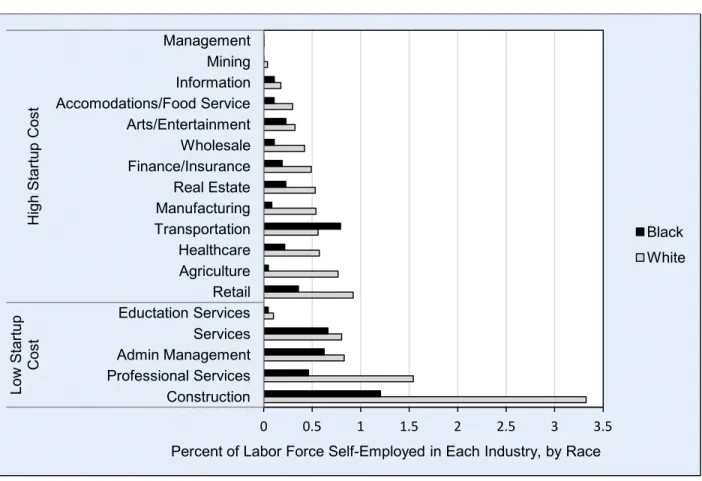
1.4 separately for high contact and low contact occupations. Table 1.9 shows the results from the second-step regressions: a one standard deviation increase in average white prejudice at the state level is shown to widen the black-white self-employment rate gap in high contact occupations by between 0.36-0.48 percentage points, and these results are statistically significant at the 5% level. A one standard deviation increase in average white prejudice at the state level widens the black-white self-employment rate gap in low contact occupations by between 0.32-0.38 percentage points, and these results are only statistically significant (at the 10% level) when the race-specific graduation rates and the race-specific fractions with a self-employed father present as a child are not included. In comparable specifications, the estimate of the effect of prejudice on the black-white self-employment rate gap in low contact occupations is not statistically distinguishable from the effect of prejudice on the black-white self-employment rate gap in high contact occupations, and is between 76%-88% as large in magnitude. While there may be a small effect caused by customer discrimination, it is not a primary driver of the results. Another potential explanation why an increase in the average prejudice of whites widens the black-white self-employment rate gap is that a more prejudiced environment makes it more difficult for blacks to finance their businesses. One implication of financial market discrimination is that prejudice would have a greater effect on the black-white self-employment rate gap in industries that require a large amount of startup capital. To this end, I estimate the average startup cost of a firm in each industry that corresponds to a two-digit NAICS code. To do this, I use the 2007 Survey of Business Owners, which reports the percent of firms in each industry that had startup costs of less than $5,000, $5,000 to $9,999, $10,000 to $24,999, $25,000 to $49,999, $50,000 to $99,999, $100,000 to $249,999, $250,000 to $999,999, or $1,000,000 or more. The survey also allows for an answer of don’t know or not applicable. I estimate the average startup cost of a firm in each industry using the mid-point of each range and 1.5 times the top-code, under the assumptions that not applicable means that no startup capital was necessary and the average startup capital of those who did not know their business’ startup cost is the same as those who did know their business’ startup cost. Then, I divide the ACS sample of firms into two groups by classifying each industry as a high startup cost industry or low startup cost industry. Detailed information about the estimation of average startup costs in each industry can be found in Appendix Table 1.B2.
20
in Figure 1.5. The industries that I have identified as low startup cost industries (educational services, services, administrative services, professional services, and construction) contain 53.9% of all self-employed workers, and self-employed workers in each of these industries make up a relatively large fraction of the labor force for both blacks and whites, with educational services being the exception. The largest black-white gaps in self-employment are in the construction and professional services industries. While the number of self-employed workers in high startup cost industries is relatively lower, there tends to be a significant gap in each of these industries, except for transportation. Among high startup cost industries, agriculture has the largest black-white gap in self-employment.25
To test whether the average prejudice of whites has a greater effect on the black-white self-employment rate gap in industries with high startup costs than in industries with low startup costs, I use the two-step FGLS procedure discussed in Section 1.4 separately by industry startup cost; Table 1.10 shows the results from the second-step regressions. A one standard deviation increase in average white prejudice at the state level is shown to widen the black-white self-employment rate gap in high startup cost industries by 0.40 percentage points in the full specification shown in Column (3). This result is statistically significant at the 10% level. A one standard deviation increase in average white prejudice at the state level increases the black-white self-employment rate gap in low startup cost industries by only 0.26 percentage points in the full specification, and this result is not statistically significant. Since the magnitude of the effect is much smaller in low startup cost industries, this may be evidence that average white prejudice has a much smaller effect on the black-white self-employment rate gap in industries with low startup costs. This assertion can be strengthened by the fact that 54% of self-employed workers are in industries that I classify as high startup cost industries and 46% are in industries that I classify as low startup cost industries, because the sample could not be split evenly based on two-digit NAICS industries; due to this feature of the data, the coefficients for high startup cost industries are biased downward, and the coefficients for low startup cost industries are biased upward. Prejudice could have a smaller effect in low startup cost industries either because blacks in more prejudiced states have more difficulty acquiring external financing from lenders or investors or because blacks in more prejudiced states have lower wage earnings to use toward
25
In section 1.5.3, I do a robustness check of my initial results excluding agriculture, and find no substantive difference in my results.
21
financing their own businesses, as found by Charles and Guryan (2008). Nevertheless, in each specification, the estimate of the effect of prejudice on the black-white self-employment rate gap in low startup cost industries is not statistically distinguishable from the effect in high startup cost industries due to the relatively small number of states in my sample.
I find evidence that suggests that discrimination causes increased difficulty for black entrepreneurs in acquiring business financing, and that customer discrimination may be playing some smaller role. However, the results are mostly inconclusive due to the size of the standard errors.
1.5.2 Heterogeneous Effects Across the Distribution of Ability
The effect of prejudice on the black-white self-employment rate gap is likely concentrated among those black workers that are most likely to try to become self-employed. Individuals with bachelor’s or graduate degrees, those that are married, and immigrants are much more likely to enter into self-employment, and are thus susceptible to discrimination that may keep them from becoming self-employed. Those that would never attempt to enter self-employment in the absence of discrimination cannot be prevented from becoming self-employed by discrimination. To determine how the effect of prejudice on the black-white self-employment rate gap varies across the distribution of ability, I first create an index of ability. To generate this index, I estimate a regression of the natural log of wage income on all of the individual-level demographic characteristics present in .! in equation (2), separately for each state, using only the wage-employed. Then, in each state, I calculate the predicted value from this regression for each worker in the labor market; this is an estimate of the log wage for each individual given his observable characteristics.26 I use this index to rank workers based on ability.
In each state, I divide each worker into an ability quintile based on his predicted log wage. While only 3.97% in the lowest ability quintile are self-employed, 16.4% are self-employed in the highest ability quintile, and the self-employment rate increases monotonically across quintiles. Thus, the effect of prejudice on the black-white self-employment rate gap is probably most heavily concentrated in the upper tail of the ability distribution.
26
Of course, the coefficients from this regression may be biased because I only observe wages for the wage-employed; self-employed and unemployed individuals are omitted from the regression. Nonetheless, the predicted value from this regression will give a fairly accurate representation of each person’s relative position in the ability distribution.
22
I use the two-step FGLS procedure discussed in Section 1.4 separately by quintile; Table 1.11 shows the results from the second-step regressions. The magnitude of the effect of average white prejudice on the black-white self-employment rate gap is largest in the 4th quintile of the ability distribution, and is statistically significant at the 5% level. However, while the effects in the 2nd, 3rd, and 5th quintiles are approximately one-third to one-half the size of the effect in the 4th quintile and not statistically significant, and the effect in the lowest quintile is less than one-tenth the size of the effect in the 4th quintile and not statistically significant, none of the differences are statistically significant either due to imprecision in the estimates. However, evidence suggests that the effect of prejudice on the black-white self-employment rate gap is most concentrated in the 4th quintile of the ability distribution, and least concentrated in the 1st quintile.
Theoretically, it should not be surprising if prejudice most heavily affects self-employment in the 4th quintile of the ability distribution. While the prevalence of self-employment is highest in the 5th quintile, individuals in the 5th quintile are those that financial institutions or employers would have the most difficult time discriminating against due to their credentials. A loan officer would likely have a hard time explaining why she didn’t give a loan to a black client with an MBA and 25 years of labor market experience, but gave one to a white client with 10 fewer years of experience and only a bachelor’s degree.
While I find evidence that suggests that the effect of prejudice on the black-white self-employment rate gap is most heavily concentrated in the 4th quintile of the ability distribution, and least heavily concentrated in the 1st quintile, the results are mostly inconclusive due to the size of the standard errors.
1.5.3 Robustness Checks
I estimate a series of robustness checks to determine if the effect that racial prejudice has on the black-white self-employment rate gap is robust to various model and data assumptions. The results from these regressions are shown in Tables 1.12a and 1.12b. Column (1) of Table 1.12a shows the specification from Column (6) of Table 1.5 for the sake of comparison. To determine if the result is a byproduct of the weighting scheme that I employ, in Column (2), I estimate the second-step regression by unweighted ordinary least squares, and in Column (3), I estimate the second-step regression by weighting each state by the inverse of the standard error of the
23
dependent variable that comes from the first-step regression. In both cases the estimate of the effect of average white prejudice on the black-white self-employment rate gap is very similar to the estimate that uses FGLS weights. In Column (4), I use an alternative definition of self-employment that includes all individuals not in the labor force as not self-employed. This might affect the initial estimates if some individuals drop out of the labor force when they fail to become self-employed, and if it occurs more frequently for blacks in low prejudice states or for whites in high prejudice states. This attenuates the estimate; however, the attenuation is a product of the alternative definition of self-employment; under the alternative definition 18% fewer individuals are defined as self-employed, and the self-employment rate gap is 9.3% smaller.
In Column (5), I calculate the average prejudice of whites at the state level without reweighting each year to receive equal weight. In Column (6), I calculate the average prejudice of whites at the state level by not tim