W
HAT
A
CCOUNTS FOR
I
NTERNATIONAL
D
IFFERENCES IN
S
TUDENT
P
ERFORMANCE
?
A
R
E
-E
XAMINATION
U
SING
PISA
D
ATA
T
HOMAS
F
UCHS
L
UDGER
W
OESSMANN
CESIFO WORKING PAPER NO. 1235
C
ATEGORY4:
L
ABOURM
ARKETSJ
ULY2004
An electronic version of the paper may be downloaded • from the SSRN website: www.SSRN.com
CESifo Working Paper No. 1235
W
HAT
A
CCOUNTS FOR
I
NTERNATIONAL
D
IFFERENCES IN
S
TUDENT
P
ERFORMANCE
?
A
R
E
-E
XAMINATION
U
SING
PISA
D
ATA
Abstract
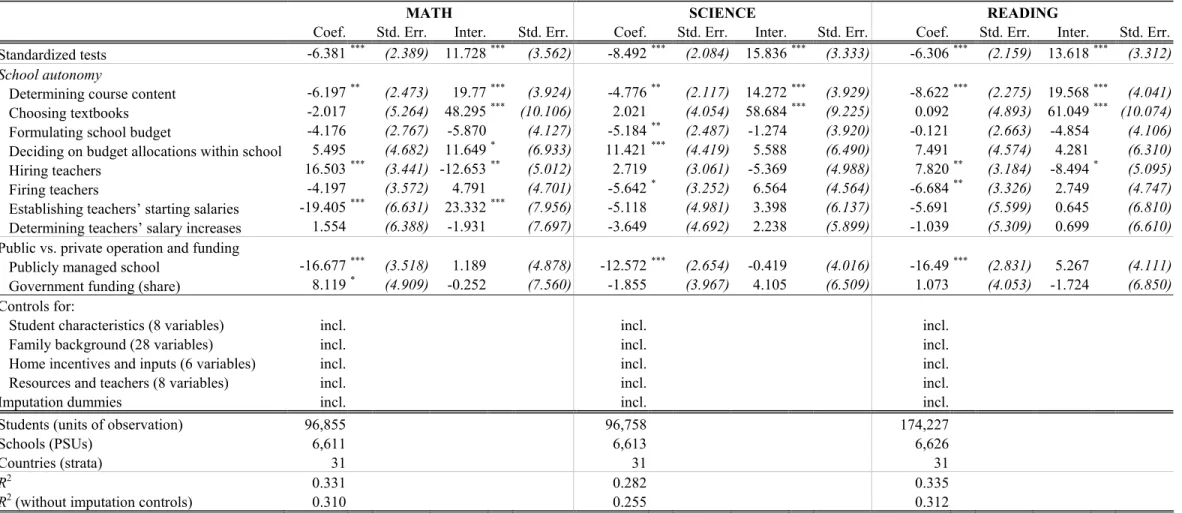
We use the PISA student-level achievement database to estimate international education production functions. Student characteristics, family backgrounds, home inputs, resources, teachers and institutions are all significantly related to math, science and reading achievement. Our models account for more than 85 percent of the between-country performance variation, with roughly 25 percent accruing to institutional variation. Student performance is higher with external exams and budget formulation, but also with school autonomy in textbook choice, hiring teachers and within-school budget allocations. School autonomy is more beneficial in systems with external exit exams. Students perform better in privately operated schools, but private funding is not decisive.
Keywords: education production function, PISA, international variation in student performance, institutional effects in schooling.
JEL Code: I28, J24, H52, L33.
Thomas Fuchs
Ifo Institute for Economic Research at the University of Munich
Poschingerstr. 5 81679 Munich
Germany [email protected]
Ludger Woessmann
Ifo Institute for Economic Research at the University of Munich
Poschingerstr. 5 81679 Munich
Germany [email protected]
Financial support by the Volkswagen Foundation is gratefully acknowledged. We would like to thank participants at the Human Capital Workshop at Maastricht University and at a seminar at the Ifo Institute for Economic Research, Munich, as well as John Bishop, George Psacharopoulos, Andreas Schleicher and Manfred Weiß, for helpful comments.
1
1. Introduction and Summary
The results of the Programme for International Student Assessment (PISA), conducted in 2000 by the Organisation for Economic Co-operation and Development (OECD), triggered a vigorous public debate on the quality of education systems in most participating countries. PISA made headlines on the front pages of tabloids and more serious newspapers alike. For example, The Times (Dec. 6, 2001) in England titled, “Are we not such dunces after all?”, and
Le Monde (Dec. 5, 2001) in France titled, “France, the mediocre student of the OECD class”. In Germany, the PISA results made headlines in all leading newspapers for several weeks (e.g., “Abysmal marks for German students” in the Frankfurter Allgemeine Zeitung, Dec. 4, 2001), putting education policy at the forefront of attention ever since. “PISA” is now a catch-phrase for the poor state of the German education system known by everybody. While this coverage proves the immense public interest, the quality of much of the underlying analysis is less clear. Often, the public assessments tend to simply repeat long-held believes, rather than being based on evidence produced by the PISA study. If based on PISA facts, they usually rest upon bilateral comparisons between two countries, e.g., comparing a commentator’s home country to the top performer (Finland in the case of PISA reading literacy). And more often than not, they are bivariate, presenting the simple correlation between student performance and a single potential determinant, such as educational spending.1
Economic theory suggests that one important set of determinants of educational performance are the institutions of the education system, because these set the incentives for the actors in the education process. Among the institutions that have been theorized to impact the quality of education are public versus private financing and provision (e.g., Epple and Romano 1998; Nechyba 1999, 2000; Chen and West 2000), the centralization of financing (e.g., Hoxby 1999, 2001; Nechyba 2003), external versus teacher-based standards and examinations (e.g., Costrell 1994; Betts 1998; Bishop and Wößmann 2004), centralization versus school autonomy in curricular, budgetary, personnel and process decisions (e.g., Bishop and Wößmann 2004) and performance-based incentive contracts (e.g., Hanushek et al. 1994). In many countries, the impact that such institutions may have on student performance tends to be ignored in most discussions of education policy, which often focus on the implicitly assumed positive link from schooling resources to student performance.
1 Given that the number of observations N equals 2 in a two-country comparison, the number of potential
determinants analyzed at one time must be 1, implicitly assuming that no other determining factor is of importance to the analysis.
2
One reason for this neglect may be that the lack of institutional variation within most education systems makes an empirical observation of the impact of institutions impossible when using national datasets, as is standard practice in most empirical research on educational production (cf., e.g., Hanushek 2002 and the references therein). However, such institutional variation is given in cross-country data, and evidence based on previous international student achievement tests such as IAEP (Bishop 1997), TIMSS (Bishop 1997; Wößmann 2003a) and TIMSS-Repeat (Wößmann 2003b) supports the view that institutions play a key role in determining student performance. These international databases allow for multi-country multivariate analyses, which ensure that the impact of each determinant is estimated for otherwise similar schools by holding the effects of other determinants constant.
In this paper, we use the PISA database to test the robustness of the findings of these previous studies of international education production functions.2 Combining the performance
data with background information from student and school questionnaires, we estimate the influence of student background, schooling resources and schooling institutions on the international variation in students’ educational performance. In contrast to Bishop’s (1997, 2004) country-level analyses, we perform the analysis at the level of the individual student, which allows us to take advantage of within-country variation in addition to between-country variation, vastly increasing the degrees of freedom of the analysis.
Given its particular features, the rich PISA student-level database allows for a rigorous assessment of the determinants of international differences in student performance in general, and of the link between schooling institutions and student performance in particular. PISA offers the possibility to re-examine previous international studies for the validity of their derived results in the context of different subjects (reading in addition to math and science), a different definition of required capabilities and of the target population, and to extend the examination by including more detailed family-background and institutional data. Among others, the PISA database distinguishes itself from previous international tests by providing data on parental occupation at the level of the individual student and on private versus public operation and funding at the level of the individual school.
2 Some economic research exists which estimates production functions using PISA data, but mostly on a
national scale. Fertig (2003a) uses the German PISA sample to analyze determinants of German students’ achievement. Fertig (2003b) uses the US sample of the PISA dataset to analyze class composition and peer group effects. Wolter and Vellacott (2003) use PISA data to study the effects of sibling rivalry in Belgium, Canada, Finland, France, Germany and Switzerland. To our knowledge, the only previous study using the PISA data to estimate multivariate education production functions in an international context is Fertig and Schmidt (2002), who, sticking to reading performance, do not focus on estimating determinants of the international variation in student performance but rather on estimating conditional national performance scores.
3
Our main findings are as follows. As in previous studies, students’ family background is consistently strongly related to their educational performance. We find that the effects of family background as measured by parental education, parental occupation or the number of books at home are considerably stronger in reading than in math and science. Furthermore, while boys outperform girls in math and science, the opposite is true in reading. Contrary to many previous studies, a country’s educational expenditure per student is statistically significantly, albeit weakly, positively related to math and science performance in PISA. While smaller classes do not go hand in hand with superior student performance, better equipment with instructional material and better-educated teachers do.
In terms of institutional effects, our results confirm previous evidence that external exit exams are statistically significantly positively related to student performance in math, and marginally so in science. The positive relationship in reading is not statistically significant, which may however be due to poor data quality on the existence of external exit exams in this subject and to the small number of country-level observations. Using standardized testing as an alternative measure of external examination, we find a statistically significant positive relationship in all three subjects. Consistent with theory as well as previous evidence, school autonomy is related to superior student performance in personnel-management and process decisions such as the hiring of teachers, textbook choice and deciding budget allocations within schools. By contrast, centralized decision-making is related to superior performance in decision-making areas with large scope for decentralized opportunistic behavior, such as formulating the overall school budget. The performance effects of school autonomy tend to be more beneficial in systems where external exit exams are in place, emphasizing the role of external exams as “currency” of the school system. The findings on school autonomy are mostly consistent across the three subject areas. Finally, students in publicly operated schools perform worse than students in privately operated schools. However, holding the mode of private versus public operation constant, the same is not true for students in schools that receive a larger share of private funding, and in math, the share of private funding is actually statistically significantly related to weaker performance.
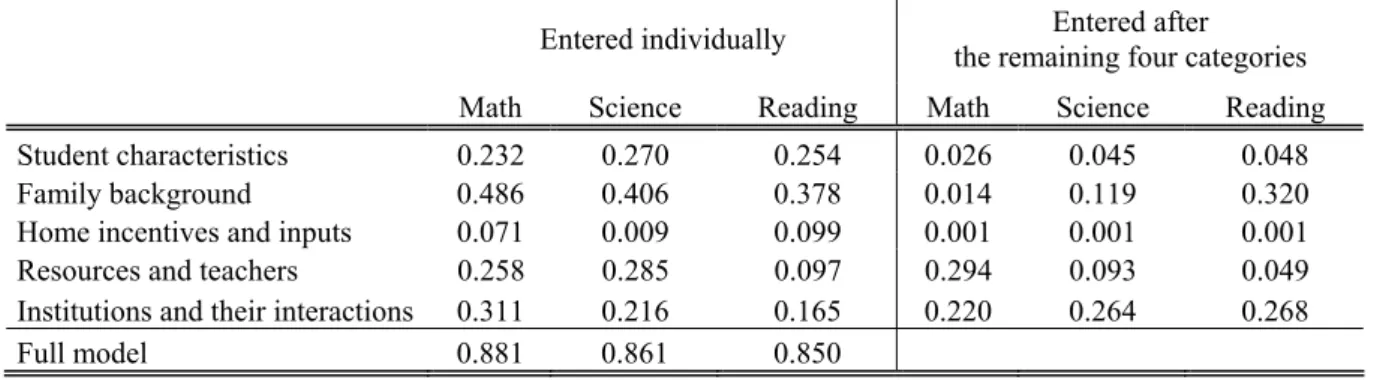
At the country level, our empirical models can account for more than 85% of the total between-country variation in test scores in all three subjects. Institutions alone account for roughly one quarter of the international variation in student performance. Thus, institutional structures of school systems are again found to be important determinants of students’ educational performance.
4
The remainder of the paper is structured as follows. Section 2 describes the database of the PISA international student performance study and compares its features to previous studies. Section 3 discusses the econometric model. Section 4 presents the basic results. Section 5 adds further evidence regarding interaction effects between external exit exams and other institutions. Section 6 analyzes the explanatory power of the model and its different parts at the country level. Section 7 concludes.
2. The PISA International Student Performance Study
2.1 PISA and Previous International Student Achievement TestsThe international dataset used in this analysis is the OECD Programme for International Student Assessment (PISA). In addition to testing the robustness of findings derived from previous international student achievement tests, the analysis based on PISA contributes several additional new aspects to the literature. First, PISA tested a new subject, namely reading literacy, in addition to math and science already tested in IAEP and TIMSS. This alternative measure of performance broadens the outcome of the education process considered in the analyses.
Second, particularly in reading, but also in the more traditional domains of math and science, “PISA aims to define each domain not merely in terms of mastery of the school curriculum, but in terms of important knowledge and skills needed in adult life” (OECD 2000, p. 8). That is, rather than being curriculum-based as the previous studies, “PISA looked at young people’s ability to use their knowledge and skills in order to meet real-life challenges” (OECD 2001, p. 16). For example, reading literacy is defined in terms of “the capacity to understand, use and reflect on written texts, in order to achieve one’s goals, to develop one’s knowledge and potential, and to participate in society” (OECD 2000, p. 10).3 There is a
similar real-life related focus in the other two subjects. While on the one hand, this real-life focus should constitute the most important outcome of the education process, on the other hand it bears the caveat that schools are assessed not on the basis of what their school system asks them to teach in their curriculum, but rather on what students might need particularly well for coping with everyday life.
Third, rather than targeting students in specific grades as in previous studies, PISA’s target population are the 15-year-old students in each country, regardless of the specific grade they
5
may currently be attending. This target population is not only interesting because it means that PISA assesses young people near the end of compulsory schooling, but also because it captures students of the very same age in each country independent of the structure of national school systems. By contrast, the somewhat artificial grade-related focus of other studies may be distorted by differing entry ages and grade-repetition rules in different countries.
Fourth, the PISA data provide more detailed information than previous international studies on some institutional characteristics of the school systems. For example, PISA provides data on whether schools are publicly or privately operated, on which share of their funding stems from public or private sources and on whether schools can fire their teachers. These features of the background data help to identify improved internationally comparable measures of schooling institutions.
Fifth, the PISA data also provide more detailed information than previous international studies on students’ family background. For instance, there is information about the occupation of parents and the availability of computers at home. This should contribute to a more robust assessment of the different potential determinants of student performance. Finally, reading literacy is likely to depend more heavily on family-background variables than performance in math and science. Hence controlling for a rich set of family-background variables should establish a more robust test of the institutions-performance link if the ability to read is the dependent variable.
Taken together, the PISA international dataset allows for a re-examination of results based on previous international tests using an additional subject, real-life rather than curriculum-based capabilities, an age-curriculum-based target population and richer data particularly on family background and institutional features of the school system.
2.2 The PISA Database
The PISA study was conducted in 2000 in 32 developed and emerging countries, 28 of which are OECD countries, in order to obtain an internationally comparable database on the educational achievement of 15-year-old students in reading, math and science. The study was organized and conducted by the OECD, ensuring as much comparability among participants as possible and a consistent and coherent study design.4 The countries participating in the
4 For detailed information on the PISA study and its database, see OECD (2000, 2001, 2002), Adams and
6
PISA 2000 study are: Australia, Austria, Belgium, Brazil, Canada, the Czech Republic, Denmark, Finland, France, Germany, Greece, Hungary, Iceland, Ireland, Italy, Japan, Korea, Latvia, Liechtenstein,5 Luxembourg, Mexico, the Netherlands, New Zealand, Norway,
Poland, Portugal, the Russian Federation, Spain, Sweden, Switzerland, the United Kingdom and the United States.
As described above, PISA’s target population were the 15-year-old students in each country. More specifically, PISA sampled students aged between 15 years and 3 months as the lower bound and 16 years and 2 months as the upper bound at the beginning of the assessment period. The students had to be enrolled in an educational institution, regardless of the grade level or type of institution in which they were enrolled. The average age of OECD-country students participating in PISA was 15 years and 8 months, varying by a maximum of only 2 months among the participating countries.
The PISA sampling procedure ensured that a representative sample of the target population was tested in each country. Most PISA countries employed a two-stage stratified sampling technique. The first stage drew a (usually stratified) random sample of schools in which 15-year-old students were enrolled, yielding a minimum sample of 150 schools per country. The second stage randomly sampled 35 of the 15-year-old students in each of these schools, with each 15-year-old student in a school having equal probability of selection. Within each country, this sampling procedure typically led to a sample of between 4,500 and 10,000 tested students.
The performance tests were paper and pencil tests. The assessment lasted a total of two hours for each student. Test items included both multiple-choice items and questions requiring the students to construct their own responses. The PISA tests were constructed to test a range of relevant skills and competencies that reflected how well young adults are prepared to meet the challenges of the future by being able to analyze, reason and communicate their ideas effectively. Each subject was tested using a broad sample of tasks with differing levels of difficulty in order to represent a coherent and comprehensive indicator of the continuum of students’ abilities. Using item response theory, PISA mapped performance in each subject on a scale with an international mean of 500 test-score points across the OECD countries and an international standard deviation of 100 test-score points
5 Liechtenstein was not included in our analysis due to lack of internationally comparable country-level
data, e.g. on educational expenditure per student. Note also that there were only 326 15-year-old students in Liechtenstein in total, 314 of whom participated in PISA.
7
across the OECD countries. The main focus of the PISA 2000 study was on reading literacy, with two-thirds of the testing time devoted to this subject. In the other two subjects, smaller samples of students were tested. The correlation of student performance between the three subjects is substantial, at 0.700 between reading and math (96,913 joint observations), 0.718 between reading and science (96,815) and 0.639 between math and science (39,079).
In addition to the performance tests, students as well as school principals answered respective background questionnaires, yielding rich background information on students’ personal characteristics and family backgrounds as well as on schools’ resource endowments and institutional settings. Combining the available data, we constructed a dataset containing 174,227 students in 31 countries tested in reading literacy. In math, the sample size is 96,855 students, and 96,758 students in science. The dataset combines the student test scores in reading, math and science with students’ characteristics, family-background data and school-related variables of resource use and institutional settings.6 For estimation purposes, a variety
of the qualitative variables were transformed into dummy variables.
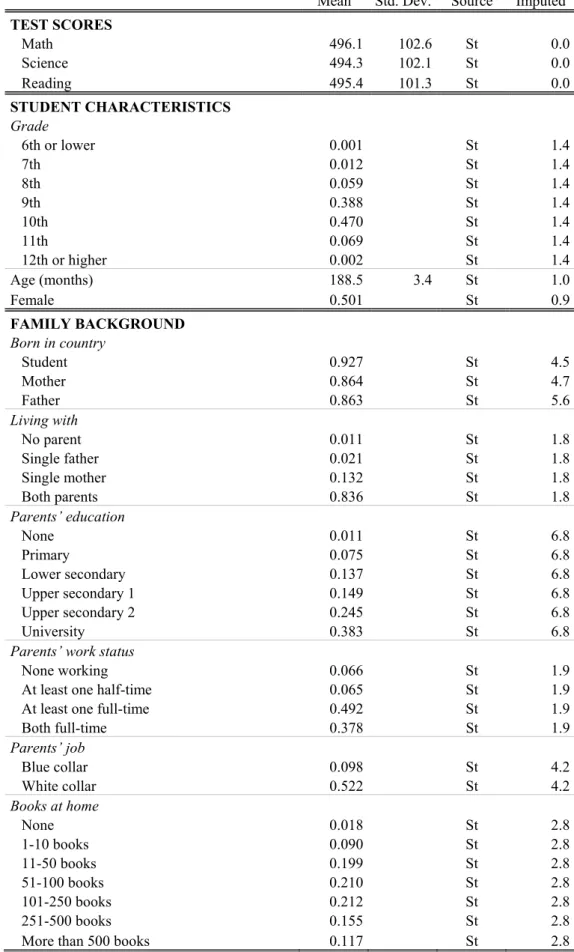
Table 1 gives an overview of the variables employed in this paper and presents their international descriptive statistics. The table also includes information on the amount of original versus missing data for each variable. In order to have a complete dataset of all students with performance data and at least some background data, we imputed missing values for individual variables using the method described in the Appendix. Given the large set of explanatory variables considered and given that each of these variables is missing for some students, dropping all student observations from the analysis which have a missing value on at least one variable would have meant a severe reduction in sample size. While the percentage of missing values of each individual variable ranges from 0.9% to 33.3% (cf. Table 1), the percentage of students with a missing value on least one of the variables reported in Table 1 is 72.6% in reading. That is, the sample size in reading would be as small as 47,782 students from 20 countries (26,228 students from 19 countries in math and 24,049 students from 19 countries in science). Apart from the general reduction in sample size, dropping all students with a missing value on at least one variable would delete the information available on the other explanatory variables for these students, and it would
6 We do not use data on teaching methods, teaching climate or teacher motivation as explanatory
variables, because we mainly view these as outcomes of the education system. First, such measures are endogenous to the institutional surrounding of the education system. This institutional surrounding sets the incentives to use specific methods and creates a specific climate, thereby constituting the deeper cause of such factors. Second, such measures may be as much the outcome of students’ performance as their cause, so that they would constitute left-hand-side rather than right-hand-side variables.
Table 1: Descriptive Statistics
Mean Std. Dev. Source Imputed
TEST SCORES Math 496.1 102.6 St 0.0 Science 494.3 102.1 St 0.0 Reading 495.4 101.3 St 0.0 STUDENT CHARACTERISTICS Grade 6th or lower 0.001 St 1.4 7th 0.012 St 1.4 8th 0.059 St 1.4 9th 0.388 St 1.4 10th 0.470 St 1.4 11th 0.069 St 1.4 12th or higher 0.002 St 1.4 Age (months) 188.5 3.4 St 1.0 Female 0.501 St 0.9 FAMILY BACKGROUND Born in country Student 0.927 St 4.5 Mother 0.864 St 4.7 Father 0.863 St 5.6 Living with No parent 0.011 St 1.8 Single father 0.021 St 1.8 Single mother 0.132 St 1.8 Both parents 0.836 St 1.8 Parents’ education None 0.011 St 6.8 Primary 0.075 St 6.8 Lower secondary 0.137 St 6.8 Upper secondary 1 0.149 St 6.8 Upper secondary 2 0.245 St 6.8 University 0.383 St 6.8
Parents’ work status
None working 0.066 St 1.9
At least one half-time 0.065 St 1.9
At least one full-time 0.492 St 1.9
Both full-time 0.378 St 1.9 Parents’ job Blue collar 0.098 St 4.2 White collar 0.522 St 4.2 Books at home None 0.018 St 2.8 1-10 books 0.090 St 2.8 11-50 books 0.199 St 2.8 51-100 books 0.210 St 2.8 101-250 books 0.212 St 2.8 251-500 books 0.155 St 2.8
More than 500 books 0.117 St 2.8
Table 1 (continued)
Mean Std. Dev. Source Imputed
School’s community location
Village or rural area (<3,000) 0.111 Sc 21.8
Small town (3,000-15,000) 0.236 Sc 21.8
Town (15,000-100,000) 0.314 Sc 21.8
City (100,000-1,000,000) 0.209 Sc 21.8
City center of city with > 1 million people 0.063 Sc 21.8 Elsewhere in city with > 1 million people 0.066 Sc 21.8
GDP per capita (1,000 $) 22.050 9.504 C 0.0
HOME INCENTIVES AND INPUTS
Parental support
Strongly lacking 0.189 Sc 3.4
Not at all lacking 0.065 Sc 3.4
Homework
Math: <1 hour per week 0.418 St 2.9
Math: >1 and <3 hours per week 0.401 St 2.9
Math: >3 hours per week 0.182 St 2.9
Science: <1 hour per week 0.500 St 4.6
Science: >1 and <3 hours per week 0.337 St 4.6
Science: >3 hours per week 0.163 St 4.6
Reading: <1 hour per week 0.478 St 2.6
Reading: >1 and <3 hours per week 0.397 St 2.6
Reading: >3 hours per week 0.126 St 2.6
Computers at home
None 0.221 St 2.7
One 0.250 St 2.7
More than one 0.529 St 2.7
RESOURCES AND TEACHERS
Educational expenditure per student (1,000 $) 5.664 2.627 C 0.0
Class size Math 23.6 8.3 St 8.7 Science 22.8 9.1 St 11.2 Reading 24.6 8.4 St 5.2 Student-teacher ratio 13.7 6.7 Sc 24.6 Instructional material
Not at all lacking 0.502 Sc 3.8
Strongly lacking 0.049 Sc 3.8
Instruction time (1,000 minutes per year)
Math 7.346 2.921 Sc 5.0
Science 7.473 4.319 Sc 5.0
Reading 7.558 3.183 Sc 5.0
Teacher education (share at school)
Masters in pedagogy 0.616 0.392 Sc 29.9
Teacher certificate 0.844 0.266 Sc 32.7
Masters in math 0.734 0.338 Sc 31.4
Masters in science 0.789 0.319 Sc 32.6
Masters in language 0.774 0.315 Sc 33.3
Table 1 (continued)
Mean Std. Dev. Source Imputed
INSTITUTIONS
Testing
External exit exam 0.578 C 0.0
Standardized tests 0.602 Sc 12.2
School autonomy
Determining course content 0.780 Sc 9.6
Choosing textbooks 0.935 Sc 9.1
Formulating school budget 0.762 Sc 9.3
Deciding on budget allocations within school 0.946 Sc 8.9
Hiring teachers 0.685 Sc 7.9
Firing teachers 0.601 Sc 8.3
Establishing teachers’ starting salaries 0.265 Sc 8.0
Determining teachers’ salary increases 0.297 Sc 8.0
Public vs. private operation and funding
Publicly managed school 0.829 Sc 22.1
Government funding (share) 0.867 0.237 Sc 5.9
Notes: Mean: International mean, based on non-imputed data for each variable, weighted by sampling probabilities. – Std. Dev.: International standard deviation (only for discrete variables). – Source: Data source and thus level of observation: St = student achievement test or student background questionnaire; Sc = school background questionnaire; C = country-level variable (see text for specific sources). – Imputed: Fraction of students with missing and thus imputed data (in percent), weighted by sampling probabilities.
8
introduce bias if the values are not missing at random. Thus, data imputation is the only viable way of performing this broad-based analysis. As described in Section 3.1 below, the estimations we employ ensure that the estimated effects of each variable are not driven by the imputed values.
In addition to the rich PISA data at the student and school level, we also use some country-level data on the countries’ GDP per capita in 2000 (measured in purchasing power parities (PPP), taken from World Bank 2003), on their average educational expenditure per student in secondary education in 2000 (measured in PPP, taken from OECD 2003),7 and on the
existence of curriculum-based external exit exams (in their majority kindly provided to us by John Bishop; cf. Bishop 2004).
3. Econometric Analysis of the Education Production Function
3.1 Estimation Equation, Covariance Structure and Sampling WeightsThe microeconometric estimation equation of the education production function has the following form:
(
isB is)
isR(
isR is)
sI(
sI s)
is B is s is is is I D D R D D B D D I R B T ε β β β β β β β β β + + + + + + + + + = 9 8 7 6 5 4 3 2 1 , (1) where Tis is the achievement test score of student i in school s. B is a vector of student background data (including student characteristics, family background and home inputs), R is a vector of data concerning schools’ resource endowment and I is a vector of institutional characteristics. The parameter vectors β1 to β9 will be estimated in the regression. Note that this specification of the international education production function restricts each effect to be the same in all countries, as well as at all levels (within schools, between schools and between countries). While it might be interesting to analyze the potential heterogeneity of certain effects between countries and between levels, regarding the object of interest of this paper it seems warranted to abstain from this effect heterogeneity and estimate a single “average” effect for each variable.8
7 For the three countries where this measure was missing in OECD (2003), we use comparable data for
these countries from World Bank (2003) and data from both sources for the countries where both are available to predict the relevant measure for the three countries by ordinary least squares.
8 Wößmann (2003a) compares this restricted specification to an alternative two-step specification,
discussing advantages and drawbacks particularly in light of potential omitted country-level variables, and favoring the specification employed here. The first, student-level step of the alternative specification includes country fixed effects in the estimation of equation (1). These country fixed effects are then regressed in a
9
As discussed in the previous section, some of the data are imputed rather than original. Generally, data imputation introduces measurement error in the explanatory variables, which should make it more difficult to observe statistically significant effects. Still, to make sure that the results are not driven by imputed data, three vectors of dummy variables DB, DR and
DI are included as controls in the estimation. The D vectors contain one dummy for each variable in the three vectors B, R and I that takes the value of 1 for observations with missing and thus imputed data and 0 for observations with original data. The inclusion of the D
vectors as controls in the estimation allows the observations with missing data on each variable to have their own intercepts. Furthermore, the inclusion of the interaction terms between imputation dummies and the data vectors, DBB, DRR and DII, allows them to also have their own slopes for the respective variables. These imputation controls for each variable with missing values ensure that the results are robust against possible bias arising from data imputation.
Owing to the complex data structure produced by the PISA survey design and the multi-level nature of the explanatory variables, the error term ε of the regression has a non-trivial structure. Although we include a considerable amount of school-related variables, we cannot be sure that there are no omitted variables at the school level. Given the possible dependence of students within the same school, the use of school-level variables and the fact that schools were the primary sampling unit (PSU) in PISA (see Section 2.2), there may be unobservable correlation among the error terms εi at the school level (cf. Moulton 1986 for this problem of a hierarchical data structure). We correct for potential correlations of the error terms by imposing an adequate structure on the covariance matrix. Thus, we suppose the error term to have the following structure:
i s is η υ
ε = + , (2)
where ηs is the school-level element of the error term and υi is the student-specific element of the error term. We use clustering-robust linear regressions (CRLR) to estimate standard errors that recognize this clustering of the student-level data within schools. The CRLR method relaxes the independence assumption and requires only that the observations be independent across the PSUs, i.e. across schools. By allowing any given amount of correlation within the
second, country-level step on averages at the country level of relevant explanatory variables. Wößmann (2003a) finds that the substantive results of the two specifications are virtually the same. Furthermore, our results presented in Section 6 below show that our restricted model can account for more than 85% of the between-country variation in test scores in each subject. Therefore, the scope for obvious unobserved between-country-specific heterogeneity, and thus the need for the country-fixed-effects specification, seems small.
10
PSUs, CRLR estimates appropriate standard errors when many observations share the same value on some but not all independent variables (cf. Deaton 1997). To avoid inefficiency due to heteroscedasticity, CRLR imposes a clustered covariance structure on the covariance matrix, allowing within-school correlations of the error term. Thus, the form of the covariance matrix V is ⎟ ⎟ ⎟ ⎟ ⎟ ⎟ ⎠ ⎞ ⎜ ⎜ ⎜ ⎜ ⎜ ⎜ ⎝ ⎛ Σ Σ = l V 0 0 0 0 0 0 0 0 0 0 0 0 0 0 0 0 0 0 0 0 1 O O O , (3)
with ∑i (i=1,…,l) representing the covariance matrices of the residuals of least-square regressions within each school cluster (PSU). Observations of two different PSUs are thus assumed to be independent and uncorrelated, leading to the block-diagonal matrix V with PSUs as diagonal elements. This method yields consistent and efficient estimates, enabling valid statistical inferences of the obtained estimation results (cf. White 1984).
Finally, PISA used a stratified sampling design within each country, producing varying sampling probabilities for different students. To obtain nationally representative estimates from the stratified survey data at the within-country level, we employ weighted least squares (WLS) estimation using sampling probabilities as weights. WLS estimation ensures that the proportional contribution to the parameter estimates of each stratum in the sample is the same as would have been obtained in a complete census enumeration (DuMouchel and Duncan 1983; Wooldridge 2001). Furthermore, at the between-country level, our weights give equal weight to each of the 31 countries.
3.2 Cross-sectional Data and Potential Resource Endogeneity
The econometric estimation of the PISA dataset is restricted by its cross-sectional nature, which does not allow for panel or value-added estimations. This does not yield estimation biases as long as the explanatory variables are exogenous to the dependent variable and as long as they and their impact on the dependent variable do not vary over time. It seems straightforward that the student-specific family background Bis is exogenous to the students’ educational performance. Furthermore, most aspects of the family background Bis are time-invariant, so that the characteristics observed at the given point in time of the PISA survey should be consistent indicators for family characteristics in the past. Therefore,
student-11
related family background, as well as other student-related characteristics like area of residence, affect not only the educational value-added in the year of examination but rather the educational performance through a student’s entire school life. A level-estimation approach thus seems well-suited for determining the total effects of family background and student-related characteristics on students’ achievements.
A similar case can be made with respect to institutional differences. The institutional features Is of an education system may be reasonably assumed to be exogenous to individual students’ performance. However, a caveat applies here in that a country’s institutions may be related to unobserved, e.g. cultural, factors which in turn may be related to student performance. To the extent that this may be an important issue, caution should prevail in drawing causal inferences and policy conclusions from the presented results. In terms of time variability, changes in institutions generally occur only gradually and evolutionary rather than radically, particularly in democratic societies. Therefore, the institutional structures of education systems are highly time-invariant and thus most likely constant, or at least rather similar, during a student’s school life. We therefore assume that the educational institutions observed at one point in time persist unchanged during the whole student life and thus contribute to students’ achievement levels, and not only to the change in one period relative to the previous school period.
The situation becomes more problematic when students’ resource endowments Ris are concerned. For example, educational expenditure per student have been shown to vary considerably over time (cf. Gundlach et al. 2001). Still, as far as the cross-country variation in educational expenditure is concerned, the assumption of relatively constant relative expenditure levels seems not too implausible, so that country-level estimates of expenditure per student in the year of the PISA survey may yield a reasonable proxy for the overall expenditure per student over students’ hitherto school life.
However, students’ educational resource endowments are not necessarily exogenous to their educational performance. Resource endogeneity should not be a serious issue at the country level, due to a missing supranational government body redistributing educational expenditures according to students’ achievement and due to international mobility constraints. But within countries, endogenous resource allocations, both between and within schools, may bias least-squares estimates of the effects of resources on student performance. In order to avoid biases due to the within-school sorting of school resources according to the needs and achievement of students, Akerhielm (1995) suggests an IV estimation approach that uses
12
exogenous school-level variables as instruments for class size. Accordingly, in our regressions we use the student-teacher ratio at the school level as an instrument for the actual class size in each subject in a two-stage least squares (2SLS) estimation.9 However, this
approach may still be subject to between-school sorting of differently achieving students according to schools’ resource endowments, e.g. caused by school-related settlement decisions of parents. To the extent that the between-school sorting is unrelated to the family-background and institutional characteristics for which we control in our regressions, it might still bias the estimated resource effects. Furthermore, variation in individual students’ resource endowments over time, e.g. class-size variation, may also bias the levels-based estimates, generally resulting in a downward attenuation bias. The PISA data do not allow for overcoming these possibly remaining biases.
4. Estimation Results
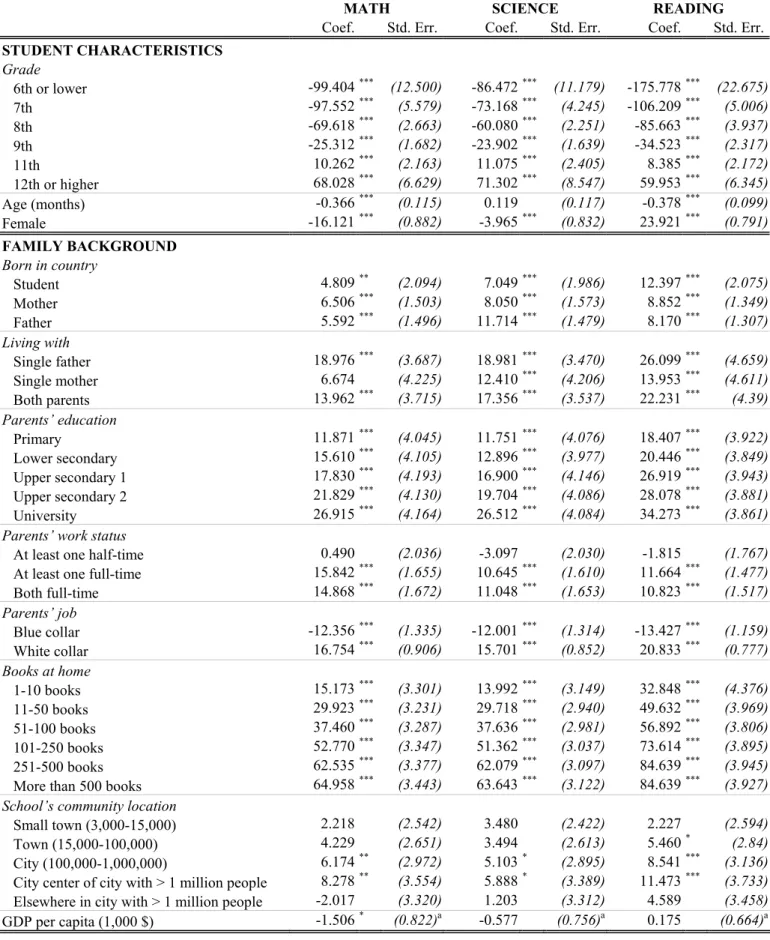
This section discusses the results of estimating equation (1) for the three subjects. The results are reported in Table 2. The discussion is subdivided by categories of explanatory variables: first, student characteristics, family background and home inputs; second, resources and teacher characteristics; and third, institutions. The discussion generally begins with results in math and science, the two subjects that have been studied before, and then extends to results in reading.
4.1 Student Characteristics, Family Background and Home Inputs
In all three subjects, the educational performance of 15-year-old students increases statistically significantly with the grade level in which they are enrolled. Particularly at the lower grades, this effect is larger in reading than in math and science. For example, 15-year-olds enrolled in 7th grade perform 106.2 achievement points (AP) lower in the reading test than 15-year-olds enrolled in 10th grade.10 Controlling for the grade level, students’ age is
9 Note that this approach also accounts for measurement-error biases in the class-size variable.
10 It is not obvious that the regressions should control for the grade level. Given the age-based target
population of the PISA study, the grade in which a student is taught will to some extent be endogenous to the student’s performance, particularly in systems where grade repetition is common. However, in the cross-country analysis, the grade controls will also account for international difference in school entry age, which should be controlled for. Unfortunately, we do not have data on individual school entry age, nor on grade repetition. Thus, to check for robustness of our results, we repeated the regressions without the grade controls. There were no qualitative changes at all to the presented results, with the sole exception on the effect of the share of a school’s government funding, which will be discussed in Section 4.3 below. Given that there are strong reasons to expect the government-funding result to be biased without grade controls, we decided to present the regressions that control for the grade level.
Table 2: International Education Production Functions
MATH SCIENCE READING
Coef. Std. Err. Coef. Std. Err. Coef. Std. Err.
STUDENT CHARACTERISTICS Grade 6th or lower -99.404*** (12.500) -86.472*** (11.179) -175.778*** (22.675) 7th -97.552*** (5.579) -73.168*** (4.245) -106.209*** (5.006) 8th -69.618*** (2.663) -60.080*** (2.251) -85.663*** (3.937) 9th -25.312*** (1.682) -23.902*** (1.639) -34.523*** (2.317) 11th 10.262*** (2.163) 11.075*** (2.405) 8.385*** (2.172) 12th or higher 68.028*** (6.629) 71.302*** (8.547) 59.953*** (6.345) Age (months) -0.366*** (0.115) 0.119 (0.117) -0.378*** (0.099) Female -16.121*** (0.882) -3.965*** (0.832) 23.921*** (0.791) FAMILY BACKGROUND Born in country Student 4.809** (2.094) 7.049*** (1.986) 12.397*** (2.075) Mother 6.506*** (1.503) 8.050*** (1.573) 8.852*** (1.349) Father 5.592*** (1.496) 11.714*** (1.479) 8.170*** (1.307) Living with Single father 18.976*** (3.687) 18.981*** (3.470) 26.099*** (4.659) Single mother 6.674 (4.225) 12.410*** (4.206) 13.953*** (4.611) Both parents 13.962*** (3.715) 17.356*** (3.537) 22.231*** (4.39) Parents’ education Primary 11.871*** (4.045) 11.751*** (4.076) 18.407*** (3.922) Lower secondary 15.610*** (4.105) 12.896*** (3.977) 20.446*** (3.849) Upper secondary 1 17.830*** (4.193) 16.900*** (4.146) 26.919*** (3.943) Upper secondary 2 21.829*** (4.130) 19.704*** (4.086) 28.078*** (3.881) University 26.915*** (4.164) 26.512*** (4.084) 34.273*** (3.861)
Parents’ work status
At least one half-time 0.490 (2.036) -3.097 (2.030) -1.815 (1.767)
At least one full-time 15.842*** (1.655) 10.645*** (1.610) 11.664*** (1.477)
Both full-time 14.868*** (1.672) 11.048*** (1.653) 10.823*** (1.517) Parents’ job Blue collar -12.356*** (1.335) -12.001*** (1.314) -13.427*** (1.159) White collar 16.754*** (0.906) 15.701*** (0.852) 20.833*** (0.777) Books at home 1-10 books 15.173*** (3.301) 13.992*** (3.149) 32.848*** (4.376) 11-50 books 29.923*** (3.231) 29.718*** (2.940) 49.632*** (3.969) 51-100 books 37.460*** (3.287) 37.636*** (2.981) 56.892*** (3.806) 101-250 books 52.770*** (3.347) 51.362*** (3.037) 73.614*** (3.895) 251-500 books 62.535*** (3.377) 62.079*** (3.097) 84.639*** (3.945)
More than 500 books 64.958*** (3.443) 63.643*** (3.122) 84.639*** (3.927)
School’s community location
Small town (3,000-15,000) 2.218 (2.542) 3.480 (2.422) 2.227 (2.594)
Town (15,000-100,000) 4.229 (2.651) 3.494 (2.613) 5.460* (2.84)
City (100,000-1,000,000) 6.174** (2.972) 5.103* (2.895) 8.541*** (3.136)
City center of city with > 1 million people 8.278** (3.554) 5.888* (3.389) 11.473*** (3.733)
Elsewhere in city with > 1 million people -2.017 (3.320) 1.203 (3.312) 4.589 (3.458)
GDP per capita (1,000 $) -1.506* (0.822)a -0.577 (0.756)a 0.175 (0.664)a
Table 2 (continued)
MATH SCIENCE READING
Coef. Std. Err. Coef. Std. Err. Coef. Std. Err.
HOME INCENTIVES AND INPUTS
Parental support
Strongly lacking -20.830*** (1.933) -19.442*** (1.891) -23.671*** (2.133)
Not at all lacking 14.962*** (2.643) 8.722*** (2.291) 10.460*** (2.487)
Homework
>1 and <3 hours per week 8.639*** (0.838) 6.920*** (0.901) 8.391*** (0.722)
>3 hours per week 11.067*** (1.105) 8.265*** (1.189) 4.413*** (1.139)
Computers at home
One -3.921*** (1.174) -2.493** (1.070) -4.227*** (1.026)
More than one -9.804*** (1.192) -10.723*** (1.154) -10.381*** (1.055)
RESOURCES AND TEACHERS
Educational expenditure per student (1,000 $) 10.720*** (3.579)a 7.732** (3.212)a 1.520 (4.642)a
Class size (m/s/r) (instr. by stud.-teacher ratio) 0.754* (0.418) 1.554*** (0.423) 0.493 (0.393) Instructional material
Not at all lacking 8.163*** (1.364) 8.087*** (1.312) 8.790*** (1.437)
Strongly lacking -13.906*** (3.458) -6.146* (3.389) -6.089 (3.795)
Instruction time (1,000 minutes per year) (m/s/r) 0.759*** (0.197) 1.126*** (0.191) -0.388** (0.180) Teacher education (share at school)
Masters in pedagogy 4.348* (2.245) 9.401*** (2.047) 6.166*** (2.139)
Teacher certificate 15.112*** (2.954) 15.222*** (3.010) 11.719*** (3.187)
Masters in subject (m/s/r) 10.909*** (2.602) 8.333*** (2.383) 16.429*** (2.768)
INSTITUTIONS
Testing
External exit exam 19.051* (9.553)a 15.017 (9.085)a 6.862 (8.595)a
Standardized tests 1.060 (1.524) 1.263 (1.376) 2.082 (1.481)
School autonomy
Determining course content 1.931 (1.714) -0.491 (1.602) -1.065 (1.657)
Choosing textbooks 19.972*** (4.587) 30.820*** (4.307) 31.328*** (5.223)
Formulating school budget -7.499*** (1.848) -6.367*** (1.718) -3.059 (1.869)
Deciding on budget allocations within school 12.604*** (3.243) 14.395*** (3.041) 10.142*** (2.972)
Hiring teachers 11.923*** (2.259) 2.723 (2.190) 5.316** (2.348)
Firing teachers -1.775 (2.114) -2.746 (2.014) -4.882** (2.154)
Establishing teachers’ starting salaries -2.967 (2.496) -2.589 (2.199) -4.909** (2.325)
Determining teachers’ salary increases -2.405 (2.418) -3.478 (2.145) -2.084 (2.260) Public vs. private operation and funding
Publicly managed school -19.549*** (2.464) -15.805*** (2.236) -15.362*** (2.193)
Government funding (share) 13.479*** (3.816) 3.597 (3.428) 0.289 (3.488)
Imputation dummies incl. incl. incl.
Students (units of observation) 96,855 96,758 174,227
Schools (PSUs) 6,611 6,613 6,626
Countries (strata) 31 31 31
R2 0.327 0.276 0.337
R2 (without imputation controls) 0.301 0.249 0.306
Notes: Dependent variable: PISA international test score. – 2SLS regression in each subject, with class size instrumented by schools’ student-teacher ratio. Regressions weighted by students’ sampling probabilities. – Coef.: Coefficient estimate. – Std. Err.: Clustering-robust standard error (taking account of correlated error terms within schools). – a Clustering-robust standard
errors (and thus significance levels) based on countries rather than schools as clusters.
13
statistically significantly negatively related to math and reading performance, presumably reflecting grade repetition effects. This age effect is relatively small, though, with a maximum performance difference between the oldest and youngest students in the sample, who are 13 months of age apart, of 4.9 AP in reading.
In math and science, boys perform statistically significantly better than girls, at 16.1 AP in math and 4.0 AP in science. The opposite is true for reading, where girls outperform boys by 23.9 AP. Given that the test scores are scaled to have an international standard deviation among the OECD countries of 100, the size of these effects can be interpreted as percentage points of an international standard deviation. As a concrete benchmark for size comparisons, the unconditional performance difference between 9th- and 10th-grade students (the two largest grade categories) in our sample is 30.3 AP in math, 32.4 in science and 33.2 in reading. That is, the boys’ lead in math equals roughly half of this grade equivalent, and the girls’ lead in reading equals roughly two thirds of the grade equivalent. As an alternative benchmark, when estimating the average unconditional performance difference per month between students of different age and extrapolating this to a performance difference per year of age, this is equal to 12.9 AP in math, 19.3 in science and 16.4 in reading.
The immigration status of students and their families is also statistically significantly related to their educational achievement. Students born in their country of residence perform 4.8 AP better in math than students not born in the country. Additionally, students performed 6.5 AP better when their mother was born in the country, and 5.6 AP if their father was born in the country. In sum, these three immigration effects add up to a performance difference of 16.9 AP between students from native families and students who themselves and whose parents were not born in the country. The effects are even bigger in science and reading than in math, at more than 26 AP.
There is a clear pattern of performance differences by family status. Students who live with both parents perform better than students who live with a single mother, the latter perform better than students who live with a single father, and the latter perform better than students who do not live with any parent.11 In each subject, student performance increases
steadily with each higher category of parents’ education.12 The effect of parental education is
larger in reading than in math and science, with the maximum performance difference
11 In math, the difference between students who live with a single father and students who live with no
parent is not statistically significant.
12 Parental education is measured by the highest educational category achieved by either father or mother,
14
between students whose parents did not complete primary education and students whose parents have a university degree being 34.3 AP in reading, 26.9 in math and 26.5 in science.
Two categories of variables that have not been available in the previous international achievement tests concern the work status of students’ parents. First, students who had at least one parent working full time performed statistically significantly better than students whose parents did not work, at between 10.6 and 15.8 AP in the three subjects. However, there was no statistically significant performance difference between students whose parents did not work and students whose parents worked at most half-time. Neither was there a statistically significant performance difference depending on whether one or both parents worked full-time. Second, students’ performance also differed statistically significantly depending on their parents’ occupation. Children of blue-collar workers performed between 12.0 and 13.4 AP worse than the residual category, and children of white-collar workers performed between 15.7 and 20.8 AP better than the residual category.13 As throughout the paper, these effects
are calculated holding all other influence factors constant. For example, they are estimated for a given level of parental education.
Another indicator of family background that is strongly and statistically significantly related to student performance is the number of books in the students’ home. For example, students with more than 500 books at home performed 65.0 AP better in math than students without any books at home. The effect size is similar in science, but larger in reading at 84.6 AP. Note that while the performance of students increases steadily with the number of books in their home increasing to 500 books, the effect of this indicator seems to peter out at more than 250 books. The performance difference between 250-500 books and more than 500 books is not statistically significant in any subject.
In comparison to the previous effects, performance differences by community location of the schools are relatively modest. Only in cities with more than 100,000 inhabitants is there a statistically significant superior performance relative to village locations in all three subjects. With cities of more than 1 million inhabitants, there is a performance advantage relative to village schools for schools located in the city center, but not for schools located elsewhere in
13 White-collar workers were defined as major group 1-3 of the International Standard Classification of
Occupations (ISCO), encompassing legislators, senior officials and managers; professionals; and technicians and associate professionals. Blue-collar workers were defined as ISCO 8-9, encompassing plant and machine operators and assemblers; and sales and services elementary occupations. The residual category between the two, ranging from ISCO 4-7, encompasses clerks; services workers and shop and market sales workers; skilled agricultural and fishery workers; and craft and related trades workers. The variable was set to while-collar if at least one parent was in ISCO 1-3, and to blue-collar if no parent was in ISCO 1-7.
15
the city. Finally, in contrast to previous studies, student performance is not statistically significantly related to higher GDP per capita in our basic specification, once all the other impact factors are controlled for. This finding may be partly due to the fact that PISA features the relatively homogenous sample of OECD countries, which are all developed countries among which differences in GDP per capita may play a minor role for student achievement. In math, the estimate in the basic specification is even statistically significantly negative, but this finding vanishes once additional interaction effects between institutional factors are taken into account as in Section 5 below. In this latter specification, the effect of GDP per capita in reading turns statistically significantly positive.
Summarizing across the subjects, the results on effects of student characteristics and family background in reading are qualitatively the same as in math and science, with the sole exception of the gender effect. Furthermore, most of the family-background effects tend to be larger in reading than in math and science. In general, the results are very much in line with results derived from previous international student achievement tests (e.g., Wößmann 2003a). In addition to measures of student characteristics and family background, we observe three features of incentives and inputs in the students’ home. Students in schools whose principals reported that learning was strongly hindered by lack of parental support performed significantly worse in all subjects. The opposite was true for students in schools whose principals reported that learning was not at all hindered by lack of parental support.
Another input factor at home is the homework done by students. Students reporting that they spent more than one hour on homework and study per week in the specific subject performed statistically significantly better than students who spent less than one hour on homework per week. In math and science, students who spent more than three hours performed even better. This was not the case in reading, where students spending more than three hours performed lower than students spending between one and three hours, suggesting that reading performance might be an inverted-U shaped function of homework time. The generally positive effect of homework found in PISA differs from previous findings based on TIMSS, where no such effect was found (Wößmann 2003a). This may mainly reflect improved data in PISA, as the homework variable in TIMSS reflected teachers’ reports on how much time of homework they assigned, while the homework variable in PISA reflects students’ reports on how much time they actually spent doing homework. The differing findings may reflect that homework assigned by the teacher may be very different from homework completed by the students.
16
A third home input factor deemed to be increasingly important in modern societies is the availability of computers at home. The bivariate correlation between PISA performance and computers at home is statistically significantly positive in all three subjects. This positive relation also carries through to multivariate regressions that additionally control for grade, age and gender. However, once all other influence factors in Table 2 are controlled for – and particularly, once family background is controlled for – the relationship between student achievement and their having one or more computers at home turns around to be statistically significantly negative. That is, the bivariate positive correlation between computers and performance seems to capture other positive family-background effects that are not related to computers, due to a positive correlation between computer availability and these other family-background characteristics. Holding the other family-family-background characteristics constant, students perform significantly worse if they have computers at home. This may reflect the fact that computers at home may actually distract students from learning, both because learning with the help of computers may not be the most efficient way of learning and because computers can be used for other aims than learning. This complements and corroborates the finding by Angrist and Lavy (2002) that computer availability in the classroom does not seem to advance student performance.
4.2 Resources and Teacher Characteristics
Educational expenditure per student at the country level is statistically significantly related to better performance in math and science, which contrasts with Wößmann’s (2003a) finding using TIMSS data. Holding all other inputs considered in this analysis constant, additional educational spending goes hand in hand with higher PISA performance in these two subjects. The size of the effect is small, though, at 10.7 AP in math and 7.7 AP in science for each 1,000 $ of additional annual spending. There is no statistically significant relationship between expenditure and performance in reading. Once the four countries with particularly low spending levels are excluded from the sample, the effect in math also gets statistically insignificant, suggesting that the expenditure effect is largely driven by a few countries at the bottom, but is not existent among the developed OECD countries.14
14 The OECD (2001) reports a measure of cumulative expenditure on educational institutions per student
for 24 countries, which cumulates expenditure at each level of education over the theoretical duration of education at the respective level up to the age of 15. Using this alternative measure of educational expenditure, we find equivalent results of a statistically significant relation with math performance, a weakly statistically significant relation with science performance, and a statistically insignificant relation with reading performance. Given that this measure is available for only 24 countries, and given that it partly proxies for the duration of
17
In order to account for the biasing effects of within-school sorting, class size is instrumented by the student-teacher ratio at the school level (cf. Section 3.2 above). Still, class size is positively related to student performance, and statistically significantly so in math and science. This counterintuitive finding may be largely due to between-school sorting effects, in that parents of low-performing children may tend to move into districts with smaller classes and school systems may stream low-performing students into schools with smaller classes (cf. West and Wößmann 2003).
In terms of material inputs, we use questionnaire answers by school principals on how much learning in their school is hindered by lack of instructional material, such as textbooks. Students in schools whose principals reported no hindrance due to a lack of instructional material performed statistically significantly better than students in schools whose principals reported a lot of hindrance, with an effect size of up to 22 AP in math.
Instruction time in the specific subject, measured in minutes per year, is statistically significantly related to higher performance in math and science. Counterintuitively, the relationship is statistically significantly negative in reading, which might in part be due to the fact that language classes may not teach the skills tested by PISA’s “reading literacy”. All instruction-time effects are quite small, though, with 1,000 instructional minutes per year (equivalent to 13% of the total instruction time in the subject) related to at most 1.1 AP.
Students in schools whose teachers had on average a higher level of education performed statistically significantly better than otherwise. This is true for degrees in pedagogy, in the respective subject and for specific teacher certificates. In math and reading, the relationship is substantially stronger for a masters degree in the subject than a masters degree in pedagogy. In math and science, a full teacher certification by the appropriate authority shows the strongest relationship to student performance, at 15 AP.
In sum, the general pattern of findings on resource effects is that resources seem to be positively related to student performance, once family-background and institutional effects are extensively controlled for. This holds particularly in terms of the quality of instructional material and of the teaching force. By contrast, we could not find positive effects of reduced class sizes. The effects of general increases in educational expenditure per student seem to be relatively small, not guaranteeing that the benefits of general increases warrant the costs.
schooling in different countries, we stick to our alternative measure of average annual educational expenditure per student in secondary education.
18
4.3 Institutional Effects
Economic theory suggests that external exit exams, which report performance relative to an external standard, may affect student performance positively (cf. Bishop and Wößmann 2004; Costrell 1994; Betts 1998). In line with this argument, students in school systems with external exit exams perform statistically significantly better by 19.1 AP in math than students in school systems without external exit exams. This effect replicates previous findings based on other studies (Bishop 1997; Wößmann 2003a, 2003b). Likewise, the relationship in science is statistically significant at the 11 percent level. In reading, the relationship is also positive, but not statistically significant. However, we do not have direct data on external exit exams in reading, so that the measure used here is a simple mean between math and science. Therefore, this smaller effect might be driven by attenuation bias due to measurement error. Furthermore, the low levels of statistical significance in all three subjects may reflect that the existence of external exit exams is measured at the country level, so that we have only 31 independent observations on this variable. Still, the pattern of results gives a hint that external exit exams may be more important for performance in math and science, relative to reading (cf. also Bishop 2004).
At the school level, we also have information on whether standardized testing was used for 15-year-old students at least once a year. As long as the existence of external exit exams is controlled for, standardized testing is not statistically significantly related to student performance. However, leaving external exit exams out of the regression, standardized testing is statistically significantly related to better student performance in all three subjects. Although the effect sizes are relatively small at between 2.3 and 3.9 AP, this still hints at positive effects of standardized testing also in reading, where the estimate on external exit exams was not statistically significant. Furthermore, while this section only looks at main institutional effects, we will see in Section 5 below that there are important interaction effects between standardized testing and external exit exams.
Economic theory suggests that school autonomy in such areas as process operations and personnel-management decisions may be conducive to student performance by using local knowledge to increase the effectiveness of teaching. By contrast, school autonomy in areas that allow for strong local opportunistic behavior, such as standard and budget setting, may be detrimental to student performance by increasing the scope for diverting resources from teaching (cf. Bishop and Wößmann 2004). Supporting this theory, we find that school autonomy in the process operation of choosing textbooks is statistically significantly and
19
strongly related to superior student performance in all three subjects. The size of the effect ranges from 20.0 AP in math to 31.3 AP in reading.
Similarly, school autonomy in deciding on budget allocations within schools are statistically significantly related to higher achievement in all three subjects, once the level at which the budget is formulated is held constant. By contrast, students in schools that have autonomy in formulating their school budget perform worse, and statistically significantly so in math and science. This combination of effects, which suggests having the size of the budget externally determined while having schools decide on within-school budget allocations themselves, replicates and corroborates the findings reported in Wößmann (2003a). Furthermore, the indicator of within-school budget allocation available in PISA seems to be superior to the data previously used in TIMSS, where this indicator was not available and information on teachers’ influence on purchasing supplies was used as a proxy instead.
With regard to personnel-management decisions, students in schools that have autonomy in hiring their teachers perform statistically significantly better in math and reading. This finding also corroborates theory (Bishop and Wößmann 2004) and previous evidence (Wößmann 2003a). School autonomy in firing teachers, information not previously available, is not statistically significantly related to student performance in math and science, and statistically significantly negatively in reading, once autonomy in hiring teachers is held constant. Hiring and firing autonomy are strongly collinear, though. Estimating the model without holding hiring autonomy constant yields a statistically significant positive relation of firing autonomy to math performance, and statistically insignificant relations to science and reading performance. It seems, though, that firing autonomy does not show an additional positive effect when added to hiring autonomy. However, questionnaire data on firing autonomy may be vague and misleading, as it may not be obvious to principals whether the question means that they can generally fire poor teachers or that they can fire teachers just if teachers strongly and obviously misbehave, e.g. by breaking laws. This may limit the interpretability of the firing result. Also, there are important interactions between firing autonomy and the existence of external exit exams (cf. Section 5 below).
On another dimension of personnel-management decisions, the establishment of teacher salaries, we mostly do not find a statistically significant relationship between school autonomy and student performance. This is true for school autonomy both in establishing teachers’ starting salaries and in establishing teachers’ salary increases. Only in the
20
determination of starting salaries, there is a statistically signifi