Data Article
Learning analytics: Dataset for empirical
evaluation of entry requirements into
engineering undergraduate programs
in a Nigerian university
Jonathan A. Odukoya
a, Segun I. Popoola
b,⁎,
Aderemi A. Atayero
b, David O. Omole
c, Joke A. Badejo
b,
Temitope M. John
b, Olalekan O. Olowo
ba
Department of Psychology, Covenant University, Ota, Nigeria b
Department of Electrical and Information Engineering, Covenant University, Ota, Nigeria c
Department of Civil Engineering, Covenant University, Ota, Nigeria
a r t i c l e i n f o
Article history:Received 23 January 2018 Received in revised form 6 February 2018 Accepted 12 February 2018 Available online 15 February 2018 Keywords:
Smart campus Learning analytics Sustainable education Nigerian university Education data mining Engineering
a b s t r a c t
In Nigerian universities, enrolment into any engineering under-graduate program requires that the minimum entry criteria established by the National Universities Commission (NUC) must be satisfied. Candidates seeking admission to study engineering discipline must have reached a predetermined entry age and met the cut-off marks set for Senior School Certificate Examination (SSCE), Unified Tertiary Matriculation Examination (UTME), and the post-UTME screening. However, limited effort has been made to show that these entry requirements eventually guarantee suc-cessful academic performance in engineering programs because the data required for such validation are not readily available. In this data article, a comprehensive dataset for empirical evaluation of entry requirements into engineering undergraduate programs in a Nigerian university is presented and carefully analyzed. A total sample of 1445 undergraduates that were admitted between 2005 and 2009 to study Chemical Engineering (CHE), Civil Engineering (CVE), Computer Engineering (CEN), Electrical and Electronics Engineering (EEE), Information and Communication Engineering (ICE), Mechanical Engineering (MEE), and Petroleum Engineering (PET) at Covenant University, Nigeria were randomly selected.
Contents lists available atScienceDirect
journal homepage:www.elsevier.com/locate/dib
Data in Brief
https://doi.org/10.1016/j.dib.2018.02.025
2352-3409/&2018 The Authors. Published by Elsevier Inc. This is an open access article under the CC BY license (http://creativecommons.org/licenses/by/4.0/).
⁎Corresponding author.
Entry age, SSCE aggregate, UTME score, Covenant University Scholastic Aptitude Screening (CUSAS) score, and the Cumulative Grade Point Average (CGPA) of the undergraduates were obtained from the Student Records and Academic Affairs unit. In order to facilitate evidence-based evaluation, the robust dataset is made publicly available in a Microsoft Excel spreadsheetfile. On yearly basis,first-order descriptive statistics of the dataset are presented in tables. Box plot representations, frequency distribution plots, and scatter plots of the dataset are provided to enrich its value. Furthermore, correlation and linear regression analyses are per-formed to understand the relationship between the entry requirements and the corresponding academic performance in engineering programs. The data provided in this article will help Nigerian universities, the NUC, engineering regulatory bodies, and relevant stakeholders to objectively evaluate and subsequently improve the quality of engineering education in the country.
&2018 The Authors. Published by Elsevier Inc. This is an open access article under the CC BY license (http://creativecommons.org/licenses/by/4.0/).
Specifications Table
Subject area Engineering Education More specific
sub-ject area
Learning Analytics
Type of data Tables, graphs,figures, and spreadsheetfile How data was
acquired
For thefive-year period of admission reported in this data article (2005–2009), the entry age, SSCE aggregate, UTME score, CUSAS score, and the CGPA of the undergraduates were obtained from the Student Records and Academic Affairs unit
Data format Raw, analyzed Experimental
factors
Engineering undergraduates without all of the required variables (entry age, SSCE aggregate, UTME score, CUSAS score, and the CGPA) were excluded in this study
Experimental features
On yearly basis,first-order descriptive statistics of the dataset are presented in tables. Box plot representations, frequency distribution plots, and scatter plots of the dataset are provided to enrich its value. Furthermore, correlation and linear regression analyses are performed to understand the relationship between the entry requirements and the corresponding academic performance in engineering programs
Data source location
The dataset provided in this article were obtained at Covenant University, Canaanland, Ota, Nigeria (Latitude 6.6718oN, Longitude 3.1581oE)
Data accessibility In order to facilitate evidence-based evaluation of the entry requirements into engineering programs, the comprehensive dataset is made publicly available in a Microsoft Excel spreadsheetfile
Value of the data
The data is highly imperative for empirical evaluation of the relationship between entry qualifi -cations and the academic performance of engineering undergraduates in Nigerian universities. This will help in determining the suitability and appropriateness of the admission policy set by uni-versities and the NUC to engineering education in Nigeria[1,2].engineering regulatory bodies, and relevant stakeholders to objectively evaluate and subsequently improve the quality of engineering education in the country[3–6].
Most of work that are published in this regard are mostly based on arguments that are void of empirical evidences [7]. On the contrary, availability of this vital data will encourage evidence-based studies are capable of stimulating informed, valid and reliable decisions. On yearly basis,first-order descriptive statistics of the dataset are presented in tables. Box plot representations, frequency distribution plots, and scatter plots of the dataset are provided to enrich its value. Furthermore, correlation and linear regression analyses are performed to understand the relationship between the entry requirements and the corresponding academic performance in engineering programs[8–11].1. Data
Ability to correctly predict students’performance in tertiary institutions at the point of entry usually play a vital role in career guidance and appropriate placements. This will ultimately avert frustrations cum wastage of material andfinancial resources which often trail wrong students’ pla-cement. The spate of dismal indigenous national development in many developing nations could be partly attributed to wrong students’ placement in tertiary institutions. In Nigerian universities, enrolment into any engineering undergraduate program requires that the minimum entry criteria established by the NUC must be satisfied. Candidates seeking admission to study engineering dis-cipline must have reached a predetermined entry age and met the cut-off marks set for SSCE, UTME, and the post-UTME screening. However, limited effort has been made to show that these entry requirements eventually guarantee successful academic performance in engineering programs because the data required for such validation are not readily available. Dataset for empirical eva-luation of entry requirements into engineering undergraduate programs in a Nigerian university is provided and explored in this data article.
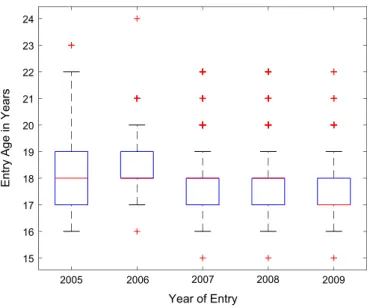
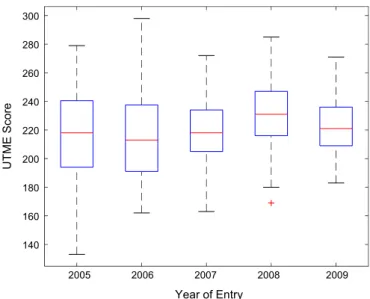
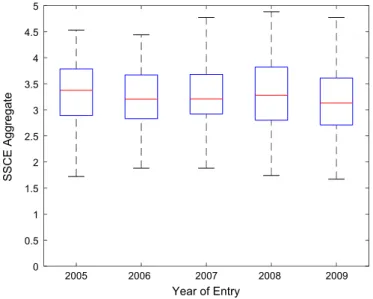
Descriptive statistics of the entry qualifications and the corresponding academic performance of the undergraduates admitted into the seven engineering programs at Covenant University between 2005 and 2009 are presented inTables 1–5. Each of the tables shows the mean, median, mode, standard deviation, variance, kurtosis, skewness, range, minimum, maximum, and sample size of the entry age, UTME score, CUSAS score, SSCE aggregate, and the CGPA. The boxplot representations of the entry qualifications and the CGPA are shown inFigs. 1–5to show the variations across the year of study.
Table 1
Descriptive statistics of entry requirements in 2005 and the CGPA.
Entry Age UTME Score CUSAS Score SSCE Aggregate Cumulative GPA
Mean 18.34 217.40 67.53 3.33 3.60 Median 18 218 67.2 3.375 3.675 Mode 18 214 55.8 3.75 3.73 Standard Deviation 1.34 29.46 8.90 0.60 0.70 Variance 1.80 867.80 79.27 0.37 0.49 Kurtosis 3.85 2.42 2.49 2.44 2.64 Skewness 0.87 −0.14 −0.03 −0.10 −0.45 Range 7 146 41.6 2.81 3.01 Minimum 16 133 45.8 1.72 1.84 Maximum 23 279 87.4 4.53 4.85 Total Samples 184 184 184 184 184
Table 2
Descriptive statistics of entry requirements in 2006 and the CGPA.
Entry Age UTME Score CUSAS Score SSCE Aggregate Cumulative GPA
Mean 18.55 215.05 60.66 3.21 3.45 Median 18 213 59.6 3.205 3.47 Mode 18 238 57.6 3.13 2.69 Standard Deviation 1.20 28.88 7.56 0.60 0.74 Variance 1.43 834.24 57.14 0.35 0.55 Kurtosis 5.05 2.41 3.21 2.31 2.04 Skewness 0.94 0.30 0.72 −0.09 0.01 Range 8 136 34.5 2.56 2.91 Minimum 16 162 46.8 1.88 1.97 Maximum 24 298 81.3 4.44 4.88 Total Samples 136 136 136 136 136 Table 3
Descriptive statistics of entry requirements in 2007 and the CGPA.
Entry Age UTME Score CUSAS Score SSCE Aggregate Cumulative GPA
Mean 17.91 220.05 70.71 3.29 3.54 Median 18 218 70 3.21 3.58 Mode 18 205 70 3.13 3.07 Standard Deviation 1.18 21.76 8.55 0.54 0.61 Variance 1.39 473.71 73.12 0.30 0.37 Kurtosis 4.32 2.59 3.85 2.47 2.44 Skewness 0.87 0.15 0.09 0.33 −0.18 Range 7 109 64.4 2.89 2.87 Minimum 15 163 45.6 1.88 1.92 Maximum 22 272 110 4.77 4.79 Total Samples 371 371 371 371 371 Table 4
Descriptive statistics of entry requirements in 2008 and the CGPA.
Entry Age UTME Score CUSAS Score SSCE Aggregate Cumulative GPA
Mean 17.85 230.68 69.65 3.29 3.56 Median 18 231 70 3.28 3.59 Mode 17 227 71 2.5 3.75 Standard Deviation 1.20 21.12 8.04 0.64 0.67 Variance 1.44 446.23 64.66 0.41 0.44 Kurtosis 4.33 2.66 3.06 2.21 2.26 Skewness 0.96 −0.17 0.13 −0.03 −0.08 Range 7 116 44 3.14 3.13 Minimum 15 169 49 1.74 1.8 Maximum 22 285 93 4.88 4.93 Total Samples 393 393 393 393 393 Table 5
Descriptive statistics of entry requirements in 2009 and the CGPA.
Entry Age UTME Score CUSAS Score SSCE Aggregate Cumulative GPA
Mean 17.57 222.61 72.42 3.16 3.69 Median 17 221 73 3.13 3.71 Mode 17 218 73 3.13 3.83 Standard Deviation 1.01 17.96 8.38 0.63 0.55 Variance 1.02 322.70 70.17 0.40 0.30 Kurtosis 5.43 2.55 3.60 2.42 3.09 Skewness 1.06 0.36 −0.31 0.12 −0.37 Range 7 88 54 3.1 2.86 Minimum 15 183 41 1.67 2 Maximum 22 271 95 4.77 4.86 Total Samples 361 361 361 361 361
2. Materials and methods
A total sample of 1445 undergraduates that were admitted between 2005 and 2009 to study Chemical Engineering (CHE), Civil Engineering (CVE), Computer Engineering (CEN), Electrical and Electronics Engineering (EEE), Information and Communication Engineering (ICE), Mechanical Engi-neering (MEE), and Petroleum EngiEngi-neering (PET) at Covenant University, Nigeria were randomly selected. Entry age, SSCE aggregate, UTME score, CUSAS score, and the CGPA of the undergraduates were obtained from the Student Records and Academic Affairs unit and Center for Systems and Information Services (CSIS). In order to facilitate evidence-based evaluation, the robust dataset is made publicly available in a Microsoft Excel spreadsheetfile. On yearly basis,first-order descriptive statistics of the dataset are presented in tables. Box plot representations, frequency distribution plots, and scatter plots of the dataset are provided to enrich its value. Furthermore, correlation and linear regression analyses are performed to understand the relationship between the entry requirements and the corresponding academic performance in engineering programs.
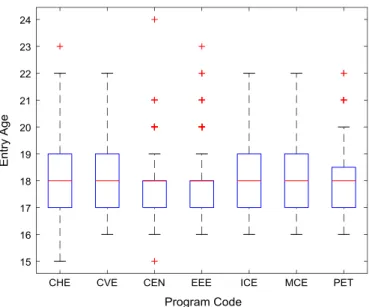
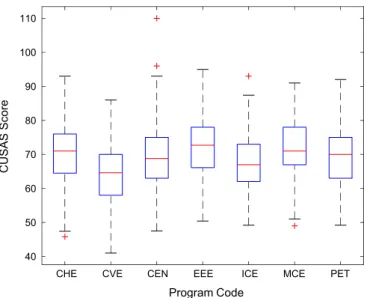
Figs. 6–10show the boxplots of the entry qualifications and the CGPA to represents the dataset
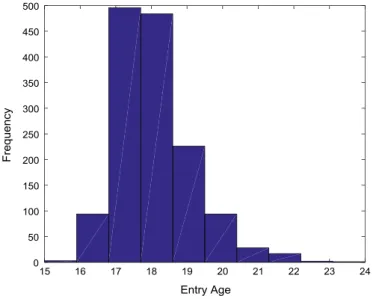
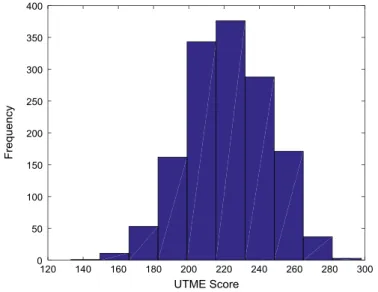
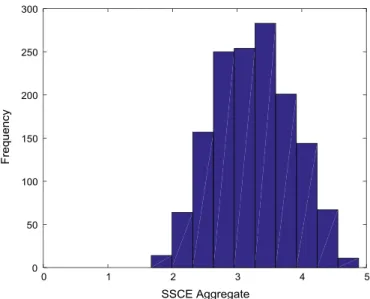
across the seven engineering programs. Frequency distributions of entry age, SSCE aggregate, UTME score, CUSAS score, and the CGPA of the engineering undergraduates are depicted inFigs. 11–15 respectively.
Linear regression and correlation analyses are performed to understand the relationship between the entry requirements and the corresponding academic performance in engineering programs.
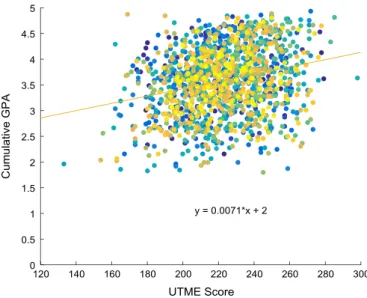
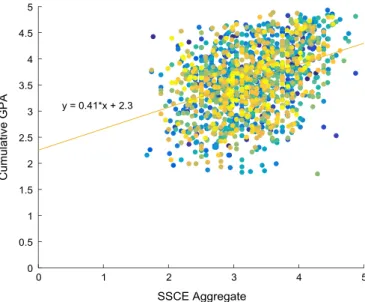
Figs. 16–19show the relationship between the entry requirements (entry ages, UTME scores, CUSAS
scores, SSCE aggregates) and the academic performance (CGPA) using scatter plots. Linear regression equations are also provided. Furthermore, correlation coefficients and their p-values of entry requirements and CGPA for year 2005–2009 are presented in matrix form inTables 6–15. The cor-relation coefficient is said to be significant when an off-diagonal element of the p-value matrix is smaller than the significance level of 0.05. The results of the correlation analyses show that the relationships between the entry qualification parameters and the corresponding academic perfor-mance are not really as‘strong’as expected. The SSCE aggregate is more highly correlated to the
2005 2006 2007 2008 2009 Year of Entry 15 16 17 18 19 20 21 22 23 24
Entry Age in Years
academic performance (CGPA) with minimum p-value, relative to other entry qualification para-meters. The entry age parameter seems to be least relevant to academic performance throughout the study period. In order to uphold quality of engineering education in Nigeria, there is an urgent need for relevant bodies to review the entry requirements into engineering undergraduate programs in Nigerian universities. 2005 2006 2007 2008 2009 Year of Entry 140 160 180 200 220 240 260 280 300 UTME Score
Fig. 2.Boxplot of UTME score of undergraduates enrolled in 2005–2009.
2005 2006 2007 2008 2009 Year of Entry 40 50 60 70 80 90 100 110 CUSAS Score
2005 2006 2007 2008 2009 Year of Entry 0 0.5 1 1.5 2 2.5 3 3.5 4 4.5 SSCE Aggregate
Fig. 4. Boxplot of SSCE aggregate of undergraduates enrolled in 2005–2009.
2005 2006 2007 2008 2009 Year of Entry 2 2.5 3 3.5 4 4.5 5 Cummulative GPA
Fig. 6.Boxplot of entry age of undergraduates across engineering programs.
CHE CVE CEN EEE ICE MCE PET
Program Code 140 160 180 200 220 240 260 280 300 UTME Score
CHE CVE CEN EEE ICE MCE PET Program Code 40 50 60 70 80 90 100 110 CUSAS Score
Fig. 8.Boxplot of CUSAS score of undergraduates across engineering programs.
Fig. 10.Boxplot of CGPA of undergraduates across engineering programs.
Fig. 12.Frequency distribution of UTME score of undergraduates in engineering programs (2005–2009).
Fig. 14. Frequency distribution of SSCE aggregate of undergraduates in engineering programs (2005–2009).
Fig. 16.Scatter plot showing the relationship between entry age and CGPA.
Fig. 18. Scatter plot showing the relationship between CUSAS score and CGPA.
Fig. 19.Scatter plot showing the relationship between SSCE score and CGPA.
Table 6
Correlation coefficient matrix of entry requirement data and CGPA for 2005.
Entry Age UTME
Score CUSAS Score SSCE Aggregate Cumulative GPA Entry Age 1 UTME Score 0.0821 1 CUSAS Score 0.0240 0.3705 1 SSCE Aggregate −0.2327 0.2873 0.3937 1 Cumulative GPA −0.1653 0.2954 0.3724 0.4076 1
P-value matrix of entry requirement data and CGPA for 2005.
Entry Age UTME
Score CUSAS Score SSCE Aggregate Cumulative GPA Entry Age 1 0.2677 0.7468 0.0015 0.0249 UTME Score 0.2677 1 0.0000 0.0001 0.0000 CUSAS Score 0.7468 0.0000 1 0.0000 0.0000 SSCE Aggregate 0.0015 0.0001 0.0000 1 0.0000 Cumulative GPA 0.0249 0.0000 0.0000 0.0000 1 Table 8
Correlation coefficient matrix of entry requirement data and CGPA for 2006.
Entry Age UTME Score CUSAS Score SSCE Aggregate Cumulative GPA
Entry Age 1 −0.0265 −0.2203 −0.1232 −0.0040 UTME Score −0.0265 1 0.2116 0.2406 0.2337 CUSAS Score −0.2203 0.2116 1 0.3228 0.1595 SSCE Aggregate −0.1232 0.2406 0.3228 1 0.3805 Cumulative GPA −0.0040 0.2337 0.1595 0.3805 1 Table 9
P-value matrix of entry requirement data and CGPA for 2006.
Entry Age UTME
Score CUSAS Score SSCE Aggregate Cumulative GPA Entry Age 1 0.7592 0.0100 0.1529 0.9633 UTME Score 0.7592 1 0.0134 0.0048 0.0062 CUSAS Score 0.0100 0.0134 1 0.0001 0.0636 SSCE Aggregate 0.1529 0.0048 0.0001 1 0.0000 Cumulative GPA 0.9633 0.0062 0.0636 0.0000 1 Table 10
Correlation coefficient matrix of entry requirement data and CGPA for 2007.
Entry Age UTME Score CUSAS Score SSCE Aggregate Cumulative GPA
Entry Age 1 0.0568 −0.1087 −0.1280 −0.1319 UTME Score 0.0568 1 0.2911 0.2927 0.3344 CUSAS Score −0.1087 0.2911 1 0.3194 0.3741 SSCE Aggregate −0.1280 0.2927 0.3194 1 0.4487 Cumulative GPA −0.1319 0.3344 0.3741 0.4487 1 Table 11
P-value matrix of entry requirement data and CGPA for 2007.
Entry Age UTME
Score CUSAS Score SSCE Aggregate Cumulative GPA Entry Age 1 0.2752 0.0364 0.0136 0.0110 UTME Score 0.2752 1 0.0000 0.0000 0.0000 CUSAS Score 0.0364 0.0000 1 0.0000 0.0000 SSCE Aggregate 0.0136 0.0000 0.0000 1 0.0000 Cumulative GPA 0.0110 0.0000 0.0000 0.0000 1
Acknowledgement
This work is carried out under the SmartCU and Covenant University Data Analytics Center (CUDAC) Research Clusters. This research is fully sponsored by Covenant University Centre for Research, Innovation and Development (CUCRID), Covenant University, Ota, Nigeria.
Transparency document. Supporting information
Supplementary data associated with this article can be found in the online version athttp://dx.doi.
org/10.1016/j.dib.2018.02.025.
Table 12
Correlation coefficient matrix of entry requirement data and CGPA for 2005.
Entry Age UTME Score CUSAS Score SSCE Aggregate Cumulative GPA
Entry Age 1 −0.0688 −0.1734 −0.1884 −0.1426 UTME Score −0.0688 1 0.1675 0.3125 0.3036 CUSAS Score −0.1734 0.1675 1 0.2978 0.2215 SSCE Aggregate −0.1884 0.3125 0.2978 1 0.4184 Cumulative GPA −0.1426 0.3036 0.2215 0.4184 1 Table 13
P-value matrix of entry requirement data and CGPA for 2005.
Entry Age UTME
Score CUSAS Score SSCE Aggregate Cumulative GPA Entry Age 1 0.1737 0.0006 0.0002 0.0046 UTME Score 0.1737 1 0.0009 0.0000 0.0000 CUSAS Score 0.0006 0.0009 1 0.0000 0.0000 SSCE Aggregate 0.0002 0.0000 0.0000 1 0.0000 Cumulative GPA 0.0046 0.0000 0.0000 0.0000 1 Table 14
Correlation coefficient matrix of entry requirement data and CGPA for 2005.
Entry Age UTME Score CUSAS Score SSCE Aggregate Cumulative GPA
Entry Age 1 0.0154 −0.1309 −0.0816 −0.1510 UTME Score 0.0154 1 0.0829 0.1489 0.0884 CUSAS Score −0.1309 0.0829 1 0.3679 0.2511 SSCE Aggregate −0.0816 0.1489 0.3679 1 0.3395 Cumulative GPA −0.1510 0.0884 0.2511 0.3395 1 Table 15
P-value matrix of entry requirement data and CGPA for 2005.
Entry Age UTME
Score CUSAS Score SSCE Aggregate Cumulative GPA Entry Age 1 0.7705 0.0128 0.1215 0.0040 UTME Score 0.7705 1 0.1159 0.0046 0.0934 CUSAS Score 0.0128 0.1159 1 0.0000 0.0000 SSCE Aggregate 0.1215 0.0046 0.0000 1 0.0000 Cumulative GPA 0.0040 0.0934 0.0000 0.0000 1
Supplementary data associated with this article can be found in the online version athttp://dx.doi.
org/10.1016/j.dib.2018.02.025.
References
[1]J.A. Odukoya, D.O. Omole, A.A. Atayero, J. Badejo, S. Popoola, M. John, et al., Learning attributes of summa cum laude
students: experience of a Nigerian University, Cogent Educ. (2018) 1426675.
[2]J. Odukoya, A. Osore, F. Osore, O. Okunlola, The content and predictive validity of Pneuma Engineering Aptitude Test, Int. J.
Social. Sci. Humanit. Rev. 7 (2017).
[3]P.O. Adewale, O.B. Adhuze, Entry qualifications and academic performance of architecture students in Nigerian
Poly-technics: are the admission requirements still relevant? Front. Arch. Res. 3 (2014) 69–75.
[4]C.K. Ayo, J.A. Odukoya, A. Azeta, A review of open & distance education and human development in Nigeria, Int. J. Emerg.
Technol. Learn. 9 (2014) 63–67.
[5]J.A. Odukoya, O. Adekeye, A.O. Igbinoba, A. Afolabi, Item analysis of university-wide multiple choice objective
examina-tions: the experience of a Nigerian Private University, Qual. Quant. (2017) 1–15.
[6]J.A. Odukoya, O. Adekeye, O. Okunlola, Assessing the effectiveness of mobile learning devices in tertiary institutions: the
experience of undergraduates in a Nigerian Private University,, Int. J. Interact. Mob. Technol. 11 (2017) 160–169.
[7]S. Oluigbo, Improving the quality of architecture graduates from Nigerian Universities,, AARCHES J. 4 (2005) 72–76.
[8]S.I. Popoola, A.A. Atayero, T.T. Okanlawon, B.I. Omopariola, O.A. Takpor, Smart campus: data on energy consumption in an
ICT-driven university, Data Brief 16 (2018) 780–793.
[9]S.I. Popoola, A.A. Atayero, N. Faruk, J.A. Badejo, Data on the key performance indicators for quality of service of GSM
networks in Nigeria, Data Brief 16 (2018) 914–928.
[10]S.I. Popoola, A.A. Atayero, N. Faruk, Received signal strength and local terrain profile data for radio network planning and
optimization at GSM frequency bands, Data Brief 16 (2018) 972–981.
[11]S.I. Popoola, A.A. Atayero, J.A. Badejo, T.M. John, J.A. Odukoya, D.O. Omole, Learning analytics for smart campus: data on