Do More Effective Teachers Earn More
Outside of the Classroom?
Matthew M. Chingos
Martin R. West
CES
IFO
W
ORKING
P
APER
N
O
.
2996
C
ATEGORY5:
E
CONOMICS OFE
DUCATIONM
ARCH2010
An electronic version of the paper may be downloaded • from the SSRN website: www.SSRN.com • from the RePEc website: www.RePEc.org • from the CESifo website: Twww.CESifo-group.org/wpT
CESifo Working Paper No. 2996
Do More Effective Teachers Earn More
Outside of the Classroom?
Abstract
We examine earnings records for 90,000 classroom teachers employed by Florida public schools between the 2001–02 and 2006–07 school years, roughly 20,000 of whom left teaching during that time. Among grade 4–8 teachers leaving for other industries, a 1 standard deviation increase in estimated value-added to student achievement is associated with 6–9 percent higher earnings outside of teaching. The relationship between effectiveness and earnings is stronger in other industries than it is for the same teachers while in the classroom, suggesting that existing compensation systems do not account for the higher opportunity wages of effective teachers.
JEL-Code: I20, J45, J31. Matthew M. Chingos Department of Government Harvard University [email protected] Martin R. West
Harvard Graduate School of Education Harvard University
We are grateful to Tammy Duncan, Teresa Miller, and Jeff Sellers at the Florida Department of Education for supplying the data for this analysis. Helpful comments were provided by Steve Ansolabehere, Edward Glaeser, Dan Goldhaber, Josh Goodman, Eric Hanushek, Caroline Hoxby, Larry Katz, Richard Murnane, Paul Peterson, Lant Pritchett, Jonah Rockoff and participants in Harvard University’s Labor Lunch series, the Harvard Kennedy School’s faculty seminar series, and the NBER Economics of Education Program Meeting. Administrative support was provided by the Program on Education Policy and Governance at Harvard University.
1. Introduction
Every debate about teacher compensation policy—be it overall salary levels, merit pay, or bonuses for working in high-needs schools—draws heavily on arguments about what current teachers could be making in other sectors of the economy (their opportunity wages).1
Discussions about how to recruit and retain the best teachers similarly emphasize the need to ensure that teaching positions are attractive to the most effective current and potential members of the profession. Unfortunately, very little evidence is available regarding the non-teaching job opportunities available to teachers in general, and to specific groups of teachers defined in terms of their effectiveness in promoting student achievement. This paper seeks to fill that gap using a unique administrative dataset that links the experiences of current and former teachers, including the academic performance of their students, to the earnings records of those same teachers.
Theory is ambiguous as to the expected relationship between value-added measures of teacher effectiveness and earnings outside of education. On one hand, to the extent that such measures accurately capture teacher effectiveness and teacher effectiveness reflects general skills that enhance productivity in other occupations, high value-added teachers who leave for other jobs should earn more than their low value-added counterparts. On the other hand, value-added measures are at best noisy indicators of teacher quality and may be biased by non-random sorting of students and teachers (Rothstein, forthcoming). Additionally, it is commonly argued that good teaching requires a highly idiosyncratic skill set that may not translate into success in other fields, a contention which is supported by the difficulty of predicting teacher effectiveness with such measures of general skills as SAT scores, college selectivity, and tests of cognitive ability
1
See, for example, Ballou and Podgursky (1997), Boardman et al. (1982), Murnane et al. (1991), and Podgursky and Tongrut (2006).
(Kane et al. 2007, Harris and Sass 2007, and Rockoff et al. 2008).2 By examining the
relationship between value-added while teaching and subsequent earnings in other industries, we therefore provide an external (to public education) validation of value-added measures and shed light on the competitive pressures facing school districts due to realities of the outside labor market.
Existing research supports the notion that alternative labor market opportunities affect the decisions of teachers to enter and remain in the classroom. Dolton and van der Klaauw (1995, 1999) show that teacher salaries and opportunity wages strongly influence the decisions of a national sample of early-career teachers in the United Kingdom to remain in the profession. Earlier research by Murnane and Olsen (1989, 1990) also found that opportunity wages affected teachers’ career lengths in Michigan and North Carolina. More recently, Hoxby and Leigh (2004) provide evidence that the post-1960 decline in the aptitude of female teachers in the United States reflected union-induced compression of wages with respect to aptitude within teaching. However, each of these papers derives estimates of opportunity wages for individual teachers or groups of teachers based on their observed characteristics and geographic location. None of them has direct information on the earnings of leaving teachers or on those teachers’ classroom effectiveness.
Two recent papers use state administrative datasets to examine the earnings of teachers leaving the classroom for other occupations. Podgursky et al. (2004) merge employment data on Missouri teachers with earnings information from the state’s unemployment insurance system, while Scafidi et al. (2006) do the same for Georgia. Both sets of authors conclude that, contrary to common perceptions, very few exiting teachers take jobs that pay more than their prior
2
salaries as teachers.3 Neither analysis, however, contains information on the classroom effectiveness of leaving teachers.
We contribute to this literature by providing what is, to our knowledge, the first evidence on the relationship between the earnings of a large sample of exiting teachers and their estimated effectiveness while teaching. More specifically, we follow the careers of more than 90,000 classroom teachers employed by Florida public schools between the 2001–02 and 2006–07 school years, roughly 20,000 of whom left the classroom during that time. Uniform quarterly earnings data are available from the state’s unemployment insurance system for all current teachers and for those former teachers who worked elsewhere in the state. We are therefore able to observe the industries in which departing teachers worked and their average annual earnings in their new careers.
For math and reading teachers in grades 4–8, we use information on their students’ performance on state tests to estimate value-added measures of classroom effectiveness. This information makes it possible to compare the relationships between classroom effectiveness and earnings inside and outside of teaching for the common samples of teachers who left the
classroom for other positions in public school districts or for another industry altogether. Our analysis yields several noteworthy results. First, a majority of those leaving the classroom remained employed by public school districts, suggesting that a substantial amount of attrition from classroom teaching reflects movement into administrative or other non-teaching positions within the public school system. The growth in the number of administrative and support positions in American school systems in recent decades is well documented in the
3
Stinebrickner (2002) performs a similar exercise for an over-sample of teachers included in the National Longitudinal Study of the High School Class of 1972, but his ability to draw inferences about the current labor market for teachers is limited by the relatively small numbers of teachers in the dataset and by the fact that most of the teachers in his data graduated from college in 1976.
academic literature (Hanushek and Rivkin 1997). The latest data from the U.S Department of Education (2008, table 80) indicate that the ratio of students to total full-time equivalent staff employed by public school systems fell by more than 41 percent (from 13.6 to 8.0) between 1970 and 2006, including a 13 percent reduction after 1990.4 Our finding that many former teachers continue working in the public schools suggests that this pattern may well have led to higher rates of attrition from classroom teaching.
The median annual earnings of teachers moving into other sectors of the Florida economy fell by more than 20 percent upon leaving teaching, with the largest drops observed for females and teachers in grades K–8. These large overall declines, however, include a substantial share of former teachers who appear to have moved into part-time work. Among former teachers who were likely working full time, male teachers saw a slight increase in median earnings upon leaving for another industry while female teachers experienced only a modest decline. However, the earnings distribution for former teachers is more dispersed than their earnings while teaching, suggesting substantial wage compression within the teaching profession.
Most important, we show that teachers who were more effective in the classroom (as measured by their students’ test score gains) earn more in other industries than other teachers who left the profession. Among full-time workers, a one standard deviation increase in
estimated value added is associated with 6–9 percent greater earnings outside of teaching. The relationship between classroom effectiveness and earnings is consistently stronger outside of teaching than for the same groups of teachers while in the classroom. The patterns strongly suggest that existing teacher compensation systems do not fully account for differences in opportunity wages among current teachers.
4
The number of teachers hired for each student also fell during this period, but at a slower rate than the number of total staff: The number of students per full-time equivalent teacher decreased by 23 percent between 1970 and 2006 and by 10 percent after 1990.
The remainder of the paper is organized as follows. The next two sections introduce our data and methods. Section 4 compares the earnings distribution of teachers who left the
classroom for other jobs in public school districts and for jobs outside of the public education system to their earnings while teaching. Section 5 compares the relationship between teacher value-added and earnings inside and outside of teaching for 4th- through 8th-grade teachers. Section 6 discusses the implications of our results for teacher compensation policy.
2. Data
The central innovation in our study is the linking of information from the Florida
Department of Education’s K–20 Education Data Warehouse (EDW) with earnings records from the Florida Education and Training Placement Information Program (FETPIP). Our EDW data extract contains observations of every student in Florida who took the state assessment tests from 1998–99 to 2006–07, with each student linked to his or her courses (and corresponding teachers) for 2001–02 through 2006–07. The FETPIP data consist of state Unemployment Compensation records that include the earnings of current public school teachers and former teachers working in Florida from the first quarter of 2001 through the third quarter of 2008.
The EDW data include test score results from the Florida Comprehensive Assessment Test (FCAT), the state accountability system’s “high-stakes” test, and the Stanford Achievement Test (SAT), a nationally norm-referenced test that is administered to students alongside the FCAT but is not used for accountability purposes. Beginning in 2000–01, students in grades 3 through 10 took both tests each year in math and reading. Thus annual gain scores can be calculated for virtually all students in grades 4 through 10 beginning in 2001–02. The data also contain information on the demographic and educational characteristics of each student,
including gender, race, free or reduced-price lunch eligibility, limited English proficiency status, special education status, days in attendance, and age.
The EDW data also contain detailed information on individual teachers, including their demographic characteristics and experience. We construct an employment file based on course enrollment data (that matches students and teachers) in order to track whether and where teachers were employed in classroom teaching positions in a given year. A separate file from the EDW enables us to identify the specific jobs of former classroom teachers that remained employed in the public schools. The teacher experience variable we construct reflects all years the teacher has spent in the profession, including both public and private schools in both Florida and other states. Given our interest in the subsequent earnings of exiting teachers, we restrict our analysis to observations of teachers that were 54 years of age or younger in order to exclude likely retirees.5
The FETPIP data indicate, for each teacher, quarter, and employer, the amount earned, the randomly generated employer ID number, the number of workers at the firm, and the employer’s North American Industry Classification System (NAICS) code. Only earnings received in Florida and reported to the state Unemployment Compensation system are included in these records.
We inflate all quarterly earnings to 2008 dollars using the average of the monthly Consumer Price Indexes (CPI) for each quarter. We then calculate each current and former teacher’s earnings in each school year from 2001–02 through 2006–07 by combining the earnings from the last quarter of the calendar year in which the school year began with the earnings from the first three quarters of the calendar year in which the school year ended. For
5
Most Florida teachers become eligible for retirement with full pension benefits at age 62 or after 30 years of service. Assuming an entry age of 25, the earliest possible retirement age with full benefits is therefore 55.
example, earnings for 2001–02 are calculated as earnings from October 2001 through September 2002.6 In order to exclude likely part-time teachers, we only include teachers that earned at least $20,000 from the public schools in every year that they were a classroom teacher.7
We divide this sample of classroom teachers into three groups: those who remained as teachers during the period that we observe them, those who left teaching for other jobs within Florida public school districts, and those who left teaching for other non-teaching jobs in the state.8 There are also a substantial number of teachers who left teaching but do not appear in the FETPIP wage data (because they withdrew from the labor force or left Florida); these teachers are included in the descriptive statistics presented in Appendix Table 1 but are excluded from our main analyses. In order to allow for leaves of absence as well as transitions between teaching and non-teaching jobs (in both the public schools and elsewhere), we do not count as either in-teaching or non-in-teaching earnings experienced during an individual’s first year outside of the classroom.9 Teachers who are observed for only one year after leaving the classroom are
6
The timing of the collection of the quarterly earnings data requires that we include September in the wrong school year, introducing a modest amount of measurement error.
7
Our measure of annual earnings combines income reported from all sources, including side jobs of teachers taking on additional employment. Fortunately, such “moonlighting” activity appears to be relatively rare: Among teachers remaining in the classroom throughout our sample period, mean annual earnings from sources other than public school districts was $669, or 1.4 percent of their mean total earnings of $47,516. Teachers leaving the classroom for other positions in public school districts had mean earnings from outside sources of $707, or 1.8 percent of their mean total earnings of $44,870. Teachers leaving the classroom for employment elsewhere earned somewhat more from outside sources while teaching, but the $2,658 in mean earnings they received from outside sources still only amounted to 6.8 percent of their mean total earnings of $39,278. Excluding earnings received from sources other than public school districts does not change the earnings-effectiveness patterns for teachers.
8
We identify whether a teacher was employed as a teacher in a given year using the student course enrollment files. We then use the FETPIP employer codes to identify teachers that left teaching but remained employed by a public school district. A former teacher is defined as working in public schools in a given academic year if they received the majority of their earnings from a public school district. Teachers who, during their non-teaching years, earned the majority of their earnings in public schools in some years and elsewhere in others are included in both groups of leavers (with only the relevant years of earnings considered for each group).
9
Among teachers that were in the classroom in 2001-02 but not in 2002-03, we find that 20 percent had returned to the classroom in 2003-04, suggesting that a sizable number of apparent “leavers” return after just one year of absence.
therefore excluded from the analysis. We also exclude all teachers who first appear in the last two years of our data (2005–06 or 2006–07), as such teachers could never be observed beyond their first year of non-teaching earnings.
Finally, in much of our analysis we weight former teachers by their estimated probability of working full-time. These predicted probabilities were calculated by conducting a probit analysis of whether former teachers in the nationally representative 2004–05 Teacher Follow-up Survey (TFS) reported that they were working full-time.10 Predictor variables included in the regression were total annual earnings (inflated to 2008 dollars), gender, and whether they were working in the education sector or elsewhere. Figure 1 plots the predicted probabilities as a function of annual earnings, gender, and whether the teacher remained in the field of education.
10
We excluded as potential retirees former teachers 55 years and older (as we do in our analysis of the Florida data), leaving us with a sample of 615 former teachers, 383 in education and 232 in other industries.
3. Analytic Strategy
Our primary aim is to examine how teachers’ opportunity wages vary with their effectiveness. We first explain our approach to measuring effectiveness and then describe the models used to relate these measures to current and subsequent earnings.
Measuring Teacher Effectiveness
To measure teacher effectiveness we use student test score data to construct value-added measures for teachers of math and reading courses in grades 4–8.11 Value-added measures attempt to isolate the causal effect that teachers have on their students’ test scores.12 Because the limited time period over which we observe teachers leads to considerable error in measuring their effectiveness, we focus our analysis on value-added measures that average estimates based on the high-stakes FCAT and low-stakes SAT.13 However, all findings reported below
concerning the relationship between this summary effectiveness measure and earnings are qualitatively similar to those obtained using measures based only on the FCAT or only on the SAT.14
11
Although Florida also tests students annually in grades 9 and 10, the wide variety of math and reading course offerings in these grades makes it difficult to construct reliable value-added measures.
12
Of course, teacher quality has other dimensions, most of which are difficult to measure and all of which are outside the scope of our analysis. The interpretation of our main findings hinges on the assumption that the test instruments used are, on average, a reasonable proxy for students’ overall academic development.
13
We find that SAT value-added in the current year is a significant predictor of FCAT value-added in the following year conditional on FCAT value-added in the current year, suggesting that averaging the two measures reduces measurement error.
14
The correlation coefficient between effectiveness of teachers as measured by their students’ FCAT performance and effectiveness as measured by the SAT is 0.70 and 0.60 for 4th- and 5th-grade math and reading, respectively, and 0.66 and 0.55 for 6th- through 8th-grade reading and math. Separate estimates of the relationship between the SAT-based and FCAT-SAT-based teacher effectiveness measures and earnings are available from the authors upon request.
We use the course files to match 4th- and 5th-grade students (most of whom are enrolled in self-contained classrooms) to their primary teacher and 6th- through 8th- grade students to their math and reading/English Language Arts teachers.15 A very small number of 4th- and 5th-grade students who were in classrooms of fewer than five or more than forty students are dropped from the analysis.
To generate value-added estimates for each teacher, we regress students’ math and reading test scores separately on their prior-year test scores (including squared and cubed terms); vectors of student, classroom, and school characteristics; dummy variables for teacher
experience; and grade-by-year fixed effects.16 Additional student-level control variables include the number of days absent the previous year and dummy variables for race, gender, limited English proficiency status, special education status, migrant status, free or reduced-price lunch eligibility, whether the student was repeating the grade, and whether the student made a structural or non-structural move to a new school that year.17 Classroom- and school-level control variables include all of the student-level characteristics (except prior-year test scores) aggregated to the appropriate level and class size.
15
For 4th- and 5th-grade students, the course files do not always clearly identify the student’s regular classroom teacher. In order to match the maximum number of students to their teachers, we examined students’ general (e.g., self-contained classroom), math, and reading teachers and matched them to the one or two teachers with whom they spent at least 40 percent of their academic (general, math, and reading) time. We then dropped students who were matched to two teachers and students who were not matched to any teachers. A large and increasing number of 4th- and 5th-grade students in Florida appear to have more than one regular classroom teacher, perhaps reflecting an increase in team teaching. We match 6th- through 8th-grade students to their primary reading and math teachers in a similar fashion. For each subject, we linked each student to the teacher(s) with whom they spent at least 40 percent of their time in that subject and dropped students who were matched to two teachers in a given subject.
16
We control for teacher experience using a dummy variable for each of the first twenty years of experience, so the omitted category includes all teachers with more than twenty years of experience.
17
Students are identified as having made a non-structural move from the previous year if they are in a different school than in the previous year and are in the lowest grade offered in their new school, and as having made a structural move if they are in a grade higher than the minimum grade of the new school.
The model, then, is it it it it it it t i it A X C S W A =ω ,−1+β +γ +φ +δ +π +ε (1) ,
where Ait is the test score of student i in year t (standardized by grade and year to have a mean of zero and standard deviation of one); Ai,t–1 includes the student’s prior-year test scores in both subjects (and their squared and cubed terms); X, C, and S are student-, classroom-, and school-level characteristics; W is a vector of teacher experience dummy variables; π is a vector of grade-by-year fixed effects, and ε is a standard zero-mean error term. We estimate this equation
separately by test (FCAT and SAT), subject (reading and math), and grade-level (4th and 5th and 6th through 8th), and average the residuals by teacher and year to construct a value-added measure for each teacher in each year.18 Finally, we use the Bayesian (shrinkage) estimator described by Kane et al. (2007) to isolate the persistent component of each teacher’s value added.19 This persistent component forms the effectiveness measure used throughout our analysis. Consistent with previous research, we find that teacher effectiveness varies more for math than for reading and for elementary than for middle school teachers.20
Although widely used by researchers, the reliability of this kind of value-added model of teacher effectiveness using non-experimental data continues to be debated (see, e.g. Rothstein, forthcoming, Kane and Staiger 2008). The key potential confounding factor is the nonrandom
18
This added estimation approach is similar to the one used in Kane et al. (2007). 19
One key difference is that for each year and teacher Kane et al. (2007) compute average residuals by class, whereas we compute average residuals by teacher (which is identical to class for 4th- and 5th-grade teachers because each teacher only has one class, but 6th- through 8th-grade teachers often teach multiple classes). We do this because the nature of the EDW course records makes it difficult to definitively assign middle school students to a specific math classroom even though we can confidently match them to a specific math teacher.
20
For all teachers for whom we are able to estimate effectiveness measures using FCAT scores, the standard deviations of these measures are (in standard deviations of student test scores): 0.11 and 0.05 for 4th- and 5th-grade math and reading, respectively, and 0.08 and 0.03 for 6th- through 8th-grade math and reading, respectively. The standard deviations of measures calculated using SAT scores are 0.08 and 0.04 for 4th- and 5th-grade math and reading, and 0.06 and 0.02 for 6th- through 8th- grade math and reading.
matching of students and teachers both across and within schools, which would bias estimated teacher effects if there are unobserved differences across students that are not accounted for by the variables described above.21
It is unclear, however, whether or in what direction the nonrandom matching of students and teachers would bias our estimates of the relationship between effectiveness and earnings. Classical measurement error will of course attenuate that relationship—and should do so by similar amounts when comparing the wage structure inside and outside of teaching for a common sample of teachers. It is not obvious a priori whether any additional error due to nonrandom matching would be systematically related to opportunity wages. As a robustness check, we therefore examine whether non-teaching earnings are systematically related to the average prior achievement of students assigned to each teacher and whether our estimates of the effectiveness-earnings relationship are sensitive to controlling for this measure of student-teacher sorting.
Relating Effectiveness and Earnings
We use data at the teacher*year level to estimate the relationship between classroom effectiveness and earnings both in and out of teaching. Our value-added measures of teacher effectiveness are standardized separately by grade level (grades 4-5 and grades 6-8), test (FCAT and SAT), and subject area (math and reading) to have a mean of zero and a standard deviation of 1. Because most teachers in grades 4 and 5 teach both math and reading in self-contained classrooms, we average their value-added measure in both subjects. We also average the
21
One strategy to reduce bias from nonrandom matching is to use school fixed effects to restrict the analysis to differences in teacher effectiveness within schools. Although we can compute value added estimates that control for school fixed effects in place of school characteristics, we would be forced to limit our analysis of the relationship between effectiveness and wages to comparisons of teachers that left the same school for non-teaching jobs.
standardized value-added measures from both the FCAT and SAT tests to reduce measurement error.
Combining elementary and middle school teachers, we estimate the following equation: (2) log(earnit)=α+λ*VAi +φi +εit,
where log(earnit) is the natural logarithm of annual earnings for teacher i in academic year t, α is a constant, VA is the teacher’s standardized value-added measure (which does not vary over time because it is calculated using all available data), φ is set of dummy variables corresponding to the teacher’s grade level and subject (middle school math or middle school English/reading, with elementary school teachers making up the omitted category), and ε is a zero-mean error term. Standard errors are adjusted for clustering at the teacher level to account for the fact that teachers appear multiple times in the dataset for two reasons: (1) most teachers are observed in more than one year and (2) some teachers are assigned to classrooms in more than one grade level and subject area.
We also estimate specifications of equation (2) that successively include district fixed effects and controls for teacher demographics. Because Florida’s countywide school districts approximate local labor markets, district fixed effects should help eliminate any lingering bias in our measures of teacher effectiveness associated with geographic differences in job
opportunities. The results of models including district fixed effects represent our preferred estimates, as they should provide policymakers with the best information on how opportunity wages vary with teacher effectiveness. Results including teacher demographic characteristics, in contrast, allow us to see whether any observed relationships between effectiveness and earnings reflect differences in job opportunities associated with those characteristics.
4. Industry choice and median earnings among leaving teachers
We begin by examining the overall rate of attrition among Florida classroom teachers, the new industries chosen by those leaving the classroom, and their median earnings. After the exclusion restrictions discussed in section 2, our analytic sample includes roughly 92,000
teachers who taught core academic subjects (defined as general, math, and reading in grades K–5 and general, math, reading, social studies, science, and foreign language in grades 6–12) in grades K–12.
The overall attrition rate among Florida teachers in these subjects who are not yet at retirement age is relatively modest. Among teachers who were in the classroom in the 2001–02 school year, for example, 90 percent were teaching in 2003, 84 percent in 2004, 78 percent in 2005, 74 percent in 2006, and 72 percent in 2007 (hereafter we often refer to school years using the calendar year of the spring semester). The analogous numbers for those employed in 2002– 03 are similar: 90 percent in 2004, 83 percent in 2005, 78 percent in 2006, and 76 percent in 2007. The share of teachers remaining in the classroom in a given year includes both individuals who taught continuously and those returning from temporary leaves of absence. The steadily declining percentages for both cohorts therefore indicate that the number of leaving teachers each year exceeds the number returning from a leave.
Table 1 reports the destination industries of teachers leaving the classroom for more than one consecutive year between 2002 and 2007 using a set of categories based on the North American Industry Classification System (NAICS). Exiting teachers with multiple employers are assigned to the industry in which they received the majority of their earnings.22 The analysis is necessarily limited to former teachers who had reported earnings in Florida and therefore
22
The tiny fraction (0.25 percent) of teachers that did not earn the majority of earnings from a single industry are included in the “Other” category.
l Services and Leasing;
aste Management nt, and Recreation;
hing, and Hunting; sportation and
Table 1. Destination Industries of Former Florida Teachers, 2002-2007
Pu Elem Sc blic /Sec hls P El rivate em/Sec Schls Other Education Prof Services Heal Car th e Ot Ser her vices Public Admin Other or Multiple N Workers as % of Leavers All K-8 Teachers 66% 4% 5% 8% 5% 3% 2% 6% 11,063 74%
All Male K-8 Teachers 56% 3% 6% 12% 5% 4% 5% 9% 1,890 79% All Female K-8 Teachers 68% 5% 5% 8% 5% 3% 2% 5% 9,173 74%
All 9-12 Teachers 52% 4% 9% 12% 6% 3% 4% 8% 3,844 73%
All Male 9-12 Teachers 47% 4% 10% 15% 5% 3% 5% 11% 1,534 73% All Female 9-12 Teachers 55% 5% 9% 11% 7% 3% 4% 7% 2,310 73% Notes: Categories are based on North American Industry Classification System (NAICS) codes. "Other Education" includes all Educationa
other than Elementary and Secondary Schools. "Prof Servies" includes Information; Finance and Insurance; Real Estate and Rental Professional, Scientific, and Technical Services; Management of Companies and Enterprises; and Administrative and Support and W and Remediation Services. "Health Care" includes Health Care and Social Assistance. "Other Services" includes Arts, Entertainme Accommodation and Food Services; and Other Services (except Public Administration). "Other" includes Agirculture, Forestry, Fis mining, Quarrying, and Oil and Gas Extraction; Utilities; Construction; Manurfacturing; Wholesade Trade; Retail Trade; and Tran Warehousing.
excludes those withdrawing from the labor market and those moving to another state. The percentage of all exiting teachers for whom earnings data are available is 73-74 percent, as shown in the last column of Table 1. It is higher for males than females at the elementary school level. Appendix Table 1, which compares the observed characteristics of exiting teachers who did not have reported earnings in Florida to those who did, indicates that these teachers are less likely to be male, black, or Hispanic and are modestly younger on average.
Perhaps surprisingly, a majority of leavers across all grade levels for whom earnings data are available continue to draw most of their earnings from public school districts. The modal such teacher (43 percent) moved to a position as a teacher or aide assigned to specific student populations (e.g. in special education or Title I). Substantial proportions also became principals or assistant principals (16 percent) or entered positions supporting classroom teachers, such as curriculum or instruction specialists and subject coaches (16 percent). The share of former classroom teachers remaining employed by districts is highest for elementary and middle grade teachers (66 percent) and lowest among high school teachers (52 percent). Females are between 8 and 12 percentage points more likely to remain employed by districts than males, depending on the grade level. Given the large share of teachers who remained employed by public school districts, the remainder of our analysis looks separately at the experiences of those who did and did not stay in public schools.
Only 4 percent of exiting teachers moved into teaching positions in private elementary and secondary schools. A similarly small share left for other jobs in educational services outside of elementary and secondary schools. Among those leaving the public school system, most therefore left for jobs in non-education industries. The most common category for former teachers at all grade levels was Professional Services, which includes Information; Finance and
Insurance; Real Estate and Rental and Leasing; Professional, Scientific, and Technical Services; Management of Companies and Enterprises; and Administrative and Support and Waste
Management and Remediation Services.23
Table 2a reports median average annual earnings for all leaving teachers for the same sample of teachers for whom outside earnings data are available. Median earnings for former teachers remaining in public school districts were higher than for the same group while teaching, but the differences were modest. Former teachers working elsewhere, meanwhile, experienced a substantial decline in median earnings. The decline was largest for female teachers, who saw median earnings drop by one fifth to one third, but males also saw earnings declines of almost one tenth.
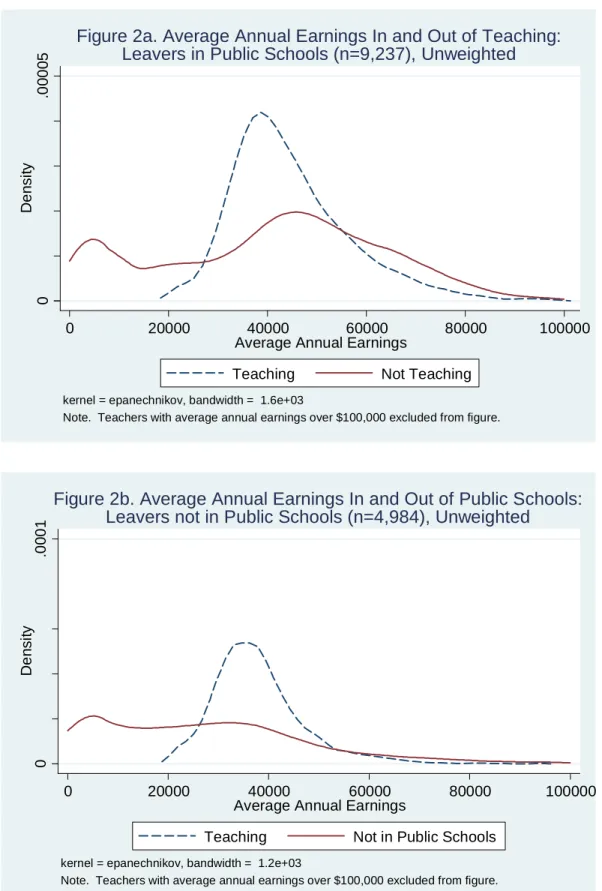
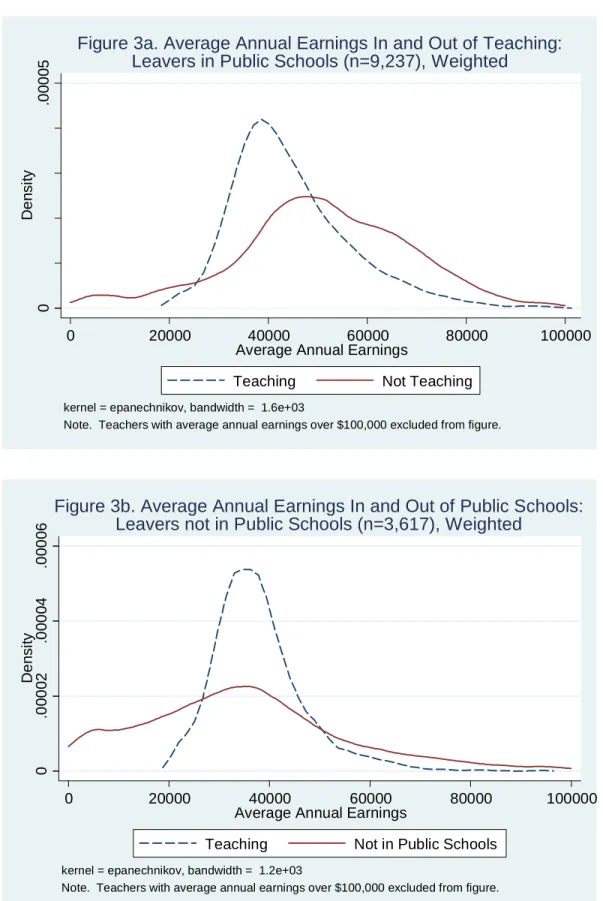
Figure 2a compares the distribution of average annual earnings for exiting teachers who remained employed by public school districts before and after leaving the classroom; Figure 2b does the same for leavers to other industries. The plots indicate that a substantial share of both groups of leavers had very low levels of earnings after leaving, suggesting that they moved into part-time employment. Among teachers not working in public school districts, the distribution peaks at a level below $10,000. Although movement into part-time employment is clearly an important phenomenon in teacher labor markets, our primary aim in this paper is to compare the structure of compensation for full-time employment inside and outside of teaching. We therefore also look at results that weight individuals based on the predicted probability that they were
23
Roughly similar shares of leavers entered jobs classified as Health Care, Other Services (including Arts,
Entertainment, and Recreation; Accommodation and Food Services; and Other Services), Public Administration, or Other (including Agriculture, Forestry, Fishing, and Hunting; mining, Quarrying, and Oil and Gas Extraction; Utilities; Construction; Manufacturing; Wholesale Trade; Retail Trade; and Transportation and Warehousing).
here in Florida Table 2a. Median Earnings of Florida Teachers, 2002-2007
Stayers Leavers Working in Public School Districts Leavers Working Elsew
Teaching Teaching Not Teaching Difference Teaching Not in Public
Schools Difference All K-8 Teachers $43,932 $42,643 $45,264 $2,621 $37,334 $28,685 -$8,649
56,208 7,838 7,838 6% 3,615 3,615 -23%
All Male K-8 Teachers $45,081 $44,386 $49,789 $5,403 $38,121 $35,253 -$2,868
7,640 1,145 1,145 12% 815 815 -8%
All Female K-8 Teachers $43,767 $42,408 $44,630 $2,223 $37,066 $26,870 -$10,196
48,568 6,693 6,693 5% 2,800 2,800 -28%
All 9-12 Teachers $46,598 $44,845 $48,982 $4,136 $39,057 $33,384 -$5,673
20,274 2,216 2,216 9% 1,762 1,762 -15%
All Male 9-12 Teachers $47,779 $45,874 $51,132 $5,258 $40,040 $36,476 -$3,564
7,597 799 799 11% 793 793 -9%
All Female 9-12 Teacher $45,847 $44,327 $47,679 $3,352 $38,170 $30,967 -$7,203 12,
s
677 1,417 1,417 8% 969 969 -19%
0 .0 00 05 De ns it y 0 20000 40000 60000 80000 100000
Average Annual Earnings
Teaching Not Teaching
kernel = epanechnikov, bandwidth = 1.6e+03
Note. Teachers with average annual earnings over $100,000 excluded from figure.
Figure 2a. Average Annual Earnings In and Out of Teaching: Leavers in Public Schools (n=9,237), Unweighted
0 .0 0 0 1 De ns it y 0 20000 40000 60000 80000 100000
Average Annual Earnings
Teaching Not in Public Schools
kernel = epanechnikov, bandwidth = 1.2e+03
Note. Teachers with average annual earnings over $100,000 excluded from figure.
Figure 2b. Average Annual Earnings In and Out of Public Schools: Leavers not in Public Schools (n=4,984), Unweighted
working time (we refer to the sample represented by these weighted results as “likely full-time workers”).24
Table 2b replicates the analysis of changes in median earnings among likely full-time workers. As expected, median earnings for former teachers increase by a greater amount among those remaining in public school districts when emphasizing full-time employment. Among teachers leaving for other industries, median earnings declined by just 5 percent for elementary and middle teachers and were essentially unchanged for high school teachers. Female teachers experienced somewhat larger declines, while male teachers leaving for other industries saw modest increases in median earnings of 2-4 percent.
These results indicate that Florida teachers leaving for full-time employment in other industries are not taking jobs that are, on average, better compensated than their positions as teachers. Taking into account fringe benefits, which are typically more generous for public school teachers than for workers in other sectors of the economy, would presumably strengthen this conclusion. Moreover, because most exits from public school teaching in Florida and elsewhere are voluntary, those who do leave are likely to have higher opportunity wages than those that remain.
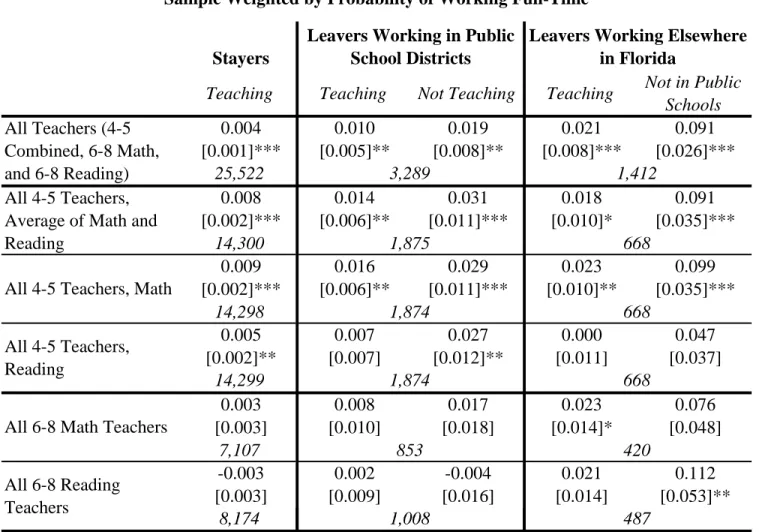
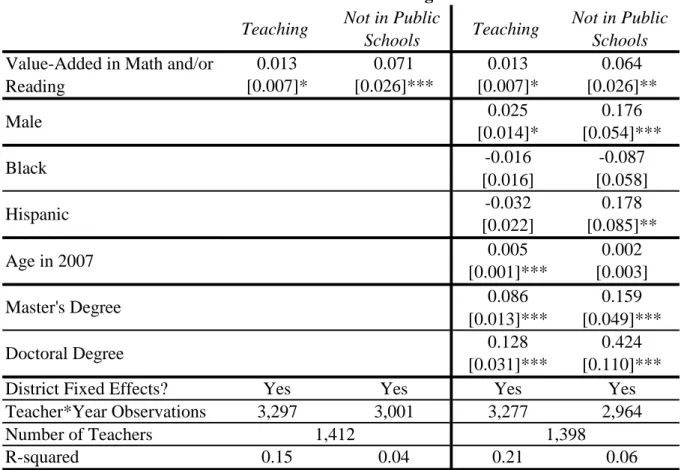
Figures 3a and 3b, which display the distribution of average annual earnings for the likely full-time workers, confirm that the distribution of earnings among former teachers is
considerably more dispersed than the earnings of the same groups while teaching. This is especially true of those leaving the classroom for other industries. Among leavers working within public school districts, the 90th/50th percentile earnings ratio among likely full-time
24
In the regression analysis, each teacher*year observation is weighted by the probability that the teacher was working full-time that year. Table 2b and Figures 3a and 3b weight each teacher by the average predicted probability over working full-time over all years that she worked after leaving the classroom. Appendix Table 1 shows that the weighted sample is disproportionately male relative to the unweighted samples of exiting teachers but is otherwise similar in terms of the demographic characteristics that we observe.
e
here in Florida Table 2b. Median Earnings of Florida Teachers, Weighted by Probability of Working Full-Tim
Stayers Leavers Working in Public School Districts Leavers Working Elsew
Teaching Teaching Not Teaching Difference Teaching Not in Public
Schools Difference All K-8 Teachers $43,932 $42,643 $52,082 $9,439 $37,334 $35,606 -$1,728
56,208 7,838 7,838 22% 3,615 3,615 -5%
All Male K-8 Teachers $45,081 $44,386 $55,162 $10,776 $38,121 $39,754 $1,633
7,640 1,145 1,145 24% 815 815 4%
All Female K-8 Teachers $43,767 $42,408 $51,495 $9,087 $37,066 $34,291 -$2,775
48,568 6,693 6,693 21% 2,800 2,800 -7%
All 9-12 Teachers $46,598 $44,845 $55,729 $10,883 $39,057 $39,303 $247
20,274 2,216 2,216 24% 1,762 1,762 1%
All Male 9-12 Teachers $47,779 $45,874 $57,340 $11,466 $40,040 $40,972 $931
7,597 799 799 25% 793 793 2%
All Female 9-12 Teacher $45,847 $44,327 $54,897 $10,570 $38,170 $37,816 -$353 12,
s
677 1,417 1,417 24% 969 969 -1%
0 .0 00 05 De ns it y 0 20000 40000 60000 80000 100000
Average Annual Earnings
Teaching Not Teaching
kernel = epanechnikov, bandwidth = 1.6e+03
Note. Teachers with average annual earnings over $100,000 excluded from figure.
Figure 3a. Average Annual Earnings In and Out of Teaching: Leavers in Public Schools (n=9,237), Weighted
0 .0 00 02 .0 00 04 .0 00 06 De ns it y 0 20000 40000 60000 80000 100000
Average Annual Earnings
Teaching Not in Public Schools
kernel = epanechnikov, bandwidth = 1.2e+03
Note. Teachers with average annual earnings over $100,000 excluded from figure.
Figure 3b. Average Annual Earnings In and Out of Public Schools: Leavers not in Public Schools (n=3,617), Weighted
workers remained at 1.4 as they left classroom teaching. Among leavers working elsewhere in Florida, the 90/50 earnings ratio increased more sharply: from 1.3 to 1.8. These patterns suggest substantial wage compression (relative to individual opportunity wages) among classroom teachers, but also likely reflect the greater heterogeneity in the working conditions of jobs taken by the former teachers (as compared to when they were all in the same profession). The next section considers whether this variation in the non-teaching earnings of former teachers is related to their relative effectiveness while teaching.
5. Classroom effectiveness and earnings
To examine the relationship between classroom effectiveness and earnings, we use the sample of teachers in grades 4–8 for whom we are able to calculate value-added measures of their contribution to student learning based on equation (1). We first examine the raw
(unadjusted) relationship between estimated value added and (log) earnings while teaching and while not teaching. Then we examine the robustness of these results to the inclusion of district fixed effects and standard demographic controls. We focus throughout on the sample of likely full-time workers (with each teacher*year observation after the teacher left the classroom
weighted by the probability that the worker was employed full-time). Parallel unweighted results are qualitatively similar.
Ideally, we would focus on a set of teachers who left teaching for reasons exogenous to their opportunity wages (e.g., seniority-based layoffs due to budget cuts). Unfortunately this is not possible for our analysis, as Florida was expanding its teaching labor force during the period covered by our data due to enrollment growth and the implementation of a statewide class-size reduction policy. However, we are able to confirm that the teachers we observe working in other
industries are quite similar to the population of potential leavers in terms of their observable characteristics, including their estimated value added.
Appendix Table 1 provides summary statistics for the three groups of teachers in our main analysis: teachers who remained in the classroom throughout the period covered by our data (stayers), teachers who left for non-teaching positions in public school districts (leavers working in public school districts), and teachers who left for positions with other employers (leavers working elsewhere in Florida).25 Among likely full-time workers, stayers and leavers working in public school districts had slightly higher average value added (0.02-0.03 standard deviations above the mean) than leavers elsewhere (-0.04). In addition to being a little less effective on average, those leaving for full-time employment outside of public school districts had modestly lower earnings while teaching and were more likely than stayers to be male, black, and Hispanic and less likely to have a master’s degree in any field. Teachers with master’s degrees were overrepresented among leavers for other positions in public school districts, suggesting that districts use this credential to screen internal candidates for non-teaching jobs.
Table 3 presents estimates of the raw relationship between individual teacher effectiveness and the log of annual earnings. For both groups of leavers, the correlation is presented separately using annual earnings while teaching and while in other positions. Comparing the results for either group while teaching and while not teaching indicates
differences in the structure of compensation inside and outside of teaching for a common sample of teachers. Comparing the results for stayers to those for both groups of leavers while teaching provides suggestive evidence on the extent to which findings concerning the structure of
25
Appendix Table 1 also provides information on leavers who do not appear in the Florida earnings data, who we only observe while teaching. Compared to the other leavers in the value added sample, these teachers are more likely to be white and female and are modestly younger on average.
8 1
Table 3. Relationship between Log(Earnings) and Effectiveness: Teachers in Value-Added Sample Weighted by Probability of Working Full-Time
Stayers
Leavers Working in Public School Districts
Leavers Working Elsewhere in Florida
Teaching Teaching Not Teaching Teaching Not in Public
Schools All Teachers (4-5 Combined, 6-8 Math, and 6-8 Reading) 0.004 0.010 0.019 0.021 0.091 [0.001]*** [0.005]** [0.008]** [0.008]*** [0.026]*** 25,522 3,289 1,412 All 4-5 Teachers, Average of Math and Reading
0.008 0.014 0.031 0.018 0.091
[0.002]*** [0.006]** [0.011]*** [0.010]* [0.035]***
14,300 1,875 668
All 4-5 Teachers, Math
0.009 0.016 0.029 0.023 0.099 [0.002]*** [0.006]** [0.011]*** [0.010]** [0.035]*** 14,298 1,874 668 All 4-5 Teachers, Reading 0.005 0.007 0.027 0.000 0.047 [0.002]** [0.007] [0.012]** [0.011] [0.037] 14,299 1,874 668
All 6-8 Math Teachers
0.003 0.008 0.017 0.023 0.076 [0.003] [0.010] [0.018] [0.014]* [0.048] 7,107 853 420 All 6-8 Reading Teachers -0.003 0.002 -0.004 0.021 0.112 [0.003] [0.009] [0.016] [0.014] [0.053]** 8 174,174 1,008008 487487
Notes: * significant at 10%; ** significant at 5%; *** significant at 1%; robust standard errors
adjusted for clustering at the teacher level appear in brackets; numbers of teachers appear in italics (the number of teacher*year observations is greater). Each value-added measure is standardized to have a mean of zero and standard deviation of one. In the "All Teachers" results (row one), dummies for 6-8 math and 6-8 reading are included in all regressions.
compensation while teaching for leavers are generalizable to the full population of teachers in these grades.
The first row reveals a modest but statistically significant correlation between estimated value added and earnings while teaching for all three groups, with point estimates suggesting that a 1 standard deviation increase in value added is associated with an increase in earnings of 0.4 percent (for stayers), 1.0 percent (for leavers remaining employed by public school districts), and 2.1 percent (for leavers working elsewhere). Because our value-added measures control for teacher experience, this relationship should not be driven by salary schedules offering higher pay for more senior teachers. It may instead reflect Florida’s bonus program for schools improving their performance on the state’s accountability system, pilot district-level merit pay schemes, or simply differences in average compensation levels across school districts (West and Chingos 2009).
Among leavers for other positions in public school districts, the point estimate for the relationship between value added and post-teaching earnings is only modestly larger than the comparable estimate for earnings while teaching. Among leavers for jobs in other industries, however, the relationship between value added and subsequent earnings increases in magnitude and remains statistically significant, with a 1 standard deviation increase in value added is associated with an increase in earnings of 9.1 percent.26 The estimate, which is statistically significantly different at the 1 percent level from the analogous estimate for the same group while teaching, provides evidence that the returns to skills associated with classroom
26
The coefficient on the value added measure when the predicted full-time probabilities are not used as weights is 0.103. The full set of unweighted results is available from the authors upon request.
effectiveness are greater outside of the public school system.27 The analogous coefficient on a value added measured based only on FCAT scores is 0.070; for a measured based only on SAT scores it is 0.077. That the coefficient on the average of the two measures is modestly larger is consistent with the hypothesis that averaging the two measures reduces measurement error.
The remaining rows of Table 3 provide separate estimates of the same relationship for elementary school teachers using only their math or reading value-added measure and for middle school math and reading teachers. None of the estimates for these groups differ by statistically significant amounts from the analogous estimates for the pooled sample. In order to maximize statistical power, we therefore focus on the pooled sample as we consider the robustness of these results to the inclusion of district fixed effects and demographic control variables. We focus on the sample of leavers that worked outside of the public schools.28
Table 4 estimates the relationship between value added and earnings conditional on district fixed effects and demographic variables including gender, race and ethnicity, age, and education credentials. As noted above, because Florida school districts are coterminous with counties, district fixed effects are useful to account for differences in regional labor markets. They also may eliminate any lingering bias in our estimates of teacher value added that are correlated with differences across districts. The additional control variables are included to see whether the relationship between value added and earnings reflects differences in earnings opportunities across demographic groups.
27
We test the significance of this difference by running a pooled model (including earnings while both teaching and non-teaching) that includes a dummy variable that identifies the non-teaching observations and an interaction between that dummy and our measure of value added. The coefficient on the interaction term and its standard error allow us to test the significance of the difference between the value added coefficient while teaching as compared to while not teaching. These models also include interactions between the non-teaching dummy and any control variables.
28
Table 4. Relationship between Log(Earnings) and Effectiveness with Controls: Leavers in Value-Added Sample Weighted by Probability of Working Full-Time
Leavers Working Elsewhere in Florida
Teaching Not in Public
Schools Teaching
Not in Public Schools
Value-Added in Math and/or Reading 0.013 0.071 0.013 0.064 [0.007]* [0.026]*** [0.007]* [0.026]** Male 0.025 0.176 [0.014]* [0.054]*** Black -0.016 -0.087 [0.016] [0.058] Hispanic -0.032 0.178 [0.022] [0.085]** Age in 2007 0.005 0.002 [0.001]*** [0.003] Master's Degree 0.086 0.159 [0.013]*** [0.049]*** Doctoral Degree 0.128 0.424 [0.031]*** [0.110]***
District Fixed Effects? Yes Yes Yes Yes
Teacher*Year Observations 3,297 3,001 3,277 2,964
Number of Teachers 1,412 1,398
R-squared 0.15 0.04 0.21 0.06
Notes: * significant at 10%; ** significant at 5%; *** significant at 1%; robust standard errors adjusted for clustering at the teacher level appear in brackets. The value-added
measures are all standardized (separately for 4-5, 6-8 math, and 6-8 reading) to have a mean of zero and standard deviation of one. Dummies for 6-8 math and 6-8 reading are included in all regressions.
The coefficients on the control variables yield several interesting patterns. Males earned 18 percent more than females while not teaching, as compared to 3 percent while teaching. This pattern may suggest that male teachers are more likely than females to prioritize salary when considering other job opportunities.29 A master’s degree is associated with earnings that are 16 percent higher. The earnings premium for a doctoral degree (a credential held by only 2 percent of all leavers) is far greater, perhaps suggesting that teachers who have invested in this credential are only likely to leave education for highly paid positions.
More important, the relationship between effectiveness and earnings is only modestly changed from the analysis in Table 3. Among leavers for other industries, controlling for district fixed effects reduces the coefficient of 0.091 to 0.071; adding the other control variables further reduces it to 0.064. However, the relative magnitudes of the teaching and non-teaching
coefficients remain largely unchanged: in the uncontrolled results, the teaching coefficient is 4.3 times as large the non-teaching coefficient; in the results with controls, the teaching coefficient is 4.9 times as large as the non-teaching coefficient. The difference across models is statistically significant at the 5 percent level when only district fixed effects are added and at the 10 percent level when the full set of controls is added.
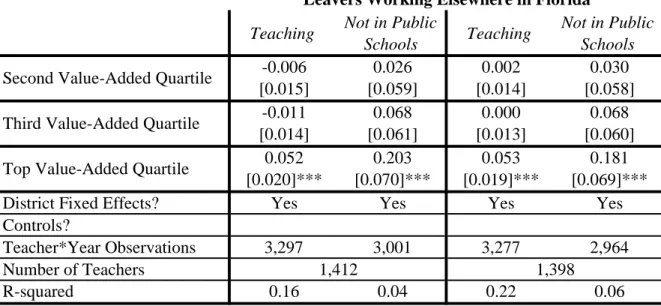
Table 5 presents the results of models that replace the continuous measure of teacher value added with dummy variables identifying teachers in each quartile of the effectiveness distribution. This non-linear specification indicates that teachers in the third and fourth effectiveness quartiles earn 7 percent and 20 percent more, respectively, than teachers in the bottom quartile. Although the difference between the coefficients on the variables identifying the top two quartiles of teachers is not statistically significant, their relative magnitudes are not
29
However, the relationship between effectiveness and non-teaching earnings does not differ significantly for males and females.
Table 5. Relationship between Log(Earnings) and Effectiveness Quartile: Leavers in Value-Added Sample Weighted by Probability of Working Full-Time
Leavers Working Elsewhere in Florida
Teaching Not in Public
Schools Teaching
Not in Public Schools
Second Value-Added Quartile -0.006 0.026 0.002 0.030 [0.015] [0.059] [0.014] [0.058] Third Value-Added Quartile -0.011 0.068 0.000 0.068
[0.014] [0.061] [0.013] [0.060] Top Value-Added Quartile 0.052 0.203 0.053 0.181
[0.020]*** [0.070]*** [0.019]*** [0.069]***
District Fixed Effects? Yes Yes Yes Yes
Controls?
Teacher*Year Observations 3,297 3,001 3,277 2,964
Number of Teachers 1,412 1,398
R-squared 0.16 0.04 0.22 0.06
Notes: * significant at 10%; ** significant at 5%; *** significant at 1%; robust standard errors
adjusted for clustering at the teacher level appear in brackets. The omitted value-added quartile dummy is for the bottom quartile. Dummies for 6-8 math and 6-8 reading are included in all regressions. Controls include teacher gender, race/ethnicity, agen, and education.
as expected. This result indicates that the overall relationship between effectiveness and earnings may be largely driven by differences between the least effective teachers and those in the top quarter of the distribution rather than by more refined distinctions across the full spectrum of teacher effectiveness.
This pattern suggests a potential concern with interpreting our results as evidence that more effective teachers have better opportunity wages outside of teaching. More specifically, the observed relationship between effectiveness and non-teaching earnings could be an artifact of higher quality teachers leaving voluntarily if they find a better job opportunity and less effective teachers leaving involuntarily (and thus suffering a displacement loss). Anecdotal evidence, however, suggests that involuntary departures from public school teaching are rare. Moreover, demand for teachers surged in Florida during this period due to rapid enrollment growth and the implementation of a 2002 constitutional amendment mandating sharp class-size reductions, making dismissals even more unlikely (West and Chingos 2009). In addition, we estimated the effectiveness-earnings relationship separately for teachers who had at least three years of
experience in the Florida public schools and thus were tenured, effectively making performance-based dismissal impossible. These estimates are less precise due to the reduced sample size (the number of teacher*year observations drops by more than half), but they are qualitatively similar to and never statistically significantly different from the estimates for the full sample.30
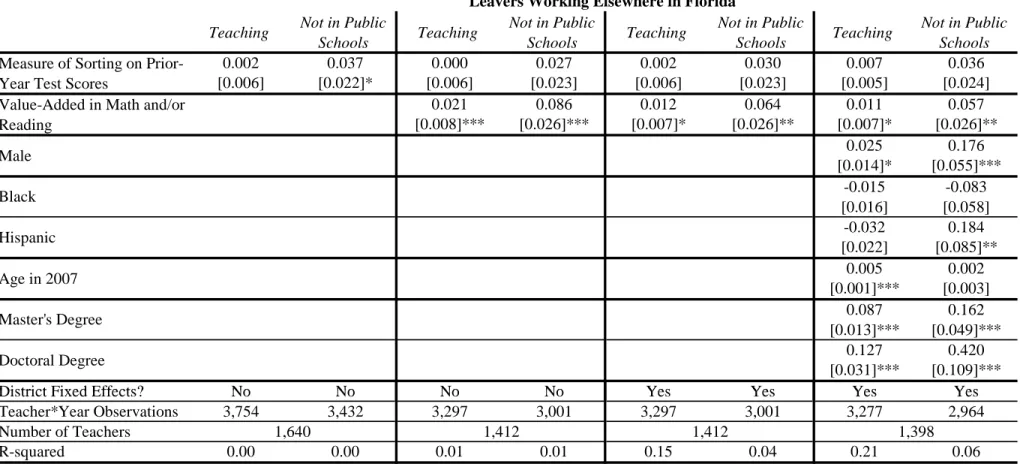
A remaining concern is that our results reflect bias in the value-added estimates due to non-random matching of students and teachers. For example, this might be the case if principals assign unobservably better students to teachers who have higher opportunity wages in an effort to keep them from leaving the profession. As a partial test of this proposition, we calculate a measure of student-teaching sorting on prior-year test scores and examine whether it is related to
30
non-teaching wages. We calculate this measure by regressing students’ prior-year test scores (from the FCAT and SAT in both reading and math) on school*grade*year fixed effects, then aggregate the residuals to the teacher*year level. We then aggregate the teacher*year averages to the teacher level using the shrinkage estimator described earlier. This sorting measure indicates to what extent each teacher is systematically assigned students with higher or lower initial test scores than other students in the same school, grade, and year.
Sorting on prior-year test scores should not bias our value-added estimates because we control for them, but this sorting measure may nonetheless serve as a proxy for sorting on unobservable characteristics related to student achievement. It is first worth noting that the sorting and value-added measures are only modestly correlated (r=.22), which implies that there is a great deal of variation in our teacher value-added measure that is uncorrelated with student sorting. Additionally, Table 6 shows that although the sorting measure is correlated with non-teaching earnings, the relationship is less than half as strong as for the value-added measure (compare column 2 of Table 6 with the final column of Table 3). Finally, when the sorting and value-added measures are examined together, the value-added measure is always statistically significant and the sorting measure is always insignificant (although the difference between the two coefficients is never statistically significant). We interpret these results as evidence that the estimated relationship between value added and non-teaching earnings is not simply the result of bias in the value-added estimates.
Finally, we conducted a complementary analysis of the pre-teaching earnings of new teachers entering the profession from other industries (those with 0 years experience in Florida
eighted)
d ? N
el appear in brackets. iation of 1,398
Table 6. Relationship between Log(Earnings), Sorting, and Effectiveness: Leavers in Value-Added Sample (W Leavers Working Elsewhere in Florida
Teaching Not S in Public chools Teaching Not in Publ Schools ic Teaching Not i Sc n Public hools Teaching Not in Public Schools Measure of Sorting on P
Year Test Scores
0. rior- 002 0.037 0.000 0.027 0.002 0.030 0.007 0.036 [0.006] [0.022]* [0.006] [0.023] [0.006] [0.023] [0.005] [0.024] Value-Added in Math an Reading d/or 0.021 0.086 0.012 0.064 0.011 0.057 [0.008]*** [0.026]*** [0.007]* [0.026]** [0.007]* [0.026]** Male 0.025 0.176 [0.014]* [0.055]*** Black -0.015 -0.083 [0.016] [0.058] Hispanic -0.032 0.184 [0.022] [0.085]** Age in 2007 0.005 0.002 [0.001]*** [0.003] Master's Degree 0.087 0.162 [0.013]*** [0.049]*** Doctoral Degree 0.127 0.420 [0.031]*** [0.109]*** District Fixed Effects?
District Fixe Effects Noo NoNo NoNo NoNo YeY ses YesYes YesYes YesYes Teacher*Year Observations 3,754 3,432 3,297 3,001 3,297 3,001 3,277 2,964
Number of Teachers 1,640 1,412 1,412
R-squared 0.00 0.00 0.01 0.01 0.15 0.04 0.21 0.06
Notes: * significant at 10%; ** significant at 5%; *** significant at 1%; robust standard errors adjusted for clustering at the teacher lev
The value-added and sorting measures are all standardized (separately for 4-5, 6-8 math, and 6-8 reading) to have a mean of zero and standard dev one. Dummies for 6-8 math and 6-8 reading are included in all regressions.
public schools in their first year of teaching).31 We weight these observations by the predicted probability that the worker was employed full time, using data from the Current Population Survey.32 Although the number of entering teachers is substantially larger than the number of leaving teachers, selection issues make it more difficult to interpret the results for entrants. Both entering and leaving teachers are self-selected, but for leaving teachers we have data on the entire population of potential leavers and thus can examine selection on observables (most importantly, value added). For entering teachers we cannot identify or describe the full
population of potential teachers (or even applicants for teaching positions) looks like. Thus we cannot confirm that the entering teachers are similar to the pool of potential teachers, as we did in Appendix Table 1 by comparing leaving teachers to the pool of potential leavers.
The results for the entering teachers, which are presented in Appendix Table 2, are not statistically significantly different from the results for the leaving teachers. However, the point estimates of the relationship between effectiveness and earnings for entering teachers are weaker in general and are more sensitive to the inclusion of control variables. In particular, the
coefficient on the linear value-added measure is only statistically significant when control variables are included. The results with control variables suggest that, among entering teachers, a one standard deviation increase in value added was associated with pre-teaching earnings that were 4-5 percent higher. This result appears to be driven entirely by the top value-added quartile, which made 11-14 percent more than the bottom quartile before entering the teaching profession.
31
We restrict the sample to observations when the worker was at least 25 years old, excluding the first pre-teaching year as a potential transition year (so the analysis is limited to workers observed for at least two years before entering teaching).
32
Specifically, we use using data on Florida workers aged 25-55 with a BA or MA in the 2002, 2003, and 2004 March Current Population Survey to run a probit regression of full-time status on earnings and gender.
6. Conclusions
The results presented above represent the first evidence on the extent to which
opportunity wages outside of teaching are correlated with classroom effectiveness, a question of considerable interest to policymakers. Moreover, we are able to compare the relationship between these characteristics and earnings inside and outside of the teaching profession for a common sample of leaving teachers.
There are several important limitations on this evidence. A relatively small number of the teachers in our data leave the classroom for other jobs—and many of those who leave teaching remain employed by public school districts. Those leaving teaching prior to retirement age are obviously not a randomly selected group, raising questions about the generalizability of our results to the broader population of current teachers, and a substantial share of exiting
teachers do not appear in our earnings data at all, making it impossible to determine whether they withdrew from the labor market altogether or moved to another state. Finally, our evidence comes only from a single state. Though teacher compensation policies in Florida school districts closely resemble those in use elsewhere, it is possible that our findings are driven by peculiarities of the state’s labor market or other education policies.
Even so, our results have clear implications for teacher compensation policies in Florida and likely beyond. We find greater dispersion in the earnings of leaving teachers after moving into other industries than for the same individuals while in the classroom, which suggests that teacher salaries are compressed relative to opportunity wages. This is hardly surprising given the role that collective bargaining plays in the determination of teacher salaries and likely also reflects greater heterogeneity in working conditions across multiple industries. Yet it confirms
that many teachers have better earnings opportunities outside of the profession while others likely earn more in teaching than would be the case elsewhere.
More importantly, we find that teachers who are most successful in raising student achievement earn more in other industries. Although teaching is surely a unique endeavor requiring specialized skills, the same attributes that make for effective teachers also appear to be rewarded in the broader labor market.
The specific design of policies to offset these differences in opportunity wages is beyond the scope of our analysis. In particular, the success of financial incentives in retaining effective teachers would depend on the wage elasticity of decisions to remain in the classroom, which may be low if many exiting teachers leave for reasons other than the opportunity to earn more
elsewhere. However, it seems safe to conclude that ongoing experimentation with merit pay and other incentive schemes should continue. By ignoring the realities of the outside labor market, the dominant teacher compensation systems in American public school districts are ill-designed to recruit and retain their most valuable employees.