THE USE AND OUTCOMES OF UNIVERSITY
LIBRARY PRINT AND ELECTRONIC
COLLECTIONS
Donald W. King, Sara Fine Institute
Sarah Aerni, University Library System
Fern Brody, University Library System
Matt Herbison, Sara Fine Institute
Amy Knapp, University Library System
University of Pittsburgh
Last Updated
April 2004
Thanks to Carol Tenopir and Roger Schonfeld for their helpful suggestions
Background ___________________________________________________________ 4 Methods ______________________________________________________________ 5 Survey of Faculty and Staff ___________________________________________________ 6 Survey of Students __________________________________________________________ 8 The Use and Outcomes of Reading Scholarly Journal Articles___________________ 9 Information Seeking and Reading Patterns _________________________________ 18 How Faculty and Students Learn About Articles They Read _______________________ 18 Sources of Articles Read_____________________________________________________ 24 Format of Articles Read by Faculty and Students ________________________________ 28 Use of Innovative Features of Electronic Format ____________________________ 30 Age of Articles Read by Faculty and Students ___________________________________ 31 Library Contribution to Article Reading and Outcomes from Reading ___________ 32 Twenty-Five Year Trends of Science Faculty Reading ____________________________ 33 The Use and Outcomes of Reading Library Provided Articles __________________ 37 Use of Library Collections ___________________________________________________ 37 Outcome of Reading from the Pittsburgh Library (ULS) Collections ________________ 42 Conclusions __________________________________________________________ 44 Appendix A ___________________________________________________________ 49 Readership Survey 1 ________________________________________________________ 49 Readership Survey 2 ________________________________________________________ 55 Readership Survey 3 ________________________________________________________ 62 Readership Survey 4 ________________________________________________________ 69 Student Readership Survey __________________________________________________ 77
THE USE AND OUTCOMES OF UNIVERSITY LIBRARY PRINT AND ELECTRONIC COLLECTIONS
Background
This report is part II of results from a study of the comparison of library electronic and print collections at the University of Pittsburgh. Part I (King et al. 2004) describes a conceptual framework of metrics and the comparative cost of the University Library System (ULS) electronic, current periodical and backfile collections and services which support access to these collections. This report describes the use and outcomes of use of these three collections. The principal metric of article use is the amount of reading determined from surveys of university faculty and staff1 and students. Use is also
measured by hits reported by electronic journal vendors and publishers and by reshelving counts from use of current periodical and backfile collections. While the three metrics of use are compared, reading is emphasized because it is a common metric of use to all three collections.
Faculty and student use of the three library collections is initially studied in the context of all article reading because readers have alternative sources from which to obtain articles, of which their libraries are an option. This permits one to examine when and under what circumstances library collections are chosen for reading articles. The broader context also includes information seeking patterns of how readers learn about the articles they read, where they obtain the articles, format of the articles when read, and age of the articles. The use of library collections is very much dependent on or at least related to
these four dimensions of information seeking patterns. This relationship is demonstrated from an example of trends over 25 years involving readership of scientists where the amount of reading has increased appreciably and the net increase appears to be absorbed by an equivalent increase in reading from library collections. The increase in library reading is clearly due in part to trends in the seeking patterns of scientists such as decreased reliance on personal subscriptions and increased searching from online
bibliographic databases, as well as access to larger library electronic collections. Finally, positive outcomes from reading articles are measured in several ways and in all instances reading from library-provided articles achieves more favorable outcomes.
Methods
The principal method used in this study is surveys of University of Pittsburgh faculty and undergraduate and graduate students located at the main campus in Oakland (Pittsburgh) and four other campuses (Bradford, Greensburg, Johnstown and Titusville).
Altogether there are 30,085 students (including 23,828 undergraduate and 6,257 graduate students) and 1,725 full-time instructional faculty and about 750 other professional staff, including those engaged primarily in research. The entire University, with the exception of Health Sciences and Law, is served by the University Library System (ULS) with libraries at all five campus sites and 19 departmental or special purpose libraries.
In late winter 2003 a readership survey was conducted with University faculty at all five campuses and toward the end of the Spring 2003 semester a readership survey was done
with students. Excluded from the surveys are law and health sciences (medical) faculty and students. Specific methods for these surveys are described below.
Survey of Faculty and Staff
The faculty survey included four questionnaires in which all four contained common questions onamount of reading, a series of questions about the last article read and general demographics. The four questionnaires also had a specific section dealing with: (1) time spend by readers identifying, locating, obtaining and photocopying or printing out the last article read, (2) outcomes of the last article read, (3) the awareness and use of special electronic journal and article features, or (4) other electronic journal-related issues such as communication connectivity and course assignments involving articles. While the four specific sections resulted in smaller sample sizes (i.e., about one-fourth of the sample), this approach helped reduce the length of the questionnaire by about one-half (i.e., four vs. eight pages).
The basic set of questions replicated 41 readership surveys dating back to 1977 (King et al., 1981). Each respondent was asked how many articles they had read in the past month and then a series of questions was asked about the article read most recently (even if read previously) such as: the journal title or topic (to ensure the respondent focused on a specific article), year the article was published, how the article was identified, where it was obtained, its format, and so on. Demographics included the respondents’
professional field, degree, gender, publications, number of personal journal subscriptions and so on. Relevant questions are repeated in the text of this report.
From a statistical standpoint, the amount of reading and demographics are treated as a simple random sample. The faculty survey yielded 209 responses. Amount of reading was estimated from the following question: “In the past month (30 days),
approximately how many scholarly articles have you read? Articles can include those found in journal issues, Web sites, or separate copies such as preprints, reprints, and other electronic or paper copies. Reading is defined as going beyond the table of contents, title, and abstract to the body of the article.” Annual reading is found by projecting the month estimate by 12. The average annual readings per faculty member is 215 with a confidence interval of + 30 at 95 percent level of confidence.
The last incident of reading (i.e., a form of the “critical incident technique”) presents a different statistical issue. The observation is a reading and the universe from which the sample is drawn is all readings by faculty or students over the designated time period. The sample design is cluster sampling where a cluster is the reported number of articles read by a respondent. Ideally, one would sample within each cluster of readings in proportion to the size of the cluster. For example, three clusters of, say, 50, 25 and 10 readings might be subsampled by one-fifth to yield subsamples of 10, 5 and 2. The critical incident method had only one reading subsampled per cluster which results in a large estimate of the variance (i.e., low precision) of the estimates made. On the other hand, if one treats the critical incident responses as a simple random sample, the results may be biased because the probability of selecting each reading is not equal. Tests of the amount of bias shows the estimates are reasonably accurate nevertheless, overall
reliability of an estimate is from a combination of precision and accuracy where
reliability is like the hypotenuse of a right triangle, sides of the triangle are precision and accuracy (Deming, 1950). We have chosen to accept a small bias versus the lower precision and treat the responses as a simple random sample. For example, the
proportion of readings by faculty from library collections is 48.4 percent with confidence interval of + 6 .8 percent at 95 percent level of confidence. The response rate is
unknown because some questionnaires were apparently lost in the mail and University policy did not allow follow-up to the original mailing.
One section of the report reports results of six surveys of scientists located in universities. Two surveys involve national samples of scientists in 1977 (King et al. 1981) and 1984 (King et al., 1984). Readership surveys were also performed in the University of
Tennessee in 1993 (Belefant and King, 2001) and 2000 (Tenopir and King, 2001), Drexel University in 2002 (King and Montgomery, 2002) and the University of Pittsburgh survey. Tenopir and King (2000) reports details on the first four surveys. All questionnaires are essentially the same with minor changes. The Pittsburgh faculty surveys are given in Appendix A.
Survey of Students
The student questionnaire replicated the faculty questionnaire without the four special sections and with relevant demographic questions. Because students are notoriously poor survey respondents, we adopted a technique developed by Talbot, et al., 1998, and Maughan, P.D., 1999 in which students are surveyed in a sample of classes. A total of 16
teachers agreed to administer the questionnaire in their classes covering 11 subjects. As a result we received 245 responses from undergraduate students and 75 from graduate students out of a total of 447 questionnaires handed out or a response rate of 71.6 percent.
The Use and Outcomes of Reading Scholarly Journal Articles
In this section we discuss the amount of reading of journals by faculty and students at the University of Pittsburgh, their time spent reading, and indicators of the outcome of reading journal articles. Journal use is observed in the surveys by asking the following question of faculty and staff: “In the past month (30 days), approximately how many scholarly articles have you read? Articles can include those found in journal issues, Web sites, or separate copies such as preprints, reprints, and other electronic or paper copies. Reading is defined as going beyond the table of contents, title, and abstract to the body of the article.” The students’ question was different in the first sentence only as follows: “In the Spring Semester (2003), approximately how many journal articles did you read? …”, Such reading often involves re-reading of an article. In fact, about 18 percent of faculty reading involves an article that is being re-read. Therefore, amount of readings is not the same as number of articles read.
The average amount of reading per person and total reading at Pittsburgh is shown in Table 1. Faculty tend to read much more than students on average; that is, about 215 readings per year per faculty vs. 24 readings by undergraduate students and 130 readings by graduate students. However, since there are over ten times as many students as faculty, about three-fourths of the estimated total of 1.9 million readings are by students.
The average amount of reading by faculty is roughly the same as observed at Drexel University in 2002 (197 readings) and the University of Tennessee, in 2000 (186 readings). All three universities have strong science and engineering programs and scientists and engineers tend to read more articles than non-scientists (King, et al. 2003). At Drexel (King and Montgomery 2002) doctoral students were found to read more than faculty (248 vs. 197 readings per year) and much more than doctoral students at
Pittsburgh (248 vs. 170 readings per year). This difference could reflect a different survey method in that the doctoral student survey was done in the same way as faculty (see methods section). Regardless, it appears that journal article reading remains high and, perhaps, as shown later, may actually be increasing.
Table 1 Average and Total Annual Amount of Journal Article Reading by Faculty and Students: University of Pittsburgh 2003
Students Faculty
& Staff Undergraduate Graduate
Annual Reading/Person 215 24 130
Total Reading 532,800 571,900 813,400
Source: Readership Survey - Faculty (N = 2,478, n = 209), Undergraduate Students (N = 23,828, n = 245), Graduate Students (N = 6,257, n = 75)
Information found in scholarly articles may appear in previously available sources such as preprint archives, technical reports, conference presentations or published proceedings, as well as, general acquaintance with reported research or its authors. Because of this possibility, for the last read article we asked readers: “Prior to the first reading of this article, did you know about the information reported or discussed in this article?” About
46 percent of the time readers said they knew about the information. Thus, over one half of the reading involved new information and, as shown below, even when the
information is known, it is useful and important to the readers.
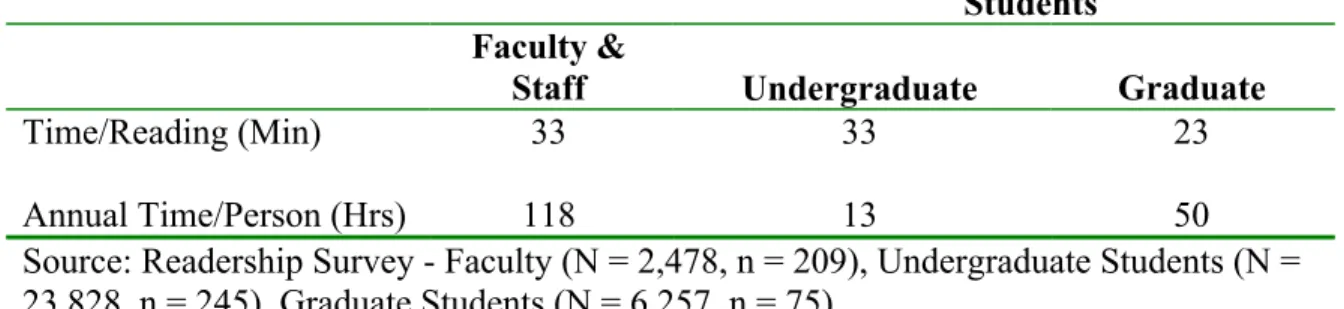
An indicator of the “value” of information read in articles is the amount readers are “willing to pay” for it in their time. Presumably they would not be willing to expend this valuable resource, if the return in useful information is not worth it. Table 2 displays estimates of the average time spent per reading and the total annual time spent reading articles by faculty and students at Pittsburgh. As shown, the average time spent per reading by faculty and undergraduate students is about 33 minutes per reading, but less for graduate students (23 minutes per reading). Masters students contribute to this lower estimate in time in that they average 21 minutes per reading, due perhaps to a small response, but doctoral students average 39 minutes per reading. At Pittsburgh, faculty averaged 118 hours per year compared with 139 hours at the University of Tennessee and 130 hours per year at Drexel University (King and Montgomery, 2002, Tenopir and King, 2002). Thus, faculty and students expend valuable time reading. In fact, faculty at Pittsburgh totally spend about 290,000 hours reading scholarly articles or, perhaps, the equivalent of about 120 to 150 full-time faculty members.
Table 2 Average Time Spent Per Reading and Average Annual Amount of Time Spent Per Faculty Member and Student: University of Pittsburgh 2003
Students Faculty &
Staff Undergraduate Graduate
Time/Reading (Min) 33 33 23
Annual Time/Person (Hrs) 118 13 50
Source: Readership Survey - Faculty (N = 2,478, n = 209), Undergraduate Students (N = 23,828, n = 245), Graduate Students (N = 6,257, n = 75)
There is abundant evidence as to why faculty are willing to spend this time reading scholarly articles. One indicator of outcome of reading is the purpose for which articles are read and another is the importance of the information in achieving the purpose. To address the purpose of reading we asked the following question concerning the last article reading: “For what purposes have you used, or do you plan to use, the information obtained from the article you last read?” Respondents were given a list of purposes (including an open-ended response) and asked to report the “principal purpose” and “all other purposes.” They were also asked: “How important is the information contained in this article to achieving your principal purpose?” with ratings given from 1-not at all important, 4-somewhat important, to 7-absolutely essential. Results of these indicators of outcomes are given in Table 3 below. The principal purpose most often reported by faculty is primary research with an average importance rating of 5.94. In all past 41 readership surveys done by colleagues (Griffiths and King 1993, Tenopir and King 2000), primary research is given as the most frequent and important principal purpose. For whatever reason, teaching tends to be less frequently reported and with lower importance ratings.
Table 3 Proportion of Readings by Faculty by the Principal Purpose for Reading an Article and Average Rating of Importance of Information Read in Achieving the Principal Purpose: University of Pittsburgh 2003
Purposes for
Reading Principal(%) Average Importance
1 All2
(%) Primary Research
Background Research Teaching
Writing Proposals, Reports, Articles, etc. Current Awareness/Keeping Up 32 18 18 10 22 5.94 5.14 4.89 6.00 5.19 52 56 40 46 58 Total 100 5.46
---1Importance Ratings: 1 – not at all important to 7 – absolutely essential 2All reported purposes for a reading including the principal purpose Source: Readership Survey: (N = 2,478, n = 50)
We also asked respondents: “In what ways did the reading of the article affect the principal purpose?” Table 4 below gives the proportion of responses to this question across all principal purposes and specifically for the reported primary research and teaching principal purposes for reading. The four most frequently reported ways the principal purpose for reading was affected was (1) “improved the result,” (2) “inspired new thinking or ideas,” (3) “narrowed, broadened or changed the focus of the purpose,” and (4) “led to new authors or data sources.” Thus, there is further evidence of favorable outcomes from the information provided by scholarly articles. On the other hand, two percent of faculty indicated that the reading “wasted my time.”
Table 4 Proportion of Readings by Faculty by the Ways in Which the Principal Purpose for Reading an Article was Affected: University of Pittsburgh 2003
Ways the Principal Purpose for
Reading Was Affected Purposes (%)All Principal Research (%)Primary Teaching(%) Improved the Result
Inspired New Thinking/Ideas
Narrowed/Broadened/Changed Focus Led to New Authors/Data Sources Confirmed Suspicions
Saved Time or Other Resources Resolved Technical Problems Resulted in Faster Completion Resulted in Collaboration/Joint Research 56 54 36 34 16 14 10 4 4 56 50 44 44 13 25 31 6 6 63 38 38 38 0 13 0 13 13 Source: Readership Survey (N = 2,478, n = 50)
Another way to address the outcome of reading was to ask: “If you had not obtained the information found in the article at all, how might it have affected your work or purpose for which the article was read?” Respondents were given the option of checking that: “work or purpose would not have been affected” and about one-fifth of faculty responded in this way. Of the rest of the respondents, 92 percent expressed away the work or purpose would be affected. Examples of ways reported (in open-ended response) are:
• A Chemistry professor said: “Lab time would have been required to discover what
had been done by others.”
• An English Associate Professor indicated that: “This article, which I had my
seminar students read, completely changed the direction of their thinking and greatly improved the course. Would have been much less successful without it.”
• A PhD Research Associate revealed that the article: “Presented new paradigm in
which to understand evaluation research in a particular content area.”
• A Mathematics Professor emphasized that: “I would have had to work out for
myself the information contained in the article, which would have taken considerable time.”
Thus, there is evidence that reading can positively affect the core goals of the university in continued learning, research and teaching.
Over the years others have observed that professionals whose work has been recognized through awards or special recognition tend to read more than those whose work has not been recognized (Lufkin and Miller, 1966; Griffiths and King, 1993; Tenopir and King 2000; and King and Montgomery, 2002). This result is true of the faculty survey at Pittsburgh as well. The question asked of faculty was: “In the past two years, have you received any awards or special recognition for your research or other profession-related contributions?” About one-third said they had and these faculty averaged 262 annual readings, while the other faculty averaged 199 annual readings. Of course this does not necessarily mean that reading more will lead to such recognition, but the result does suggest that reading is important to those who receive such recognition.
Increased faculty productivity is another indicator of positive outcomes from reading scholarly articles. In non-university settings, five indicators of productivity were
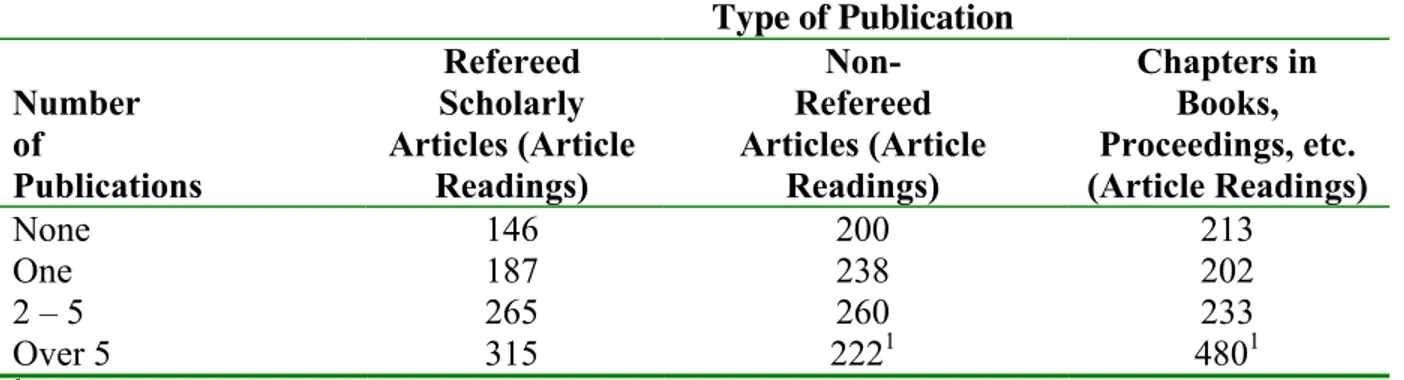
developed and the amount of reading was positively correlated with each of these indicators (Griffiths and King, 1993). Others have related amount of publishing as an output measure and shown that reading and authorship are positively correlated (Boyce et al., 2003). Results in Table 5 show similar results for Pittsburgh faculty. We asked faculty how many refereed articles; non-refereed articles; chapters in books,
proceedings, etc.; and entire books they had published in the past two years. About 15 percent of faculty indicated that they had not published at all in the last two years. A number of publications of each type are categorized from none to over five and the average amount of reading appears to increase with the number of publications. The result did not hold for entire books, although only 19 of 209 faculty reported they had published a book in the past two years. Those who had not published at all averaged 151 annual readings compared with 229 readings for those who had at least one publication. Table 5 Average Annual Reading by Faculty Authors by Number of
Publications in Past Two Years: University of Pittsburgh 2003 Type of Publication Number of Publications Refereed Scholarly Articles (Article Readings) Non-Refereed Articles (Article Readings) Chapters in Books, Proceedings, etc. (Article Readings) None 146 200 213 One 187 238 202 2 – 5 265 260 233 Over 5 315 2221 4801
1 Fewer than ten responses
Source: Readership Survey (N = 2,478, n = 201)
We make a distinction between authorship and number of articles actually written since articles often have co-authors. This issue is addressed by asking how many co-authors an author had on the last refereed article they had published. About one-third of the
faculty had not published a refereed article in the past two years. Of those who had, about 40 percent were sole authors and, altogether, the articles averaged 2.4 authors.
Students have entirely different purposes for reading than faculty. The student purposes for reading the article read are summarized in Table 6 below. Articles specifically assigned in a class or found as a classroom assignment are frequently given as purposes for reading. Another way of assessing extent of reading from classroom assignment was to ask: “Approximately what proportion of these articles that you read [in this semester] was a result of a classroom assignment?” By cross-multiplying the number of readings and proportion we arrived at an estimate of average readings from classroom assignment: 22 readings from classroom assignment by undergraduate students (compared with 24 total readings) and 32 classroom readings by graduate students (compared with 130 total readings). Undergraduate students appear to read largely due to classroom assignment, but as might be expected, graduate students read more for other reasons such as research for dissertations or theses.
Table 6 Proportion of Readings by Students by All the Purposes for Reading an Article: University of Pittsburgh 2003
Purposes for Reading Undergraduates (%) Graduates (%) Specifically Assigned in a Class
Found as a Classroom Assignment For a Research Project
To Keep Up with the Literature Just of Personal Interest
Other Purposes 23 42 51 4 16 1 28 21 32 7 14 5
Source: Readership Survey - Undergraduate Students (N = 23,828, n = 245), Graduate Students (N = 6,257, n = 75)
Information Seeking and Reading Patterns
Information seeking involves different patterns of how readers learn of articles they read and sometimes where they get the articles after they have identified them. The patterns also include the format of articles when read (i.e., electronic or print) and age of articles when read. There are literally thousands of combinations of means of identification, sources, format and age of articles read. Furthermore, each combination has an effect on the time and effort spent by readers, as well as, the outcomes from reading. In order to observe these patterns we have resorted to observing the incident of last reading to isolate individual pattern combinations, reader time and outcomes. In this section we address a few of these patterns.
How Faculty and Students Learn About Articles They Read
Readers learn about articles in many ways. We asked faculty and students: “How did you initially find out about this last article you read?” Browsing recently published journals is a common way articles are identified. Browsing could involve personal subscriptions (print or electronic), library collections (print or electronic) or other digital collections. This type of browsing is relevant because the article is available when identified which means that there is no time required by the reader to locate and obtain the article once it is identified. Another means of learning about articles is through searching or browsing online databases. Examples include an abstract and index (A&I) database from database publishers (e.g., Web of Science, ProQuest, First Search, Silver Platter), Web search engine (e.g., Google, Yahoo, AltaVista, Excite, Netscape), or online journal collection (e.g., Highwire, Science Direct). Unlike browsing, this method of identification requires
that readers (or someone on their behalf) must locate and obtain the article for it to be read. The same is true for using a current awareness service (e.g., Current Contents) to learn about articles. Sometimes readers identify articles they want to read from citations in other publications, again requiring it to be located and obtained or linked. Also, another person, such as a colleague or author, may tell readers about the article and sometimes actually give them a copy of the article. The extent of use of these ways of learning about articles and the time spent by readers are described below.
Table 7 summarizes the methods used by faculty and students to learn about articles read by them. Browsing is more frequently used by faculty (44.8 % of readings) than either undergraduate students (4.6%) or graduate students (19.9%). This partially reflects the fact that faculty continue to subscribe to journals (i.e., about 4 personal subscriptions per faculty member) and students, as shown above, have different purposes for reading that do not involve browsing. Undergraduate students appear to browse mostly from library collections (91.3% of reading from browsing), while graduate students browse more from personal subscriptions (18.5% of reading from browsing) because they average 1.4 subscriptions per student (compared with less than 1/2 subscriptions per undergraduate student).
Table 7 Proportion of Reading by Faculty and Students by the Method Used to Learn About Articles Read: University of Pittsburgh 2003
Students Method of Learning About Article Faculty & Staff (%) Undergraduate (%) Graduate (%) Browsing 44.8 4.6 19.9 Personal Subscription [63.8]1 [8.7]1 [18.5]1 Library Subscription [33.0] [91.3] [68.5] Other Digital Collection [3.2] [---] [13.0]
Online Searching 23.3 51.6 42.6
A & I Database [79.6] [65.3] [78.5]
Web Search Engine [12.3] [23.1] [14.6]
Online Journal Collection [8.1] [11.6] [6.9] Current Awareness Service 4.3 3.3 3.0
Print Version [11.2] [6.1] [87.5]
Electronic Version [88.8] [93.9] [12.5]
Cited in Other Publication 10.5 8.6 1.5
Another Person 14.8 31.5 33.1
Don’t Know 2.4 0.4
---Total 100.1 100.0 100.1
1 Proportions in brackets are subtotals of principal methods
Source: Readership Survey - Faculty (N = 2,478, n = 209), Undergraduate Students (N = 23,828, n = 245), Graduate Students (N = 6,257, n = 75)
Most faculty browsing of personal subscriptions is from print issues (86.7% of reading vs. 13.3% from electronic versions) even though electronic versions are often available to subscribers. However, their browsing of the library collection is mostly from electronic journals (58.1% of reading from browsing vs. 41.9% from print issues). All observed student browsing from personal subscriptions is from print issues, but electronic
browsing is preferred with the library collection: that is, 57 .1 percent of browsed reading from the library collection by undergraduate students and 95.6 percent of reading by graduate students. Clearly subscribers continue to prefer to browse print over electronic journals, perhaps due to portability, ease of use or time required to browse. The time required for faculty to browse is discussed below.
Browsing suggests that several articles may be read during a browsing session. Thus, estimating the average time per article read must take into account total browsing time and number of articles read during a browsing session (often after receipt of an issue). We addressed this estimate by the following questions: “If this article was found by browsing, approximately how much time did you spend browsing?” and “as a result, how many articles did you read or plan to read?” Estimates from a small sample provide a clue suggesting that readers averaged about 12 minutes browsing per article read and there is little difference observed between browsing personal subscriptions vs. library collections or print vs. electronic versions. Thus, browsing time does not appear to be a reason that subscribers prefer print over electronic versions.
Online searching accounts for nearly one-fourth of faculty reading, but a much higher proportion for undergraduate students (51.6% of reading) and graduate students (42.6% of reading). Searching A&I databases is prevalent for both faculty and students, but undergraduate students seem to use Web search engines more than faculty or graduate students (23.1% vs. 12.3% and 14.6% respectively).
The average online search time required per article read was established from the following questions:
• “If this article was found by searching, about how much time did you (or
someone on your behalf) spend searching?”
• “After you identified this article, approximately how much time did you
and/or someone else on your behalf spend on each of the following activities?
- Obtain, request, receive or download and display the article - Photocopy or print out the article
- Other”
The average time spent searching online is much longer than browsing (77 minutes per search vs. 21 minutes per browsing session), but also yields many more articles that are read (10.2 articles per search session vs. 1.8 articles per browse session). Thus, the average time taken in online searching per article read appears to be somewhat less (8 minutes per article read from online search vs. 12 minutes from browsing).
Some articles are initially identified by citation in another publication. About one-tenth of readingsare found this way by faculty and undergraduate students, but less frequently by graduate students. Faculty spend about17 minutes per article locating the articles found this way. Another way readers learn about articles is that another person tells them about the article. About one-third of student reading is identified in this manner, largely due to a professor or teacher telling them about it. Faculty also learn about articles from others (14.8% of reading). About half of the time, the article is actually given or sent by that person. On the other occasions, it takes
readers (or someone on their behalf) an average of 12 minutes to locate and obtain the article.
Even though readers learn about articles in many ways, they tend to spend about 8 to 17 minutes on average to identify and/or locate and obtain the articles. Perhaps this amount of time is the limit of tolerance that readers are willing to pay to get the articles they read.
As mentioned earlier, some means of learning about articles requires locating and obtaining articles once identified; that is, when (1) searching online or a current awareness service, (2) identified from a citation in another publication, or
sometimes (3) when someone tells the reader about it. Since library collections are a large and trusted source, they are most often relied upon to obtain these articles. We found that 71.3 percent of these articles are obtained from the library
collections (i.e., print and electronic). Personal subscriptions are used for 7.5 percent of these articles and 21.2 percent are from other sources.
The means of learning about articles has a bearing on the age of articles read as shown in Table 8 below. As might be expected, most of the articles found by browsing and using current awareness services are recently published articles. Note that the method of learning about an article refers to how it was “initially” identified. However, the article could be read again many years later. In fact, all of the older articles identified through browsing were actually a re-reading of the
article. Thus, these articles could have been new when initially found. Many of the articles found by online searching are new (42.9% of articles read), but some are quite old as well (8.2% over ten years). Interestingly many of the articles found through citations are over ten years old (45.5% of articles read). Apparently, most of the articles mentioned by other persons are new articles (66.7% of articles read), perhaps some being authors promoting their recent articles.
Table 8 Proportion of Reading by Method of Learning About the Article by Faculty by Age of Article Read: University of Pittsburgh 2003
Method of Learning About Article Age of
Article Read Browsing (%) Current Awareness (%) Online Search (%) Citation (%) Other Person (%)
Under One Year 79.6 88.9 42.9 18.2 66.7
One to Five Years 16.1 11.1 38.8 22.7 16.7
Six to Ten Years 2.2 --- 10.2 13.6 10.0
Over 10 Years 2.2 --- 8.2 45.3 6.7
Total 100.1 100.0 100.1 100.0 100.1
Source: Readership Survey (N = 2,478, n = 208)
Sources of Articles Read
The methods used by readers to identify articles are described above, as well as sources used to obtain the articles when necessary. The full range of sources used by readers are described in this section. The principal article sources used by faculty and students at Pittsburgh are their personal subscriptions, free web
journals, library collections, or through separate copies of articles such as preprints, reprints, provided by another person, or author Web site. To establish the source and format of read articles we asked the following questions: “From what source
did you last read this article?” and “In what form was the article when last read?” The forms included print, photocopy or facsimile copy, computer display of e-text, and printout of e-text. The extent to which these sources are used is given in Table 9 below. We included interlibrary loan and document delivery in estimates of library use. As with browsing, faculty read much more frequently from personal
subscriptions than do students. We categorize “a free Web journal” between personal subscriptions and library collections because readers sometimes obtain articles from library electronic collections, but don’t realize it (i.e., due to the library branding issue), otherwise this use would be similar to personal
subscriptions. Nearly one-half of reading by Pittsburgh faculty is from their ULS library collection. This is higher than recently observed at the University of Tennessee (34.4%) in 2000 and Drexel University (42.4%) in 2002 (King et al. 2003). About three-fourths of student reading is from their library collections. Nearly ten percent of reading by faculty is from separate copies of articles.
Students more frequently read from separates (i.e., undergraduate students – 16.8% of reading and graduate students – 14.4% of reading). Another person is the source for most separate copy reading.
Table 9 Proportion of Reading by Faculty and Students by Source and Format of Articles Read: University of Pittsburgh 2003
Students Source & Format of Article Read Faculty & Staff (%) Undergraduate (%) Graduate (%) Personal Subscription 33.0 2.9 3.6 Print [90.1]1 [58.6] [100.0] Electronic [9.9] [41.4] [---]
A Free Web Journal 8.8 7.8 5.9
Library Collection 48.4 72.6 76.0 Print [25.0] [33.6] [26.1] Electronic [75.0] [66.4] [73.9] Preprint 2.3 --- ---Print [60.0] [---] [---] Electronic [40.0] [---] [---] Reprint 0.9 4.1 ---Print [50.0] [75.0] [---] Electronic [50.0] [25.0] [---] Another Person 5.1 6.1 8.1 Print [81.8] [83.3] [100.0] Electronic [18.2] [16.7] [---]
Author Web Site 0.5 0.7 0.4
Other Web Site 0.9 5.8 5.9
Total 99.9 100.0 99.9
1 Proportion in brackets are subtotals of Principal sources
Source: Readership Survey - Faculty (N = 2,478, n = 209), Undergraduate Students (N = 23,828, n = 245), Graduate Students (N = 6,257, n = 75)
Two electronic article innovations are preprint archives and author Web sites (Tenopir, et al. 2003). Evidence suggests that these two innovations are used, but not frequently so by Pittsburgh faculty. Based on the critical incident estimate faculty average about two annual readings from preprint archives or 4,900 readings at the University. We also had a series of questions dealing with the awareness and use of electronic journal features. We asked the following series of questions about
preprint archives: “Are you aware of large databases of article preprint archives?” and, “if yes, have you ever used them?” and, if yes, “how many times in the last year?” Answers to these questions are as follows:
• One-half of faculty are aware of the databases.
• Only 19.3 percent of all faculty have used these databases.
• Average use in the last year by those who have used the preprint
archives databases is 4.9 times per year or 0.9 times per all faculty.
Thus, the second series of questions confirms the infrequent use of preprint archives, although science faculty are more aware and use the databases more frequently than other faculty. Similarly, at the University of Tennessee, faculty average about 3.2 readings per year from preprint archives and at Drexel University there were no observed responses from preprint archives (King, et al. 2003). We also asked the following questions
concerning manuscript submitted to preprint archives: “Have you ever submitted articles to them?” and, if so, how many in the last two years?” There were no submittals
reported by non-scientists and only eight percent of scientists indicated they had done so. Those scientists who had submitted, averaged 2.7 articles submitted in the last two years.
The critical incident estimate of amount of reading from author Websites is about 1.1 annual readings per faculty member or about 2,700 total reading at the University.
Elsewhere on the questionnaire we asked : “Have you ever read or downloaded a paper directly from an author’s website?” and “if yes, about how many times in the last year.? A little over one-half of faculty said they had (51.9%) and those who had used author websites averaged using them five times in the last year. Across all faculty, use was 2.6 times last year, again demonstrating relatively low use at this time. Scientists’ results are about the same as non-scientists in their frequency and amount of use. Faculty at the University of Tennessee and Drexel University average about four uses per year based on critical incidents of reading observations (King et al. 2003). Only about one-fifth of Pittsburgh faculty indicated that they have a personal Website of their publications.
Format of Articles Read by Faculty and Students
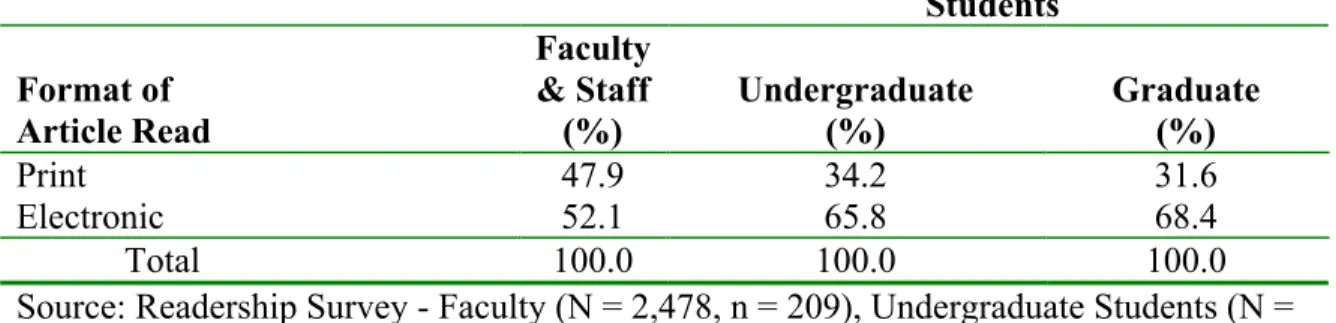
Readers often have the choice of reading from print or electronic versions of articles. As shown in Table 10 below, both faculty and students appear to favor electronic versions, but students more so. At the University of Tennessee in 2000 faculty still tended to prefer print (80.2% of readings were in print) although this may be because the library was in a transitional state at that time. In 2002, Drexel University faculty also read somewhat more frequently from print versions (56.8% of readings in print) even though the library had migrated to an almost complete electronic collection (King et al, 2003).
Table 10 Proportion of Reading by Faculty and Students by Format of Article Read: University of Pittsburgh 2003
Students Format of Article Read Faculty & Staff (%) Undergraduate (%) Graduate (%) Print 47.9 34.2 31.6 Electronic 52.1 65.8 68.4 Total 100.0 100.0 100.0
Source: Readership Survey - Faculty (N = 2,478, n = 209), Undergraduate Students (N = 23,828, n = 245), Graduate Students (N = 6,257, n = 75)
Faculty continue to prefer print for their personal subscriptions (King, et al., 2003). At Pitt, about 90 percent of reading from personal subscriptions is in print format and the same is observed at University of Tennessee (92.6%) and Drexel University (87.8%). Electronic format is preferred for the library collections at Pittsburgh (75.0%) of reading which reflects a quick adaptation of this format by faculty. At Drexel University, by 2002 when the survey was done, nearly all of the library collection had migrated to the electronic format and 83.1 percent of reading was in this format. At the University of Tennessee, only 21.9 percent of the reading from the library collection was in electronic format in 2000 since it was in a transitional phase.
With the critical incident method, Pittsburgh faculty are estimated to have about 112 article readings per year from electronic versions. We also estimated annual use by asking the following questions of a subset of respondents: “Have you ever used electronic journals?” and “about how many articles did you read from electronic journals in the past 30 days?” This question is based on observation from a sample of faculty and, therefore, avoids the potential bias of estimates of the proportions of reading (and total)
from electronic versions using the critical incidents method. All faculty reported they had used electronic journals.
Use of Innovative Features of Electronic Format
Several previous readership surveys of scientists from 1990 to 2002 provided an opportunity to observe information seeking and reading patterns through three journal system phases: (1) an early phase following introduction of electronic journals; (2) an evolving phase in which a majority of scientific journals are available in electronic format and (3) an advanced phase in which searching capabilities, advanced features, and individual articles are integrated in a complete system along with full text of core journals available back to their origin (Tenopir, et al 2003). The evolving system was developed by the American Astronomical Society (AAS) in conjunction with the University of Chicago Press. This system and its use is described by Tenopir, et al. (2003) and Boyce, et al. (2004). The comparison among phases provides evidence that advanced features may result insubstantial changes in information seeking and reading patterns. For this reason we asked several questions of Pittsburgh faculty concerning their awareness and use of advanced electronic journal features such as journals
published exclusively in electronic format; backward and forward citation links; links to numeric databases and images; and electronic access back to original issues.
Tenopir, 2004, estimates that journals are now published exclusively in an electronic journal format and she estimates that about 11,000 active peer reviewed journals are now available in electronic format, either exclusively or in a combination of formats.
Some publishers, such as the AAS, now provide backward and forward citation links. Nearly two-thirds of Pittsburgh faculty is aware that some electronic journals have such features and about 37 percent have used such a feature. The users (i.e., the 37% who used) appear to rely on this feature in that they average using them about ten times in the last year.
Some publishers, such as AAS, also provide links to numeric databases and images. Fewer faculty are aware of these linkages (48% of faculty) and only one-fifth say they have used them. Those who use them, average about five uses in the last year. A number of publishers, such as AAS, American Chemical Society, and Elsevier (Science Direct) and services such as JSTOR now provide electronic journals back to their origin. Most faculty are aware of this feature (84.6% of faculty) and three-fourths say they have used them. The users of this feature indicate that they have used them an average of 21 times in the last year. Thus, awareness of these advanced features of electronic journals is reasonably high at Pittsburgh and use is beginning and undoubtedly will increase as more publishers provide such features.
Age of Articles Read by Faculty and Students
We asked readers: “Approximately what year was the [last read] article
published/posted?” The age of articles read by faculty and students is displayed in Table 11 below. Since the questionnaires were completed in the Spring 2003, the proportions of readings by age had to be adjusted by interpolation in log normal scale. These results
show that faculty tend to read newer articles more than students, again reflecting the purposes for which the articles are read and the fact that faculty more often browse and read their current personal subscriptions. The elongated age distribution of articles read by undergraduate students reflect the fact most of their reading is due to classroom assignment. Whereas graduate students are more likely to be concerned with newer articles, perhaps due to exhaustive literature review for their dissertations and theses.
Table 11 Proportion of Reading by Faculty and Students by Age of Article Read: University of Pittsburgh 2003
Students Age of Article Read Faculty & Staff (%) Undergraduate (%) Graduate (%) 1st Year 61.6 26.2 37.1 2nd year 3 – 5 years 6 – 10 Years 10.4 12.2 6.7 16.1 23.7 18.7 19.9 21.0 12.1 11 – 15 Years 4.8 5.9 4.4 Over 15 Years 4.3 9.4 5.5 Total 100.0 100.0 100.0
Source: Readership Survey - Faculty (N = 2,478, n = 209), Undergraduate Students (N = 23,828, n = 245), Graduate Students (N = 6,257, n = 75)
Library Contribution to Article Reading and Outcomes from Reading
This section provides evidence that faculty appear to read more articles now than 25 years ago and that this increase may be due to additional reading from library collections. Estimates of the use of the print collection include reshelving counts and survey amount of reading. Similarly estimates of electronic collection use are from vendor and publisher provided “hits” and again survey amount of reading.
Twenty-Five Year Trends of Science Faculty Reading
From 1977 to 2003 there have been 41 readership surveys of professionals using the same questions with minor revisions to reflect changes in technologies (i.e., the Web and electronic sources). Two of the surveys were national surveys of scientists done for the National Science Foundation in 1977 and 1984 (King, et al., 1981, King et al., 1984). These surveys included nine fields of science: physical science (e.g., physics and chemistry); mathematics and statistics; environmental sciences; computer sciences; engineering, life sciences; psychology; social sciences; and other sciences (e.g., library and information sciences). Other surveys were done for companies (e.g., AT&T Bell Labs), government agencies (e.g., National Institutes of Health), or national laboratories (e.g., Oak Ridge National Laboratory). Four of the other surveys were of university faculty. Since the two national surveys involved scientists and about half of respondents were located in universities, we extracted scientists’ responses from the national survey and examined the university surveys to establish a common trend of university scientists reading patterns over a quarter century period. The latter four surveys were from the University of Tennessee in 1993 and 2000, Drexel University in 2002 and the University of Pittsburgh in 2003 (Belefant – Miller and King 2001, 2002; Tenopir and King 2002, King and Montgomery 2002, Tenopir et al., 2003, King et al., 2003). All of the surveys included the nine fields of science mentioned above.
Figure 1 below shows the average readings per scientist in the years 1977, 1984, 1993 and, collectively, 2000 to 2003. There appears to be a steady increase in amount of
reading with a net increase of 66 readings over the 25-year time span with an increase of about three readings per year from 1977 to 1984, two reading from 1984 to 1993 and three readings from 1993 to the recent years. A similar trend also exists with non-university scientists as well (Tenopir & King 2000). Figure 2 shows that amount of reading from university library collections has increased about the same amount; that is 64 readings from 37 in 1977 to 101 in recent years. Thus, the net growth in amount of reading by university scientists appears to be largely absorbed by the university library collections. Reasons for this phenomenon are discussed below.
Fig. 1 – Average Articles Read Per Scientist 150 172 188 216 0 50 100 150 200 250 1977 (National survey, n=2,350) 1984 (National survey, n=865) 1993 (Univ. of TN, n=89) 2000-03 (TN, Drexel and Pittsburgh, n=300)
Average number of articles
Figure 2 – Scientist Readings per Year
We mentioned previously that libraries are a trusted source or location for articles that are initially identified but need to be located and obtained. Over the 25–year period
scientists have broadened the range of journals from which they read. In 1977 they read at least one article from 13 journals, but now read from over twice that number of journals. In 1977 university scientists subscribed to an average of 4.2 subscription and that amount has decreased to 3.5 subscriptions and scientists tend to use their library collections to read from the cancelled subscriptions accounting for about ten to 15 increased readings from the library collections. In 1977 university scientists read an average of about three articles per year found from online (or other automated) searching and that number has increased to over 50 articles in the recent years. At Pittsburgh over 70 percent of articles identified this way by scientists are located and obtained from the library collections. When scientists go to libraries to locate and obtain articles or just to
37 52 92 101 113 120 96 115 0 20 40 60 80 100 120 140 1977 1984 1993 2000-03
Scientist Reading per Year
Library Collections Other Sources
potentially broadening the number of journals read. Finally, the addition of library electronic journals has made additional library journals readily available to faculty (and students). There is evidence that these additional journals are in fact read. Ongoing research at Drexel University shows that most of their electronic titles that were not previously subscribed by the library in print have at least some hits and, presumablyare read.
Even though the amount of reading by faculty scientists has apparently increased, the time spent reading apparently has not. In 1977, time spent reading articles was 120 annual hours per scientist and it is currently 127 annual hours. Thus, scientists spend less time per reading now (35 minutes per reading) than in 1977 (48 minutes per reading). Whether the evidence of increased reading and stable time spent reading by science faculty extends to faculty in other disciplines is unknown. However, since many universities like Tennessee, Drexel and Pittsburgh have extensive science and
engineering schools and research programs, these results suggest that information seeking and reading patterns are changing in important ways, due in part to economic and
The Use and Outcomes of Reading Library Provided Articles
Use of Library Collections
In Table 9 we showed that about one-half of faculty reading and three-fourths of student reading comes from the library collection or is library-provided (i.e., through interlibrary loan or document delivery). The estimated total amount of reading of the library
collection is given in Table 12 below. Altogether, there estimated to be about 1.3 million readings from the Pittsburgh library collections, about 71.7 percent of these readings are in electronic format. Nearly one-half of library article reading is done by graduate students (47.6%) followed by undergraduate students (31.9%) and faculty (20.5%).
Table 12 Estimated Annual Total Reading by Faculty and Students from the Library Collection by Format: University of Pittsburgh 2003
Students Format of
Article Read Faculty& Staff Undergraduate Graduate All Readers
Electronic 199,800 275,700 457,700 933,200
Print 66,600 139,500 161,900 368,000
Total 266,400 415,200 619,600 1,301,200
Source: Readership Survey - Faculty (N = 2,478, n = 209), Undergraduate Students (N = 23,828, n = 245), Graduate Students (N = 6,257, n = 75)
One reason that the survey estimates of reading are projected to an annual total is to compare the amount of reading from the electronic collection with vendor and publisher provided data and amount of reading from print collections with observed amount of reshelving. These reading estimates were also used for allocation purposes in library cost analyses (King et al., 2004). The annual sum of vendor and publisher “hits” is 1,320,000 or about 42 percent higher than the survey estimate of reading (933,200). One expects
counts (Luther, 2000). Also, not all vendors or publishers provide use data. The Pittsburgh results are compared with similar results from Drexel University (King and Montgomery, 2002) since Drexel results should reflect about the same amount of
overcount of hits and undercount due to lack of reporting these data. The annual vendor and publisher provided results was about 400,000 hits compared with about 300,000 readings or about one-third more hits than readings which is reasonably close to the Pittsburgh comparison (i.e., 42% more hits).
Excluding reading from interlibrary loan and document delivery, the total amount of reading from the print current and backfile use is estimated to be 341,200 readings. The annual reshelving is estimated to be 44,600 reshelved issues from the current collection and 88,800 reshelved volumes from the backfifles. Reading estimates from these collections are based on the age of the article read where articles from publications read up to one year old are considered to be from the current collection. These results imply 127,300 readings from the current collection and 213,900 readings from the backfiles. These results are displayed in Table 13 below. There is evidence that readers tend to read more than one article when an issue or volume is used (then reshelved). An exit survey at the National Institutes of Health Library yielded an estimate of 3.2 readings per item reshelved (Griffiths and King, 1993) which is not too different from the overall
comparison at Pittsburgh (2.6 readings per item). At Drexel University the ratio observed was 1.8 readings per item reshelved (King and Montgomery, 2002). Thus, these overall data are similar, although the Pittsburgh ratio may be low for current issues and high for backfile volumes.
Table 13 Estimated Amount of Reading by Faculty and Students and
Reshelved Items Current and Backfile Collections: University of Pittsburgh 2003 Type of Collection Readings1 Items Reshelved2 Readings/Item
Current (Issues) 127,300 44,600 2.9
Backfile (Volumes) 213,900 88,800 2.4
Total 341,200 133,400 2.6
Source: 1Readership Survey - Faculty (N = 2,478, n = 209), Undergraduate Students (N = 23,828, n = 245), Graduate Students (N = 6,257, n = 75)
2Annual ULS statistics
The extent to which library collections are used appears to be dependent on the age of articles as shown in Table 14. About 39 percent of reading of new articles (under 1 year old) by faculty is from library collections and increases to 89 percent of reading for articles over 15 years old. A similar trend holds for students as well, but with some aboration. Clearly the library is the source of choice for older articles.
Table 14 Proportion of Reading by Faculty and Students from the Library Collection by Age of Article Read: University of Pittsburgh 2003
Age of Article Read Source of Article Read Under 1 Year (%) 2 to 5 Years (%) 6 to 10 Years (%) 11 to 15 Years (%) Over 15 Years (%) Faculty & Staff
Library 39.2 64.4 64.3 70.0 88.9 Other 60.8 35.6 35.7 30.0 11.1 Total 100.0 100.0 100.0 100.0 100.0 Undergraduate Students Library 67.4 72.3 85.0 70.0 97.2 Other 32.6 27.7 15.0 30.0 2.8 Total 100.0 100.0 100.0 100.0 100.0 Graduate Students Library 57.0 97.7 78.0 100.0 92.5 Other 43.0 2.3 22.0 --- 7.5 Total 100.0 100.0 100.0 100.0 100.0
In Table 9, we show that most articles read from library collections are from electronic versions of journals and articles: faculty (75.0%), undergraduate students (66.4%) and graduate students (73.9%). Since most reading of older articles is from library
collections, we examined the extent to which these older articles are available and read in electronic format as shown in Table 15. Generally, the newer articles read from library collections tend to be in electronic format, but decline as the articles become older to about one-half of articles over 15 years being in electronic format. Thus, licenses from JSTOR and library access to older electronic journals from American Chemical Society and American Astronomical Society appear to be well used.
Table 15 Proportion of Reading by Faculty and Students from Library Collections by Format and by Age of Article Read: University of Pittsburgh 2003
Age of Article Read Format of Article Read Under 1 Year (%) 2 to 5 Years (%) 6 to 10 Years (%) 11 to 15 Years (%) Over 15 Years (%) Print 31.1 21.2 31.2 37.5 49.6 Electronic 68.9 78.8 68.8 62.5 50.4 Total 100.0 100.0 100.0 100.0 100.0
Source: Readership Survey - Faculty (N = 2,478, n = 209), Undergraduate Students (N = 23,828, n = 245), Graduate Students (N = 6,257, n = 75)
Pittsburgh provides access to the electronic collection from non-library locations such as an office or lab for faculty and schools or departments for students and a campus library, home, out-of-town location and elsewhere for all Pittsburgh readers. Table 16 shows the proportion of reading by faculty and staff from these locations. Most reading from the electronic collection by faculty is done in their office or lab (87.7% of reading from
electronic collection). Undergraduate students rely most often on their campus library workstations to obtain articles from this collection (41.4% of reading), but also frequently obtain the articles at home (30.1% of reading) or from workstations in their school or department. Graduate students, on the other hand, obtain most of their electronic collection articles at workstations at their school or department (75.9% of reading). Of all reading from the library electronic collection, most reading originates from readers’ office, lab, school or department workstations (62.9% or about 590,000 total reading). The campus library workstations are used for 21.5% of reading or about 200,000 total reading. The rest are obtained at home, out-of-town or elsewhere (15.6 percent or about 145,000 total reading).
Table 16 Proportion of Reading by Faculty and Students of the Library Electronic Collection by Where the Reader Obtained the Article: University of Pittsburgh 2003 Students Where Electronic Article Was Obtained Faculty & Staff (%) Undergraduate (%) Graduate (%) Total Reading (%) Office or Lab 87.7 --- --- 18.8 School/Department --- 23.5 75.9 44.1 Campus Library 4.1 41.4 17.1 21.5 Home 6.9 30.1 7.0 13.8 Out of Town 1.4 --- --- 0.3 Elsewhere --- 5.1 --- 1.5 Total 100.1 100.1 100.0 100.0
Source: Readership Survey - Faculty (N = 2,478, n = 209), Undergraduate Students (N = 23,828, n = 245), Graduate Students (N = 6,257, n = 75)
Outcome of Reading from the Pittsburgh Library (ULS) Collections
Earlier in this article we presented some examples of favorable outcomes from faculty reading of journal articles. In this section we describe indicators of outcomes from faculty reading of Pittsburgh library collections, sometimes comparing these outcomes with those observed from other sources of reading. The purposes for which the library collections are used are essentially the same as reading from other sources. However, the average ratings of importance of the information read from the library collection is higher than from other sources; that is, 5.58 average rating for reading library articles versus 5.22 average rating from other sources. Had the information found in the library-provided article not been found, the work or purpose would not have been affected for 12.5 percent of readings. However, much more of the reading from other sources would not affect the work, thus indicating that the library collection articles are not only more important but generally have greater affect on faculty’s work; particularly their primary research. We mentioned above that faculty whose work has been recognized through award or special recognition are found to read more than others. These award winners tend to have even greater reading when they are more likely to use the library collection.
We asked faculty to indicate where they would obtain the information from the last article read, if the source of the article (i.e., the library) was not available. Some said they would not bother getting the information, presumably because its informational worth is not justified by the time, effort or cost necessary to acquire it from another source. In fact, 21.7 percent of the readings were such that readers would not bother getting the information, with a much lower proportion from library articles than those
obtained elsewhere. Places they would go to get articles included from a non-Pittsburgh library, subscribing to the journal, the author, a colleague and so on. Presumably the readers would have used these sources initially if they would cost readers less in their time or ease of use. The readers who would obtain the same information from a non-Pittsburgh library source were asked how much they would spend in their time and/or dollars to obtain the information from the other source. By comparing this cost to the time they spent obtaining the information from the library collections, it appears that faculty would spend an average of 17 minutes more than spent obtaining the article from the library in addition to an average expenditure of $2.10 more.
There are estimated to be about 1.3 million readings from the ULS collections, of which about 78 percent would involve going to another source if the library collection was not available. Thus, there would be an additional cost of about 250,000 hours of faculty time and $2.1 million. That is, access to the Pittsburgh library collections saves faculty about this amount of time (perhaps 125 full-time equivalent faculty) or an average of 5 percent of faculty member’s time and $2.1 million expenditure. This order of magnitude of return-an-investment has been observed in other libraries as well (Griffiths and King 1993). It is clear that one of the most important indicators of values added by library services is the saving of time (and effort) and money of users.
A similar saving in user time is observed with access to the library electronic collection. Here we compare the observed time spent obtaining articles from the library and
be about 15 minutes less per such reading by having access away from the library. Since faculty currently average 81 such readings, they save about 20 hours per year per person or a total of about 50,000 hours or, perhaps 20 to 25 full-time equivalent faculty
members. Thus, the library electronic collection not only provides a broadened range of journals, but also saves faculty and the university substantial faculty resources.
Conclusions
Evidence presented in this article indicates that faculty are reading more articles and library collections are the principal source of articles for the additional reading. Some of the increased library reading per faculty member is due to declining personal
subscriptions, which reading is replaced by reading from the library collections.
However, a much larger contribution to the increased use of library collections is due in part to the evidence that faculty, science faculty at least, read from nearly twice as many journals now than they did 25 years ago. A substantial portion of this reading is from an increase in articles identified by online searching, citations in other publications, etc. that require locating and obtaining the articles following identification. Libraries are an obvious source for readers to use in these circumstances and they become even more so with expanded electronic collections.
Journal articles are extensively read by University of Pittsburgh faculty and students and information provided by these articles is observed to be extremely useful and valuable. Most of the estimated 1.9 million article readings at Pittsburgh are by students (72%) but faculty individually read a great deal (about 215 article readings per year) and spend
substantial time reading these articles (118 hours per year). Presumably faculty would not spend this amount of time reading, if the information was not worth this effort. Evidence of the usefulness of this information is as follows:
• The significant purposesfor reading articles include primary
research, writing, teaching and continued learning.
• The information is often shown to be very important or absolutely
essential to achieving these purposes.
• Ways in which purposes of reading are affected include improving
result of research, teaching, etc., inspiring new thinking, saving time or other resources, etc.
• Amount of reading and productivity are positively correlated.
For example, reading and number of publications are related and reading saves time of faculty.
• Faculty who have received awards or other special recognition
for research or other contributions tend to read appreciably more articles than other faculty.
The library collections at Pittsburgh are extensively used by faculty (48% of their
reading) and students (75% of their reading). Of 1.3 million readings from the University library collections, four-fifths of this reading is by students, but faculty average about 110 readings per year from the library collections. Indicators of favorable outcomes from use of the library collections tend to be greater than use from other sources. For example:
• Readers tend to spend more time reading from library-provided
articles than those obtained from other sources; thereby, indicating greater value in what they are “willing to pay” for the information in their time.
• While purposes of reading is essentially the same for library and other
sources of reading, the importance of information read from the library collection is greater than that from other sources.
• Articles obtained from the library collection have a more
positive affect on faculty’s work.
• If there were no library collections, faculty indicate that it would
take them an average of 17 minutes and $2.10 to obtain needed information from elsewhere; recognizing that sometimes they would not bother getting the information.
• Across all reading, faculty would spend about 250,000
hours of their time and $2.1 million in purchases. Thus, having the library collections saves faculty and the University,
substantial time and expenditures that can be re-allocated to better use.
All library services tend to achieve favorable outcomes from use of the information provided and the ability to share the collections and other resources saves faculty and students an enormous amount of their time and expenditures.
Faculty and students at Pittsburgh have quickly adapted to electronic journals. In fact, well over half (63%) of reading is now from electronic versions for a total of 1.2 million such readings. Faculty are less than likely than students to use the electronic versions (about half of reading vs. two thirds for students) because they continue to subscribe to print versions of their personal subscriptions. In fact, only about ten percent of reading from personal subscriptions is from electronic format. On the other hand three-fourths of their reading from library collections is from electronic versions. Students also rely mostly on the electronic portion of the library collections (71% of reading from library collections). Perhaps the reason for this choice to use electronic library collections is the convenience of remote access to the electronic collection from readers’ office, home, etc. In fact, faculty are estimated to save about 15 minutes per reading by remote access compared with going to their library to read or get a copy of the article. While saving a
single faculty member only about 20 hours per year, over all 2,478 faculty members the saving projects to about 50,000 hours that can be re-allocated to more important activities thus yielding potential benefit to the University.
Unfortunately, we have not been able to demonstrate other improved outcomes from reading electronic versions of articles. This may be due to the fact that the information content of electronic versions is essentially the same as print versions. However, this may change as readers continue to broaden access to new journals and make more extensive use of innovative features such as backward and forward citation linking, links to numeric database and images, and electronic access to older articles.