University of Arkansas, Fayetteville
ScholarWorks@UARK
Theses and Dissertations12-2017
Performance Evaluation and Risk Management:
Time Series Bootstrap Analysis of the Mutual
Funds and Banking Sectors
Lifa Huang
University of Arkansas, Fayetteville
Follow this and additional works at:http://scholarworks.uark.edu/etd
Part of theFinance Commons, and theFinance and Financial Management Commons
This Dissertation is brought to you for free and open access by ScholarWorks@UARK. It has been accepted for inclusion in Theses and Dissertations by an authorized administrator of ScholarWorks@UARK. For more information, please [email protected], [email protected].
Recommended Citation
Huang, Lifa, "Performance Evaluation and Risk Management: Time Series Bootstrap Analysis of the Mutual Funds and Banking Sectors" (2017).Theses and Dissertations. 2527.
Performance Evaluation and Risk Management:
Time Series Bootstrap Analysis of the Mutual Funds and Banking Sectors
A dissertation submitted in partial fulfillment of the requirements for the degree of
Doctor of Philosophy in Business Administration with a concentration in Finance by
Lifa Huang Beijing Wuzi University Bachelor of Arts in Economics, 2003
University of Arkansas
Master of Business Administration, 2012 Southern Illinois University Master of Science in Finance, 2014
December 2017 University of Arkansas
This dissertation is approved for recommendation to the Graduate Council.
Dr. Timothy Yeager Dissertation Director
Dr. Wayne Lee Dr. Craig Rennie
Abstract
The Financial Services Modernization Act of 1999, also known as the Gramm–Leach–Bliley
Act (“Act”), repealed a regulatory proscription in the Glass–Steagall Act of 1933 that prohibited commercial bank holding companies (BHCs) from underwriting most bonds, equities, and insurance policies. After the passage of the Act in November 1999, BHCs that converted to financial holding companies (FHCs) were allowed to engage in securities underwriting without restrictions. The first paper examines whether the removal of barriers to securities underwriting had an adverse impact on the overall stability of the financial sector, and thereby, contributed indirectly to the financial crisis of 2008. The DCC-GARCH time series model is applied to simulate bank returns for estimating several systemic risk measures. Comparing FHCs with various matched samples of banking organizations, we
find an economically small increase in systemic risk at FHCs that resulted from the bank’s shift into
previously ineligible activities. However, we find an economically large increase in systemic risk at FHCs that results indirectly from their rapid growth in assets.
In the second paper, bootstrap simulations based on U.S. open-end actively-managed domestic bond mutual funds between 1999 and 2016 show benchmark-adjusted returns that more than cover costs. The top 10% of all bond mutual funds generate significant precision-adjusted alpha 𝑡(𝛼) from timing and selection. Results hold for government and corporate bond funds as well as across bond mutual funds stratified by assets under management (AUM). Timing is more important than selection, particularly in short 3-year horizons. Selection matters most for the largest bond mutual funds with AUM>$750M. The economic value (EV) from active management by the top 10% of bond mutual funds is 20 bps and 6.5 bps on AUM from timing and selection respectively. EV from timing of 37 bps is highest for the top 10% of corporate bond mutual funds, and from selection of 25 bps, is highest for the top 10% of bond mutual funds with AUM>$750M.
Table of Contents Introduction ... 1 Paper 1 ... 2 1.0 Introduction ... 2 2.0 Literature ... 4
3.0 Data and Summary Statistics ... 5
3.1 Distributions of Bank Size ... 6
3.2 Risks of Bank Equity Returns ... 8
4.0 Systemic Risk Measures ... 9
5.0 Hypotheses and Empirical Results ... 13
H1 ... 13 H2 ... 17 H3 ... 20 6.0 Conclusion ... 20 References ... 22 AppendixA ... 47 AppendixB ... 50 AppendixC ... 57
Paper 2 ... 60
1.0 Introduction ... 60
2.0 U.S. Bond Mutual Fund Manager Performance ... 63
2.1 Actively Managed Equity Mutual Funds ... 63
2.2 Cross-sectional Variation in Bond Mutual Fund Returns ... 64
3.0 Sample Selection and Data ... 65
3.1 Sample ... 65
3.2 Summary Statistics ... 67
3.3 Regression Framework ... 68
4.0 Bootstrap Approach ... 71
4.1 Distribution of Simulated vs. Actual t(α): All Bond Mutual Funds ... 72
4.2 Uncertainty about True α ... 74
4.3 Distribution of Simulated vs. Actual t(α): Asset Specialization and AUM ... 76
4.4 Distribution of t(α) for Simulated vs. Actual Bond Mutual Funds: 3-Year Horizons ... 78
4.5 Economic Value from Active Management ... 79
5.0 Concluding Remarks ... 80
References ... 82
Appendix ... 104
1
Introduction
Passage of the Financial Services Modernization Act, also known as the Gramm–Leach–Bliley Act (GLBA), allowed bank holding companies (BHCs) to become financial holding companies (FHCs). The deregulation allowed newly formed FHCs to engage in high-risk investment banking activities, such as securitization of risky bonds, trading of risky bonds and equity and underwriting of debt and equity issues; it also allowed FHCs to merge with investment banks, increasing the asset size of the FHCs. Moreover, the increased competition post-GLBA might erode charter value for investment banks (Keeley, 1990, AER), leading to greater risk-taking incentives. It has been a long debate on whether the GLBA should be repealed, and there is argument that the deregulation is a key factor caused the 2008 financial crisis. What was the impact of the Act on systemic risk in Financial Institutions? Did it contribute to the instability of the financial system leading up to the Financial Crisis? Applying DCC-GARCH model to construct systemic risk measure (SRISK), the first study examines the possible impact of the passage of the GLBA on systemic risk in banking sector. Whether mutual fund managers have economic contributions to the investors has been studied for decades, most of the researches focused on equity mutual funds, and the findings are mixed. Bond mutual funds on the other hand, attract less attention. The second study examines whether U.S. actively managed domestic bond mutual funds generate benchmark adjusted returns that exceed or at least cover their costs – i.e., do bond mutual fund managers exhibit skill, not just luck. Suppose fund managers exhibit skill, what kind of skill is more prominent? Security selection, market timing, or both? What is the economic value of their skill, if any? Are these patterns chiefly due to government, corporate, or both types of bond funds? Do government bond mutual funds with different average effective duration have different performance? Do corporate bond mutual funds with different average credit rating have different performance?
2 Paper 1:
The Impact of the Financial Services Modernization Act on the Systemic Risk of Financial Institutions Lifa Huang, Wayne Y. Lee, Timothy J. Yeager
University of Arkansas
1.0 Introduction
The Financial Services Modernization Act of 1999, also known as the Gramm–Leach–Bliley
Act (“Act”), repealed a regulatory proscription in the Glass–Steagall Act of 1933 that prohibited commercial bank holding companies (BHCs) without Section 20 exemptions from underwriting most bonds, equities, and insurance policies. After the passage of the Act at the end of 1999, commercial bank holding companies which converted to financial holding companies (FHCs) were allowed to engage in securities underwriting without restrictions. Deregulation allowed FHCs to diversify their activities and potentially improve profitability through economics of scope and scale. But the shift to debt funded securities underwriting away from long-established deposit based lending eroded charter value which encouraged greater risk taking by FHCs. This study examines whether the removal of barriers to securities underwriting had an adverse impact on the overall stability of the financial sector, and thereby, contributed indirectly to the financial crisis of 2008.
Our study focuses on changes in the systemic risk of commercial and investment banks subsequent to the passage of the Act. In particular, did the entry of FHCs heighten competition in securities underwriting, and as a result, the riskiness of investment banks? Compared to investment banks, were risk changes less significant for commercial banks that maintained their status as BHCs either with or without Section 20 exemptions, and more significant, for commercial banks that converted to FHCs? To answer the questions, we apply two versions of SRISK (based on SRISK from
3
Engle and Brownlees (2015)) as systemic risk measures: RISKMES and SRISKCoMES (both are defined in equation 11). We compute the measure in several ways: a) baseline SRISK using original total returns and original assets; b) Simulated SRISK using DCC-GARCH model simulated total returns (the simulated returns are based on original total returns, trading assets adjusted returns, or non-interest income adjusted returns, for different analysis) and original assets; and c) Simulated SRISK using DCC-GARCH model simulated total returns and hypothesized assets, the simulated returns again are based on original total returns, trading assets adjusted returns, or non-interest income adjusted returns, for different analysis. As robustness check we also used other proposed risk measures; ΔCoVaR (Adrian and Brunnermeier, 2014) as well as MES and CoMES (Acharya et al. 2010).
Specifically, we test the following three hypotheses. H1: After passage of the Act, FHCs expand their business into investment banking activities, leading to greater risk taking; H2: FHCs engaged in activities with greater systemic risk post-GLBA because regulatory restrictions were removed; and H3: Investment banks’ charter values decreased because of the increased competition. We use above mentioned different versions of SRISK as the main measure to test the first hypothesis. As robustness check, we compute risk measures such as VaR, CoVaR, CoVaR_mean, delta_CoVaR, ES, CoES, MES and CoMES (each risk measurement will be discussed with details in the following methodology section). We also compute several other measures such as TobinQ, Herfindahl-Hirschman Index (HHI), and rolling window market beta and adjusted R-squared from Carhart- 4 factor model. The period we exam is from 1993 to 2014.
Before the passage of the 1999 Act, there are three types of banks: 1) bank holding companies (BHCs), 2) bank holding companies with section-20 subsidiaries (S20s), and 3) investment banks (IBs). After the passage of the 1999 Act, there are five types of banks: 1) bank holding companies which do not expand their business into investment banking activities (BHC_BHC), 2) bank holding companies which expand their business into investment banking activities (BHC_FHC), 3) bank holding
4
companies with section-20 subsidiaries before 1999 and do not transfer into FHC after 1999 (S20_S20), 4) bank holding companies with section-20 subsidiaries before 1999 and transfer into FHC after 1999 (S20_FHC), and 5) investment banks (IB_IB).
For analysis reported in this paper we separate all banks into five groups: BHC_BHC, BHC_FHC, S20_S20, S20_FHC, and IB_IB. We also construct two-group and three-group samples to exam the hypotheses from different aspects (results are not reported in the paper). In the two two-group sample we separate all banks into the following two two-groups: commercial banks (CBs, include all banks except investment banks) and investment banks (IBs). The three-group sample includes: BHC_BHC (banks that do not expand business into investment banking actives before and after the Act), BHC_FHC and S20_FHC (this group is denoted as S20&FHC, it includes banks that expand business into investment banking actives after the Act, and before the Act they are either BHCs or S20s), and IBs.
Our study provides evidence that after the passage of the Act, commercial banks that engage in investment bank activities become risker in terms of the systemic risk we measured (especially, baseline SRISK, SRISK with GARCH simulation on stock return, and SRISK with DCC-GARCH simulation on stock return and hypothesized FHCs’ book and market value which grew at the value-weighted growth rate of top 19 BHC_BHCs in each year), and the increasing risk taking is concurrence with the increasing investment activities among those banks, especially S20_FHC banks.
Profitability (measured as Tobin’s Q) on average does not decrease among investment banks due to the competition from commercial banks.
2.0 Literature
Prior research on the impact of the Act focused on profitability and risk changes of banks surrounding the passage of the Act. Yeager, Yeager and Harshman (2005) find no strong evidence that FHCs attained significant benefits immediately following the passage of the Act. Stiroh and
5
Rumble (2006) conclude that diversification benefits among FHCs were more than offset by increased exposure to risky non-interest activities. Estimating equity return variance (total risk) and beta (systematic risk) in the 300 trading days around the passage of the Act, Akhigbe and Whyte (2004) showed that total and unsystematic risks of banks and insurance companies increased, but decreased for investment banks, following passage of the Act.
Using SRISK measures proposed by Brownlees and Engle (2015) to capture capital shortfalls, as well as equity tail risks proposed by Acharya, Engle and Richardson (2012) to capture systemic risk in the financial sector, but not changes in systemic risks prior and subsequent to the passage of the Act.
Our study in this paper apply several systemic risk measurements, or tail risk of the stock returns and capital shortfall for different groups of banks; more important, we focus on the systemic risk measure of SRISK (with baseline approach and DCC-GARCH simulation approach). The passage of the Act has short-term impact; meanwhile it might take longer time to exhibit its full impact on the financial sector, since not all banks expand their business at the same time and the effect of changing business activities takes time to observe. We use a longer time horizon with the hope to capture long-term impact of the passage of the Act.
3.0 Data and Summary Statistics
Commercial and investment bank samples span the period January 1993 to December 2014. A CRSP-FRB link file from the New York Fed is used to construct a complete sample of commercial banks that are publicly traded over the sample period. Daily stock returns are obtained from CRSP
using PERMCO numbers, and quarterly financial data from FR-Y9C using RSSD numbers. Sample of investment banks is constructed using SIC code 6211 eliminating any overlaps with the commercial bank sample. Daily stock returns are obtained from CRSP and quarterly financial data from
6
and book equity are manually collected from SEC filings. Data on subprime mortgage backed security holdings of BHCs are compiled from SDA database.
Monthly percentage changes in the KBWNASDAQ Bank Index obtained from Yahoo Finance are used to proxy for a common market factor in bank equity returns.1 Monthly Moody's Seasoned Aaa and Baa corporate bond yields are obtained from the St. Louis Fed database.
We manually adjusted our samples for notable mergers and acquisitions by commercial banks and conversions of investment banks to FHCs. For example, Citigroup merged with Traveler Insurance in December 31, 1998. Prior to the merger, Traveler Insurance is classified as an S20 exempted BHC with RSSD 1042351. Subsequent to the merger, Traveler Insurance is classified as an FHC with RSSD 1951350. Similarly, Goldman Sachs and Morgan Stanley are classified as investment banks prior to 2008, but as FHCs subsequently.
Samples of commercial and investment banks are classified into one of five groups depending on whether or their status remained the same or changed subsequent to the passage of the Act. BHC_BHC are commercial banks that never engaged in securities underwriting. BHC_FHC are commercial banks that did not have an S20 exemption prior to but converted to an FHC after the passage of the Act. S20_S20 and S20_FHC are commercial banks that had S20 exemptions prior to and either did or did not convert into FHCs after the passage of the Act. Average quarterly count and number of bank-quarter observations as well annual average of quarter counts in each group are reported in Table 1.
< Insert Table 1 here.> 3.1 Distributions of Bank Size
The passage of the Act had no significant impact on the activities of the preponderance of
7
commercial banks which remained as BHCs. The majority of the conversions to FHCs were BHCs. Only a few commercial banks with S20 exemptions converted to FHCs. Following the 2008 financial crisis, a small number of investment banks converted to FHCs.
To evaluate the impact of the passage of the Act on the size distribution of commercial and investment banks in each of the five groups, we use market values of equity (𝑀𝑉𝐸𝑖) to calculate a Herfindahl-Hirschman Index (HHI) each quarter.
𝐻𝐻𝐼 = 𝑁 ∙ ∑ ( 𝑀𝑉𝐸𝑖
∑𝑁𝑖=1𝑀𝑉𝐸𝑖 )
2 𝑁
𝑖=1 (1)
HHI has a minimum value of 1 when the distribution of bank size within the group is uniform and rises in value as the disparity in sizes within the group increases. Figures 1 graphs quarterly HHIs averaged each year.
< Insert Figure 1 here.>
Although small in number, concentration is consistently high in the IB_IB group which are dominated by a few large bulge bracket investment banks. As shown in Table 2, the average equity market values of investment banks declined in the years immediately following the passage of the Act presumably from increased competition by FHCs. The contemporaneous fall in concentration suggests, however, that the adverse impact of competition did not fall equally among investment banks. Heighted competition was more acute for investment banks with higher growth opportunities.
< Insert Table 2 here.>
Not surprisingly, disparities in the size are also high in the BHC_BHC group with the largest number of commercial banks. Although there was no notable change in average equity market values following the passage of the Act, there was a significant rise in concentration concomitant with an
8
increase in the number of BHCs. It appears the Act spurred the entry of smaller commercial banks. Commercial banks with S20 exemptions are the least concentrated group. The members of this group tend to be large BHCs that are similar in asset size. Although there were no important changes in average equity market values for BHCs that converted into FHCs following the passage of the Act, the large changes in concentration particularly for the BHC_FHC group suggests there were winners and losers. Not all of the banks benefitted equally from the removal of barriers to securities underwriting.
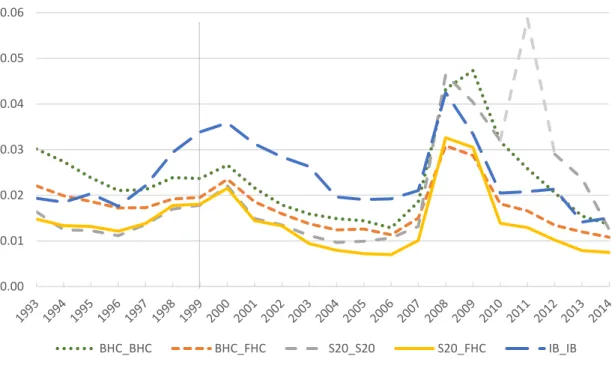
3.2 Risks of Bank Equity Returns
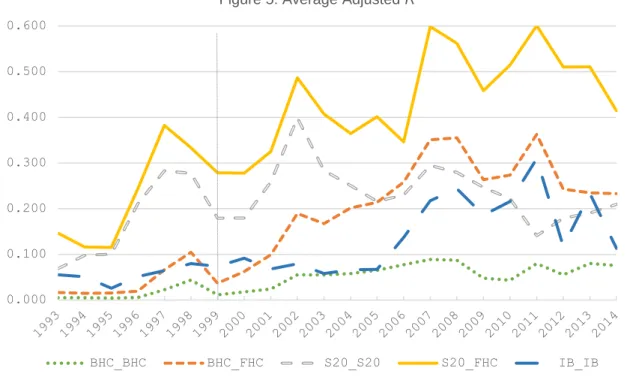
Each year, daily equity returns over three-month rolling windows with one-month overlaps are used to estimate an excess returns model using the three Fama-French (1993) plus Carhart (1995) momentum factors. Estimated total risks, excess market return betas, idiosyncratic residual risks, as well as excess return model R2s are averaged across all three-month rolling windows each year. The annual averages for each group of banks are graphed in Figures 2 through 5.
< Insert Figures 2 and 3 here.>
Total and idiosyncratic residual risks of investment banks rose and are highest with increased competition in securities underwriting from FHCs following the passage of the Act. Compared to commercial banks that remained as BHCs, commercial banks that converted to FHCs following the passage of the Act have lower the total and idiosyncratic residual risks. The reduction in equity risks from diversification is similar across the two groups, S20_FHC and BHC_FHC. Commercial banks that maintained their S20 exemptions also exhibit comparable reductions in equity risk, but equity risks remain elevated three years after the 2008 financial crisis. Interestingly, the reduction in equity risk is highest for FHCs following the 2008 financial crisis. Perhaps because FHCs benefitted most from TARP capital infusion and Fed QE liquidity programs in the crisis period as well as increased
9
capital requirements and constraints on proprietary trading post crisis. < Insert Figure 4 here.>
Reductions in risk from diversification come at a price. Securities underwriting activities are sensitive to changes in market conditions. As expected, commercial banks that remained BHCs have the lowest market return betas. Relative to investment banks, market return betas for commercial banks with S20 exemptions, S20_S20 and S20_FHC, are notably higher prior to the passage of the Act, but converged following the passage of the Act. The increase in market return betas is most dramatic for commercial banks that converted into FHCs following the passage of the Act.
< Insert Figure 5 here.>
The correlation in equity returns is lowest for commercial banks that remained BHCs. Commercial banks in this group are smaller and more similar in size. Correlations for commercial banks with S20 exemptions that converted to FHCs following the passage of the Act are highest. The sharp rise following the passage of the Act presaged the 2008 financial crisis and remains elevated.
4.0 Systemic Risk Measures
For completeness, we considered all of the alternative measures of systemic risks proposed in the literature. But for brevity, we focus our reported results on capital shortfall risk measures.
a. 𝑽𝒂𝑹∝𝒊
𝑃𝑟𝑜𝑏(𝑅𝑖 ≤ −𝑉𝑎𝑅
𝛼𝑖) = 𝛼% (1)
is a value-at-risk measure. 𝑅𝑖~𝑁(𝜇
𝑖, 𝜎𝑖2) denotes the equity return of bank i, and 𝑉𝑎𝑅𝛼𝑖 , a
(non-negative) critical value of equity return that defines a threshold probability of 𝛼% that 𝑅𝑖 ≤ 𝑉𝑎𝑅 𝛼𝑖
10 b. 𝑪𝒐𝑽𝒂𝑹∝𝒊 and ∆𝑪𝒐𝑽𝒂𝑹∝𝒊 𝑃𝑟𝑜𝑏 (𝑅𝑖 ≤ 𝐶𝑜𝑉𝑎𝑅 𝛼𝑖|𝐶(𝑅 𝑚) |𝐶(𝑅𝑚) = 𝛼% (2)
is a relative value-at-risk proposed by Adrian and Brunnermeier (2014). 𝑅𝑚~𝑁(𝜇
𝑚, 𝜎𝑚2) denotes the
returns on a reference benchmark. 𝐶(𝑅𝑚) = −𝑉𝑎𝑅𝑚 is a (negative) lower bound on a reference
benchmark and 𝐶𝑜𝑉𝑎𝑅𝛼𝑖|𝐶(𝑅𝑚) is a critical value conditional on 𝐶(𝑅𝑚) that defines a threshold
probability of 𝛼% that 𝑅𝑖 ≤ 𝐶𝑜𝑉𝑎𝑅 𝛼𝑖|𝐶(𝑅
𝑚)
. Bank and reference benchmark returns are assumed to be collinear. 𝑅𝑖 = 𝐸(𝑅𝑖|𝑅𝑚) + 𝜀
𝑖 and 𝜎𝜀2 = (1 − 𝜌𝑖𝑚2 )𝜎𝑖2 where 𝜌𝑖𝑗 denotes the correlation
between bank and reference benchmark returns. The measure, which reflects the idiosyncratic and
systematic risks of the bank’s equity return and the likelihood that the bank’s return will fall below a
lower bound on the reference benchmark, captures a bank’s exposure to system wide distress.
∆𝐶𝑜𝑉𝑎𝑅∝𝑖 is used to evaluate the difference in value-at-risks when conditions are normal and
when conditions are either good or bad. Following Ergun and Girardi (2013), we define 𝑅𝑚 as a
market return and 𝐶(𝑅𝑚) = −𝑉𝑎𝑅
𝛼𝑚 as the lower bound market return under normal conditions.
From Adrian and Brunnermeier (2014)
∆𝐶𝑜𝑉𝑎𝑅𝛼𝑖|𝑚 = 𝐶𝑜𝑉𝑎𝑅𝛼𝑖|𝐶(𝑅𝑚)=−𝑉𝑎𝑅𝛼𝑚− 𝐶𝑜𝑉𝑎𝑅
𝛼𝑖|𝐶(𝑅
𝑚)∈[𝜇
𝑚±𝜎𝑚] (3) In (3), 𝐶(𝑅𝑚) ∈ [𝜇
𝑚± 𝜎𝑚] denote the lower bound market returns corresponding to good and bad
market conditions; i.e. values of −𝑉𝑎𝑅𝛼𝑚 when 𝜇𝑚+ 𝜎𝑚 and 𝜇𝑚− 𝜎𝑚 .
c. 𝑬𝑺 and 𝑴𝑬𝑺
Expected shortfall is the conditional mean equity return when equity returns fall below a lower bound.
11 𝐸𝑆𝑖 = 𝐸(𝑅𝑖|𝑅𝑖 ≤ −𝑉𝑎𝑅
𝛼𝑖) (4)
and when bank and reference benchmark returns are assumed to be collinear. 𝑅𝑖 = 𝐸(𝑅𝑖|𝑅𝑚) + 𝜀 𝑖,
𝐶𝑜𝐸𝑆𝑖 = 𝐸(𝑅𝑖|𝑅𝑚 ≤ −𝑉𝑎𝑅 𝛼
𝑚) (5)
These measures capture downside loss when bank returns fall below a lower bound. d. 𝑴𝑬𝑺 and 𝑪𝒐𝑴𝑬𝑺
At the aggregate level, 𝑀𝐸𝑆 defines the marginal contribution of a bank to the expected shortfall on a portfolio that consists of a group of banks.
Define 𝑅𝑝 = ∑ 𝑤 𝑖𝑅𝑖
𝑖 ~𝑁(Σ𝑖𝑤𝑖𝜇𝑖, Σ𝑖Σ𝑗𝑤𝑖𝑤𝑗𝜎𝑖𝑗) as the portfolio return.
𝐸𝑆𝑝 = 𝐸(𝑅𝑝|𝑅𝑝 ≤ −𝑉𝑎𝑅
𝛼𝑝) (6)
and from Scaillet (2004), 𝜕𝐸𝑆𝑝/𝜕𝑤
𝑖 = 𝜕𝐸(𝑅𝑝|𝑅𝑝≤ −𝑉𝑎𝑅𝛼𝑝)/𝜕𝑤𝑖 (7)
Similarly, when bank and reference benchmark returns are assumed to be collinear. 𝑅𝑖 =
𝐸(𝑅𝑖|𝑅𝑚) + 𝜀 𝑖, 𝑀𝐸𝑆𝑝 = 𝐸(𝑅𝑝|𝑅𝑝 ≤ −𝑉𝑎𝑅 𝛼𝑗) (8) and / ( | )/ ( | ) p p p m i i p m i MES w E R R VaR w E R R VaR (9) e. 𝑺𝑹𝑰𝑺𝑲
This measure extends the 𝑀𝐸𝑆 approach by taking into account a bank’s liabilities as well equity market value in determining equity shortfalls. Conditional on a shock to the financial system, Acharya, Engle and Richardson (2012) define 𝑆𝑅𝐼𝑆𝐾 as:
12 𝑆𝑅𝐼𝑆𝐾𝑖,𝑡 = max [0; 𝑘 (𝐷⏞ 𝑖,𝑡+ (1 + 𝐿𝑅𝑀𝐸𝑆𝑖,𝑡+ℎ)𝐸𝑖,𝑡) 𝑅𝑒𝑞𝑢𝑖𝑟𝑒𝑑 𝐶𝑎𝑝𝑖𝑡𝑎𝑙 − (1 + 𝐿𝑅𝑀𝐸𝑆⏞ 𝑖,𝑡+ℎ)𝐸𝑖,𝑡) 𝐴𝑣𝑎𝑖𝑙𝑎𝑏𝑙𝑒 𝐶𝑎𝑝𝑖𝑡𝑎𝑙 ⏟ 𝐶𝑎𝑝𝑖𝑡𝑎𝑙 𝑆ℎ𝑜𝑟𝑡𝑓𝑎𝑙𝑙 (𝐶𝑆) ] (10) where 𝑘 is the minimum fraction of capital each firm needs to hold; 𝐷𝑖,𝑡 and 𝐸𝑖,𝑡 are the book value
of total liability and market value of equity, respectively. From (9), 𝐿𝑅𝑀𝐸𝑆𝑖,𝑡+ℎ is the long-run marginal expected shortfall over a horizon of period length ℎ. Banks with the largest capital shortfall will contribute the most to financial instability, and are banks that will be considered systemically risky.
We define 𝐿𝑅𝑀𝐸𝑆 as
𝐿𝑅𝑀𝐸𝑆𝑖,𝑡+ℎ = − 𝐸𝑡(𝑅𝑖,𝑡+ℎ|𝑡 |𝑅𝑖,𝑡 < 𝐶) (11)
where 𝐶 denotes a lower bound value which is defined in two ways. In 𝑆𝑅𝐼𝑆𝐾𝑀𝐸𝑆 , 𝐶 =
[𝑘𝐷𝑡+ (1 + 𝑘)𝐸𝑡] 𝐸⁄ 𝑡 is the lower bound on a bank’s equity return that will result in a zero-capital
shortfall. In 𝑆𝑅𝐼𝑆𝐾𝐶𝑜𝑀𝐸𝑆 , 𝐶 = −𝑉𝑎𝑅
𝛼𝑚 and −𝑉𝑎𝑅𝛼𝑚 is defined by
𝑃𝑟𝑜𝑏(𝑅𝑡+ℎ𝑚 ≤ −𝑉𝑎𝑅
𝛼𝑚) = 𝛼% (12)
The derivation of 𝑆𝑅𝐼𝑆𝐾 is presented in Appendix A.
As in Brownlees and Engle (2015) and Acharya, Engle and Richardson (2012), we use the book value of total liability on the assumption that during the financial crisis, liability is not negotiable. Banks with insufficient capital will not be able to provide liquidity to troubled firms under unstable market conditions. Further, note that 𝑆𝑅𝐼𝑆𝐾 increases with the leverage.
Acharya, Engle and Richardson (2012) compute 𝐿𝑅𝑀𝐸𝑆 as the loss a bank experiences when the market falls by more than 40% over a six-month horizon. Daily 𝑀𝐸𝑆𝑖𝑡 with 𝐶 set equal to 2% and approximate 𝐿𝑅𝑀𝐸𝑆𝑖𝑡 ≈ 1 − 𝑒𝑥𝑝(18 ∙ 𝑀𝐸𝑆𝑖𝑡). Brownlees and Engle (2015) apply three different approaches to estimate 𝐿𝑅𝑀𝐸𝑆 but main results rely on a GARCH-DCC model with simulation.
13
three different ways. The first or baseline 𝑆𝑅𝐼𝑆𝐾 uses historical data without simulation; the second uses a DCC-GARCH simulation described in Engle (2015); and the third, a DCC-GARCH simulation
described in Engle (2015) with the added assumption that a bank’s book and market equity value
grows at the value-weighted growth rate of the top 19 BHC_BHCs each year. Quarterly values are averaged to calculate annual values.
For each bank, we use its book value of total assets and equity market values in 1992Q4 as starting values. Growth rates in total assets are computed as the weighted average quarterly growth rate in total assets of the top 19 BHC_BHCs each year using book values as weights. Similarly, growth rates in equity market value are computed as the weighted average quarterly growth rate in equity market value of the top 19 BHC_BHCs each year using equity market values as weights. Changes in leverage are computed as the weighted average of the quarterly leverage ratios of the top 19 BHC_BHCs each year.
𝑆𝑅𝐼𝑆𝐾 calculated for each bank and summed across banks to obtain an aggregate capital shortage. The aggregate capital shortage can be interpreted as the funding amount the government must be ready to provide to bail out failed banks. We also calculate 𝑆𝑅𝐼𝑆𝐾/𝑀𝑉𝐸for each bank scaled by its equity market value and totaled across banks to establish an aggregate value.
5.0 Hypotheses and Empirical Results
H1: Following the passage of the Act, the expansion of financial holding companies into investment banking activities led to greater risk taking.
To test this hypothesis, we compute summary statistics for changes in systemic risk measures through time by bank type. The reported results are for risk measure 𝑆𝑅𝐼𝑆𝐾𝑀𝐸𝑆, which defines the
𝐿𝑅𝑀𝐸𝑆 as the lower bound return that results in a capital loss. Results for 𝑆𝑅𝐼𝑆𝐾𝐶𝑜𝑀𝐸𝑆 are similar
14
< Insert Figure 6 here.>
Figure 5A shows, as expected, for BHCs that did not convert into FHCs, there is no meaningful change in the 𝑆𝑅𝐼𝑆𝐾𝑀𝐸𝑆 following the passage of the Act. Heighted competition from
FHCs, however, increased the 𝑆𝑅𝐼𝑆𝐾𝑀𝐸𝑆 of investment banks significantly. The 𝑆𝑅𝐼𝑆𝐾𝑀𝐸𝑆 of
BHCs that converted into FHCs and significantly expanded their securities underwriting business also posted an increase. The increase in 𝑆𝑅𝐼𝑆𝐾𝑀𝐸𝑆 is foremost for the S20_FHC group which are the
largest commercial banks; surpassing the increase for investment banks. Interestingly, investment banks exhibit the greatest decline in 𝑆𝑅𝐼𝑆𝐾𝑀𝐸𝑆 following the 2008 financial crisis. In contrast, the
decline in 𝑆𝑅𝐼𝑆𝐾𝑀𝐸𝑆 was relatively small for the S20_FHC group following the 2008 financial crisis,
and continued to rise significantly after. 𝑆𝑅𝐼𝑆𝐾𝑀𝐸𝑆 is highest for the S20_FHC group.
Figure 5B shows that the shares of aggregate 𝑆𝑅𝐼𝑆𝐾𝑀𝐸𝑆 for BHCs that did not convert into
FHCs declined following the passage of the Act. Heighted competition by FHCs diminished the investment bank group share of aggregate 𝑆𝑅𝐼𝑆𝐾𝑀𝐸𝑆. In contrast, the shares of aggregate 𝑆𝑅𝐼𝑆𝐾𝑀𝐸𝑆
of BHCs that converted into FHCs and significantly expanded their securities underwriting business posted increases. The increase in share of aggregate 𝑆𝑅𝐼𝑆𝐾𝑀𝐸𝑆 is foremost for the S20_FHC group
which are the largest commercial banks; surpassing the share for investment banks. Following the 2008 financial crisis, the share of aggregate 𝑆𝑅𝐼𝑆𝐾𝑀𝐸𝑆 decreased for investment banks but recovered
in subsequent years. But the share of aggregate 𝑆𝑅𝐼𝑆𝐾𝑀𝐸𝑆 increased dramatically for S20_FHCs and
remains elevated.
< Insert Figure 7 here.>
𝑆𝑅𝐼𝑆𝐾𝑀𝐸𝑆for the four largest S20_FHC banks and five largest IB_IB investment banks are
15
BHCs, Citigroup had the largest increase; Wells Fargo, the smallest. Among investment banks, Merrill Lynch and Morgan Stanley had the highest increase in systemic risk. Interestingly, the two investment banks, Bear Stearns and Lehman Brothers, that failed actually had the lowest increase in systemic risk. Systemic risk fell in the 2008 financial crisis only to rise in the years following the bailout. Systemic risk remains elevated.
< Insert Table 3 here.>
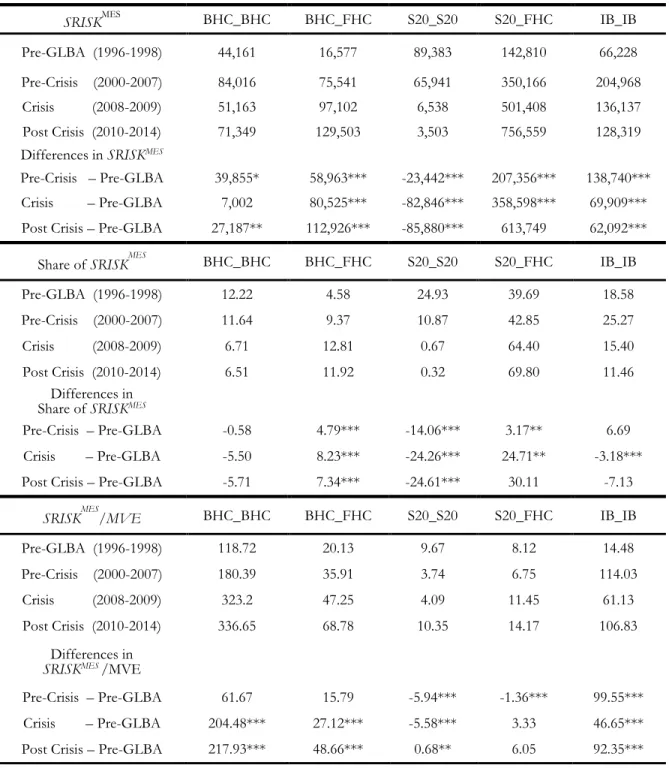
Table 3 reports average 𝑆𝑅𝐼𝑆𝐾𝑀𝐸𝑆and average share of aggregate 𝑆𝑅𝐼𝑆𝐾𝑀𝐸𝑆for selected
periods by bank type. Differences in average 𝑆𝑅𝐼𝑆𝐾𝑀𝐸𝑆 and average share of aggregate
𝑆𝑅𝐼𝑆𝐾𝑀𝐸𝑆reflect changes in systemic risks from the period prior to the passage of the Act to the: (i)
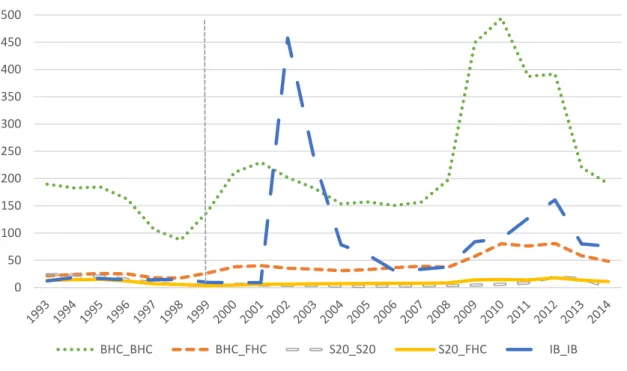
period following the passage of the Act; (ii) crisis period; and (iii) post crisis period. < Insert Figure 8 here.>
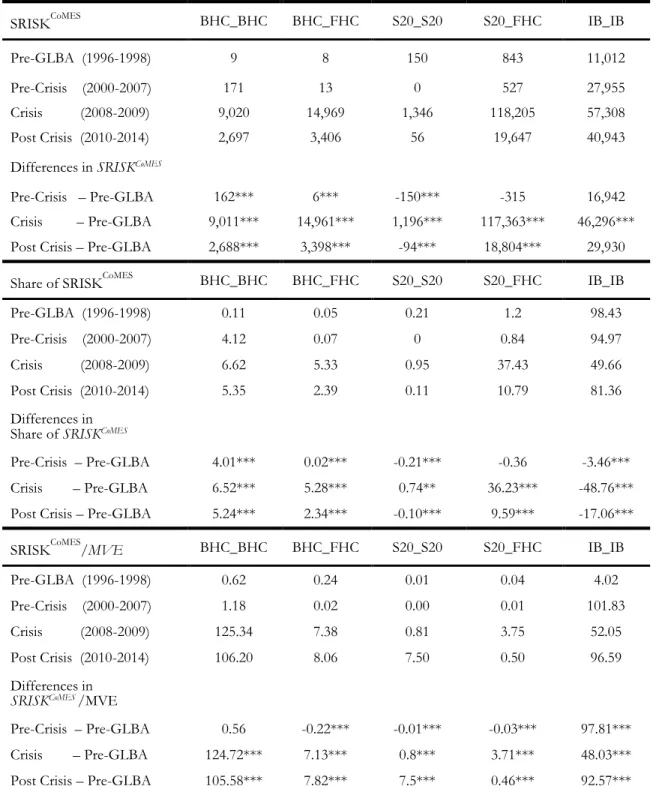
From Figure 8 to Figure 10 we apply the baseline and DCC-GARCH simulated 𝑆𝑅𝐼𝑆𝐾𝐶𝑜𝑀𝐸𝑆
for groups of banks and individual banks, and Table 4 reports average baseline 𝑆𝑅𝐼𝑆𝐾𝐶𝑜𝑀𝐸𝑆and
average share of aggregate 𝑆𝑅𝐼𝑆𝐾𝐶𝑜𝑀𝐸𝑆for selected periods by bank type ( Differences in average
𝑆𝑅𝐼𝑆𝐾𝐶𝑜𝑀𝐸𝑆and average share of aggregate 𝑆𝑅𝐼𝑆𝐾𝐶𝑜𝑀𝐸𝑆reflect changes in systemic risks from the
period prior to the passage of the Act to the: (i) period following the passage of the Act; (ii) crisis period; and (iii) post crisis period). Figure 8A graphs total baseline 𝑆𝑅𝐼𝑆𝐾𝐶𝑜𝑀𝐸𝑆 in millions of USD
by bank type and year. In each quarter, baseline 𝑆𝑅𝐼𝑆𝐾𝐶𝑜𝑀𝐸𝑆 is computed for each bank and summed
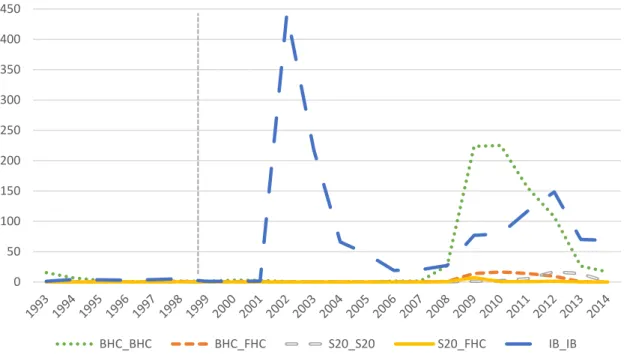
across banks to obtain group totals. In Figure 8B, Group totals are summed to obtain the quarterly aggregate amount which is used to scale group totals to calculate group shares of 𝑆𝑅𝐼𝑆𝐾𝐶𝑜𝑀𝐸𝑆.
Quarterly shares of each group are averaged to obtain annual shares. In Figure 8C, quarterly 𝑆𝑅𝐼𝑆𝐾𝐶𝑜𝑀𝐸𝑆 is scaled by the market value of equity (MVE) for each bank. Quarterly values are
16
group is averaged to calculate annual averages. In Figure 8A we observe that S20_FHC group experienced the highest 𝑆𝑅𝐼𝑆𝐾𝐶𝑜𝑀𝐸𝑆increase during 2008 financial crisis and remained high for
around three years post crisis, while BHC_BHC and BHC_FHC also exhibited systemic risk increase during the 2008 crisis period, their increasing was much smaller compared with that of S20_FHC group. It is not surprising to see that during the crisis BHC_FHC had higher risk increase than BHC_BHC, the latter have less exposure to risker investment banking activities. For most of the time, Investment banks had higher risk exposure than all other banks, and their risk started to increase since 2001, peaked and drop earlier than all commercial banks during 2008 financial crisis, while also remain high after the crisis. In Figure 8B the pattern shows that, investment banks managed to act earlier than commercial banks, either based on their experience or because they were more closely monitor the market through daily operation. In terms of the share of total 𝑆𝑅𝐼𝑆𝐾𝐶𝑜𝑀𝐸𝑆, investment banks took
up the biggest share throughout the time examined, except during 2008 crisis when almost all commercial banks experienced great increasing in the risk, with S20_FHC had the greatest share of risk and remained high post crisis. In Figure 8C 𝑆𝑅𝐼𝑆𝐾𝐶𝑜𝑀𝐸𝑆is scaled by market value of equity,
investment banks had the highest risk per unit of market value. The scaled 𝑆𝑅𝐼𝑆𝐾𝐶𝑜𝑀𝐸𝑆 should be
interpreted with caution, because total dollar amount of SRISK matters more in the event when government is expected to provide liquidity to the market.
< Insert Figure 9 here.>
In Figure 9 and 10 we look closely on selected individual banks, which are also covered in the 2009 Supervisory Capital Assessment Program. All three measures (baseline 𝑆𝑅𝐼𝑆𝐾𝐶𝑜𝑀𝐸𝑆,
DCC-GARCH simulated 𝑆𝑅𝐼𝑆𝐾𝐶𝑜𝑀𝐸𝑆 and DCC-GARCH simulated 𝑆𝑅𝐼𝑆𝐾𝐶𝑜𝑀𝐸𝑆scaled by market value
of equity) show the similar conclusion that big banks such as Citi Group, Bank of America, JPMorgan Chase, Wells Fargo and Morgan Stanley are institutions with the highest systemic risk exposure during 2008 financial crisis and remain high post crisis. An interesting finding is that Lehman Brothers and
17
Bear Stearns exhibited much higher systemic risk exposure long before the 2008 financial crisis. The pattern is stronger under DCC-GARCH simulated 𝑆𝑅𝐼𝑆𝐾𝐶𝑜𝑀𝐸𝑆 approach and even more prominent
under the measure scaled by market value of equity. The finding here provides some evidence that the DCC-GARCH based forecasting technique has some power in predicting troublesome institutions by using past one quarter (or one month) daily returns to simulate next quarter (or next month) daily returns.
< Insert Figure 10 here.>
Overall, the above discussions show some evidences that after the passage of the Act, banks that became financial holding companies (S20_FHC and BHC_FHC) experience increasing systemic risk exposure. The period average by type and the difference among the period average reported in Table 4 shows the consistency of our findings.
< Insert Table 4 here.>
Moreover, we run two robustness checks for our SRISK computation, which are summarized in Appendix B. In the first check (Figure B1.a, Figure B1.b), we compare our monthly baseline 𝑆𝑅𝐼𝑆𝐾𝐶𝑜𝑀𝐸𝑆estimation with monthly 𝑆𝑅𝐼𝑆𝐾𝐶𝑜𝑀𝐸𝑆provided by VLAB NYU; In the second check
(Table B2.a, Table B2.b), we compare our SRISK estimation with SCAP estimated firm level loss. The SRISK measure is sensitive to the threshold value applied. Over all our results are consistent across different approaches. Next, we turn to the second hypothesis.
H2: FHCs engaged in activities with greater systemic risk post-GLBA because regulatory restrictions were removed.
To test this hypothesis, we compare SRISK (with varied adjustments) for selected BHCs and FHCs (Figure 11A, 11B, 11C). We also compute summary statistics for changes in noninterest income and trading assets through time by firm type (Table 5, Figure 12A, 12B). Moreover, as robustness check we run regression on firm type and time periods to test the change of trading assets and
18
noninterest income (results not reported, consistent with results from summary statistics). < Insert Figure 11 here.>
In Figure 11A, we first select 19 BHC_BHC banks with the highest market value of equity in each quarter, next compute the baseline 𝑆𝑅𝐼𝑆𝐾𝐶𝑜𝑀𝐸𝑆for each bank for each quarter, then sum up 19 banks’ 𝑆𝑅𝐼𝑆𝐾𝐶𝑜𝑀𝐸𝑆 within a quarter; For BHC19 group we do not use DCC-GARCH simulated total
returns because the top 19 BHCs are different in different years (however, 19 FHCs are the same in each year, the list is in Appendix C Table C4.). For FHC19 groups, we compute two different versions of simulated 𝑆𝑅𝐼𝑆𝐾𝐶𝑜𝑀𝐸𝑆: 1) using DCC-GARCH simulated total returns and original market value
of equity and book liability and 2) using DCC-GARCH simulated total returns and hypothesized market value of equity and book liability. 𝑆𝑅𝐼𝑆𝐾𝐶𝑜𝑀𝐸𝑆 is computed at bank level for each quarter
then sum up across all 19 FHC banks. To compute hypothesized market value of equity and book liability, we use book total assets and market equity of 1999 Q4 as the starting value for the selected 19 FHCs, and we assume that the selected FHCs’ book total assets grow at the weighted average (BHC_BHCs’ book total assets as the weight) quarterly growth rate of yearly top 19 BHC_BHCs’ book total assets, that the selected FHCs’ market equity grows at the weighted average (BHC_BHCs’ market equity as the weight) quarterly growth rate of yearly top 19 BHC_BHCs’ market equity, and
that the leverage ratio (book total liability to book total assets, for computing hypothesized book total
liability) is weighted average (BHC_BHCs’ book total assets as the weight) quarterly leverage ratio of yearly top 19 BHC_BHCs. Not surprising to see that BHC19 has the lowest risk. Comparing the two results for FHC19, we observe that if FHCs grow at the growth rate of top BHCs, they will have much lower systemic risk exposure even during 2008 financial crisis, and their risk will remain low post crisis. This provides some evidence that high growth rate in FHCs drive up their systemic risk exposure during and post 2008 financial crisis.
19
banks. All 19 FHC banks are the same in each year. We compute three different versions of simulated 𝑆𝑅𝐼𝑆𝐾𝐶𝑜𝑀𝐸𝑆 by using: 1) DCC-GARCH simulated total returns (original total returns as simulation
inputs) and original market value of equity and book liability, 2) DCC-GARCH simulated total returns (log-trading-assets-adjusted total returns as simulation inputs) and original market value of equity and book liability and 3) DCC-GARCH simulated total returns (log-noninterest-income-adjusted total returns as simulation inputs) and original market value of equity and book liability. 𝑆𝑅𝐼𝑆𝐾𝐶𝑜𝑀𝐸𝑆 is
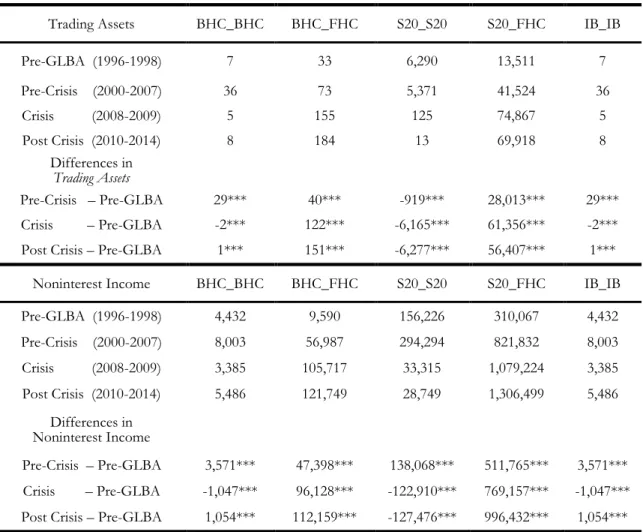
computed at bank level for each quarter then sum up across all 19 FHC banks. The result shows that trading assets and noninterest income have little influence on the systemic risk shifting. Compared with the results from Figure 11A, we show some evidence that high growth rate in FHCs has greater influence on their systemic risk exposure than does the investment banking activities those banks undertaking. As robustness check, in Figure 11C we conduct the similar analysis as in Figure 11B except that we also assume that FHCs grow at top BHCs’ growth rate. The results are consistent. Take one step further, we plot the change of trading assets and noninterest income through time. Figure 12A shows the yearly average of trading assets at firm level by type. S20_FHC show the rapid expansion in trading amount after 1999, and dominate the market since then. Figure 12B shows the yearly average of noninterest income at firm level by type, both S20_FHC and BHC_FHC experience increasing dollar amount in noninterest income. However, during the 2008 financial crisis, S20_FHC noninterest income drop sharply. Summary statistics in Table 5 reconciles with the results in Figure 12A and 12B by showing that both S20_FHC and BHC_FHC increase trading assets and noninterest income after the passage of the Act.
< Insert Table 5 here.>
Analysis for H2 shows that after the passage of the Act, banks which choose to become financial holding companies increase their trading assets and noninterest income, and those banks also show higher systemic risk exposure according to different measures. However, the results for the H2 should
20
be interpreted with caution. As we can see from Figure 11A, 11B and 11C, the trading assets adjusted or noninterest income adjusted SRISK is very close to baseline SRISK which is not adjusted from the effect of trading assets or noninterest income; on the other hand, the SRISK with the hypothesized market equity and book liability is significantly different from baseline SRISK. We find some evidence that it is the size of banks that matters more than does the trading or noninterest income on the systemic risk shifting in banking sector.
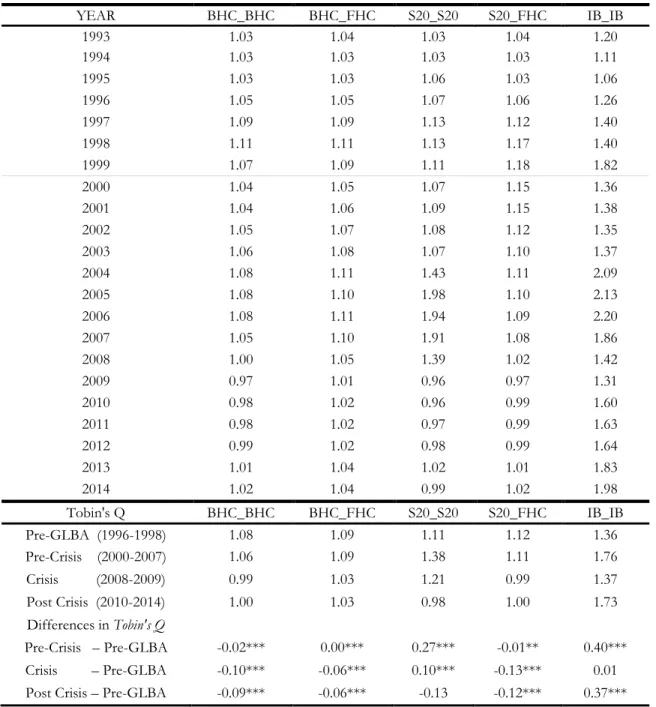
H3: Investment banks’ charter values decreased because of the increased competition.
We use Tobin’s Q as a proxy for charter value. Table 2 shows the summary statistics for
Tobin’s Q by type. In each quarter, we first calculate the Tobin’s Q at firm level, take the average by
type; next, take the average of quarterly results by year. The result shows that overall, investment
banks’ charter values do not decrease due to competition from commercial banks, especially from S20_FHC. Investment banks have the highest Tobin’s Q among the five types of banks, with significant decline in Tobin’s Q during financial crisis, and pick up again after 2009. All four types of commercial banks have quite similar level of Tobin’s Q around 1, with S20_S20 diverged during 2005 to 2007. Average Toin’s Q for investment banks is higher than that of commercial banks. Unreported
regression analysis also shows the similar results. In unreported analysis, we regress Toin’s Q on firm
type, time period and other control variables; the results are consistent.
6.0 Conclusion
This paper studies the possible impact of the 1999 Financial Services Modernization Act on the systemic risk of financial institutions. By examining several systemic risk measures (SRISK,
∆CoVaR, MES and CoMES, our focus is on SRISK), we find some evidence that banks which had section 20 subsidiaries before 1999 and became financial holding companies after 1999 exhibit risk increase, and they are more volatile than any other types of banks (except investment banks) during 2008 financial crisis. Banks which did not have section 20 subsidiaries before 1999 and become
21
financial holding companies experience less risk increase and there is some evidence they benefit from the business diversification. Overall, our study shows that the 1999 Act make some big banks take more risk (in terms of SRISK), but not all banks follow that path. When market is good, risky banks perform better than less risky banks; however, when market is bad, risky banks perform worse than
less risky banks. Moreover, financial holding companies’ total asset has greater impact on their systemic risk contribution than their investment banking activities. We also compute SRISK according to Engle (2015) DCC-GARCH simulation approach (with and without hypothesized book total assets and market equity) for 20 big banks from Supervisory Capital Assessment Program 2009, the result is consistent.
22
REFERENCES
Christian Brownlees and Robert Engle, “SRISK: A Conditional Capital Shortfall Index for Systemic Risk Measurement”, working paper, Jan. 2015.
Viral V. Acharya, Lasse H. Pedersen, Thomas Philippon, and Matthew Richardsony, “Measuring Systemic Risk”, working paper, May 2010.
Scaillet, O., “Nonparametric Estimation and Sensitivity Analysis of Expected Shortfall”, Mathematical Finance, 2004, 14 (1), 115-129.
Adrian, Tobias, and Markus K. Brunnermeier, “CoVaR”, Federal Reserve Bank of New York Staff Reports,
No. 348, Sep. 2014.
Benoit, Sylvain, Gilbert Colletaz, Christophe Hurlin, Christophe Pérignon, “A Theoretical and
Empirical Comparison of Systemic Risk Measures”, working paper, June 2013.
Ergun, A. T. and G. Girardi, “Systemic Risk Measurement: Multivariate GARCH Estimation of CoVaR”, Journal of Banking and Finance, 2013.
Acharya, Viral, Robert Engle, and Matthew Richardson, “Capital Shortfall: A New Approach to
Ranking and Regulating Systemic Risks”, American Economic Review, 2012, 102 (3), 59-64.
Timothy J. Yeager, Fred C. Yeager, and Ellen Harshman, “The Financial Services Modernization Act: Evolution or Revolution?” Journal of Economics and Business, Volume 59, Issue 4, July–August 2007, Pages 313–339.
Randall S. Kroszner, Raghuram G. Rajan, “Is the Glass-Steagall Act Justified? A Study of the U.S.
Experience with Universal Banking Before 1933,” American Economic Review, Vol. 84, No. 4 (Sep. 1994), 810-832.
Manju Puri, “Commercial banks in investment banking: Conflict of interest or certification role?
Journal of Financial Economics 40 (1996), pp. 373-401.
Yasuda, Ayako, “Do Bank Relationships Affect the Firm’s Underwriter Choice in the Corporate-Bond
23
Kevin J. Stiroh, Adrienne Rumble, “The dark side of diversification: The case of US financial holding companies,” Journal of Banking & Finance 30 (2006) 2131–2161.
Akhigbe, Aigbe and Ann Marie Whyte, “The Gramm-Leach-Bliley Act of 1999: Risk Implications for
the Financial Services Industry,” Journal of Financial Research, Vol 27(3), (2004) 435-446.
Al Mamun, Abdullah, M. Kabir Hassan, and Van Son Lai, “The Impact of the Gramm-Leach-Bliley
Act on the Financial Services Industry,” Journal of Economics and Finance, Fall 2004, Vol. 25(3), pp. 333-347.
Bhargava, Rahul and Donald Fraser, “On the Wealth and Risk Effects of Commercial Bank Expansion
into Securities Underwriting: An Analysis of Section 20 Subsidiaries,” Journal of Banking and Finance
22 (1998) 447--465.
Carow, Kenneth and Randall Heron, “Capital Market Reactions to the Passage of the Financial Services Modernization Act of 1999,” Quarterly Review of Economics and Finance 42, (2002), 465--485.
Taylor D. Nadauld, Shane M. Sherlund, “The impact of securitization on the expansion of Subprime credit,” Journal of Financial Economics 107 (2013) 454–476.
Fama, E. F.; French, K. R. (1993). “Common risk factors in the returns on stocks and bonds," Journal of Financial Economics 33: 3.
Carhart, Mark M., 1995a, “Survivor bias and persistence in mutual fund performance,” Unpublished Ph.D. dissertation, Graduate School of Business, University of Chicago, Chicago, Ill.
Carhart, Mark M., 1995b, “Survivor bias and mutual fund performance,” Working paper, School of Business Administration, University of Southern California, Los Angeles, Cal.
Board of Governors of the Federal Reserve System, “The Supervisory Capital Assessment Program: Overview of Results,” May 7, 2009.
24
Table 1. Quarterly Average in each quarter, count the number of firms and observations for each type; then take the average of all quarterly counts. Annual Average Count in each quarter, count the number of firms for each type; then take the average of the quarterly count within each year.
QUARTERLY AVERAGE
BHC_BHC BHC_FHC S20_S20 S20_FHC IB_IB
Count 286 72 20 17 34
NOBS 17,707 4,528 1,229 1,078 2,050
ANNUAL AVERAGE COUNT
YEAR BHC_BHC BHC_FHC S20_S20 S20_FHC IB_IB 1993 244 44 38 18 28 1994 266 47 36 17 28 1995 272 50 34 17 26 1996 278 52 30 17 27 1997 280 53 30 17 30 1998 306 58 26 18 27 1999 320 66 21 18 30 2000 321 69 20 17 32 2001 329 74 18 17 33 2002 337 74 18 17 38 2003 348 75 18 17 38 2004 341 78 17 17 37 2005 344 81 16 17 40 2006 297 81 17 17 40 2007 279 82 17 17 44 2008 259 84 15 17 44 2009 257 84 12 17 39 2010 236 87 12 17 37 2011 222 87 12 17 35 2012 276 87 11 17 33 2013 223 85 11 17 28 2014 252 84 10 17 28
25
Table 2. The table reports the yearly average of firm level Tobin’s Q by type. We first compute Tobin's
Q for each bank for each quarter; next, compute the simple average of Tobin's Q of banks in each type in each quarter (type quarterly Tobin's Q); finally compute the simple average of the type quarterly Tobin's Q for each type for each year. We also compute the average by four periods and compare the average difference. YEAR BHC_BHC BHC_FHC S20_S20 S20_FHC IB_IB 1993 1.03 1.04 1.03 1.04 1.20 1994 1.03 1.03 1.03 1.03 1.11 1995 1.03 1.03 1.06 1.03 1.06 1996 1.05 1.05 1.07 1.06 1.26 1997 1.09 1.09 1.13 1.12 1.40 1998 1.11 1.11 1.13 1.17 1.40 1999 1.07 1.09 1.11 1.18 1.82 2000 1.04 1.05 1.07 1.15 1.36 2001 1.04 1.06 1.09 1.15 1.38 2002 1.05 1.07 1.08 1.12 1.35 2003 1.06 1.08 1.07 1.10 1.37 2004 1.08 1.11 1.43 1.11 2.09 2005 1.08 1.10 1.98 1.10 2.13 2006 1.08 1.11 1.94 1.09 2.20 2007 1.05 1.10 1.91 1.08 1.86 2008 1.00 1.05 1.39 1.02 1.42 2009 0.97 1.01 0.96 0.97 1.31 2010 0.98 1.02 0.96 0.99 1.60 2011 0.98 1.02 0.97 0.99 1.63 2012 0.99 1.02 0.98 0.99 1.64 2013 1.01 1.04 1.02 1.01 1.83 2014 1.02 1.04 0.99 1.02 1.98 Tobin's Q BHC_BHC BHC_FHC S20_S20 S20_FHC IB_IB Pre-GLBA (1996-1998) 1.08 1.09 1.11 1.12 1.36 Pre-Crisis (2000-2007) 1.06 1.09 1.38 1.11 1.76 Crisis (2008-2009) 0.99 1.03 1.21 0.99 1.37 Post Crisis (2010-2014) 1.00 1.03 0.98 1.00 1.73 Differences in Tobin's Q Pre-Crisis – Pre-GLBA -0.02*** 0.00*** 0.27*** -0.01** 0.40*** Crisis – Pre-GLBA -0.10*** -0.06*** 0.10*** -0.13*** 0.01
26
Table 3. Table reports average SRISKMES and average share of aggregate SRISKMES for selected periods by bank type. Differences in average SRISKMES and average share of aggregate SRISKMES reflect changes in systemic risks from the period prior to the passage of the Act to the: (i) period following the passage of the Act; (ii) crisis period; and (iii) post crisis period. *represents significant at 10% level, ** at 5% and *** at 1%.
SRISKMES BHC_BHC BHC_FHC S20_S20 S20_FHC IB_IB
Pre-GLBA (1996-1998) 44,161 16,577 89,383 142,810 66,228
Pre-Crisis (2000-2007) 84,016 75,541 65,941 350,166 204,968
Crisis (2008-2009) 51,163 97,102 6,538 501,408 136,137
Post Crisis (2010-2014) 71,349 129,503 3,503 756,559 128,319
Differences in SRISKMES
Pre-Crisis – Pre-GLBA 39,855* 58,963*** -23,442*** 207,356*** 138,740***
Crisis – Pre-GLBA 7,002 80,525*** -82,846*** 358,598*** 69,909***
Post Crisis – Pre-GLBA 27,187** 112,926*** -85,880*** 613,749 62,092***
Share of SRISKMES BHC_BHC BHC_FHC S20_S20 S20_FHC IB_IB
Pre-GLBA (1996-1998) 12.22 4.58 24.93 39.69 18.58
Pre-Crisis (2000-2007) 11.64 9.37 10.87 42.85 25.27
Crisis (2008-2009) 6.71 12.81 0.67 64.40 15.40
Post Crisis (2010-2014) 6.51 11.92 0.32 69.80 11.46
Differences in Share of SRISKMES
Pre-Crisis – Pre-GLBA -0.58 4.79*** -14.06*** 3.17** 6.69
Crisis – Pre-GLBA -5.50 8.23*** -24.26*** 24.71** -3.18***
Post Crisis – Pre-GLBA -5.71 7.34*** -24.61*** 30.11 -7.13
SRISKMES/MVE BHC_BHC BHC_FHC S20_S20 S20_FHC IB_IB
Pre-GLBA (1996-1998) 118.72 20.13 9.67 8.12 14.48
Pre-Crisis (2000-2007) 180.39 35.91 3.74 6.75 114.03
Crisis (2008-2009) 323.2 47.25 4.09 11.45 61.13
Post Crisis (2010-2014) 336.65 68.78 10.35 14.17 106.83
Differences in
SRISKMES/MVE
Pre-Crisis – Pre-GLBA 61.67 15.79 -5.94*** -1.36*** 99.55***
Crisis – Pre-GLBA 204.48*** 27.12*** -5.58*** 3.33 46.65***
27
Table 4. Table reports average baseline SRISKCoMES and average share of aggregate SRISKCoMES for selected periods by bank type. Differences in average SRISKCoMES and average share of aggregate
SRISKCoMES reflect changes in systemic risks from the period prior to the passage of the Act to the: (i) period following the passage of the Act; (ii) crisis period; and (iii) post crisis period. *represents significant at 10% level, ** at 5% and *** at 1%.
SRISKCoMES BHC_BHC BHC_FHC S20_S20 S20_FHC IB_IB
Pre-GLBA (1996-1998) 9 8 150 843 11,012
Pre-Crisis (2000-2007) 171 13 0 527 27,955
Crisis (2008-2009) 9,020 14,969 1,346 118,205 57,308
Post Crisis (2010-2014) 2,697 3,406 56 19,647 40,943
Differences in SRISKCoMES
Pre-Crisis – Pre-GLBA 162*** 6*** -150*** -315 16,942
Crisis – Pre-GLBA 9,011*** 14,961*** 1,196*** 117,363*** 46,296***
Post Crisis – Pre-GLBA 2,688*** 3,398*** -94*** 18,804*** 29,930
Share of SRISKCoMES BHC_BHC BHC_FHC S20_S20 S20_FHC IB_IB
Pre-GLBA (1996-1998) 0.11 0.05 0.21 1.2 98.43
Pre-Crisis (2000-2007) 4.12 0.07 0 0.84 94.97
Crisis (2008-2009) 6.62 5.33 0.95 37.43 49.66
Post Crisis (2010-2014) 5.35 2.39 0.11 10.79 81.36
Differences in Share of SRISKCoMES
Pre-Crisis – Pre-GLBA 4.01*** 0.02*** -0.21*** -0.36 -3.46***
Crisis – Pre-GLBA 6.52*** 5.28*** 0.74** 36.23*** -48.76***
Post Crisis – Pre-GLBA 5.24*** 2.34*** -0.10*** 9.59*** -17.06***
SRISKCoMES/MVE BHC_BHC BHC_FHC S20_S20 S20_FHC IB_IB
Pre-GLBA (1996-1998) 0.62 0.24 0.01 0.04 4.02
Pre-Crisis (2000-2007) 1.18 0.02 0.00 0.01 101.83
Crisis (2008-2009) 125.34 7.38 0.81 3.75 52.05
Post Crisis (2010-2014) 106.20 8.06 7.50 0.50 96.59
Differences in
SRISKCoMES/MVE
Pre-Crisis – Pre-GLBA 0.56 -0.22*** -0.01*** -0.03*** 97.81***
Crisis – Pre-GLBA 124.72*** 7.13*** 0.8*** 3.71*** 48.03***
28
Table 5. Table reports the means and differences in means for trading assets and non-interest income by bank type and period. We first compute simple average of trading assets (non-interest income) of banks in each type in each quarter (type quarterly average); next compute the simple average of the type quarterly average trading assets (non-interest income) for each type for each period we defined; finally, compute the differences in means of the four periods. *represents significant at 10% level, ** at 5% and *** at 1%.
Trading Assets BHC_BHC BHC_FHC S20_S20 S20_FHC IB_IB
Pre-GLBA (1996-1998) 7 33 6,290 13,511 7 Pre-Crisis (2000-2007) 36 73 5,371 41,524 36 Crisis (2008-2009) 5 155 125 74,867 5 Post Crisis (2010-2014) 8 184 13 69,918 8 Differences in Trading Assets Pre-Crisis – Pre-GLBA 29*** 40*** -919*** 28,013*** 29*** Crisis – Pre-GLBA -2*** 122*** -6,165*** 61,356*** -2***
Post Crisis – Pre-GLBA 1*** 151*** -6,277*** 56,407*** 1***
Noninterest Income BHC_BHC BHC_FHC S20_S20 S20_FHC IB_IB
Pre-GLBA (1996-1998) 4,432 9,590 156,226 310,067 4,432 Pre-Crisis (2000-2007) 8,003 56,987 294,294 821,832 8,003 Crisis (2008-2009) 3,385 105,717 33,315 1,079,224 3,385 Post Crisis (2010-2014) 5,486 121,749 28,749 1,306,499 5,486 Differences in Noninterest Income Pre-Crisis – Pre-GLBA 3,571*** 47,398*** 138,068*** 511,765*** 3,571*** Crisis – Pre-GLBA -1,047*** 96,128*** -122,910*** 769,157*** -1,047***
29
Figure 1. This figure shows the market concentration measurement (HHI) by type and year. In each year, for each type of banks we compute HHI of ten 3- month rolling windows; then take the average of those ten HHIs within a year to achieve yearly average HHI for each type of banks.
Figure 2. This figure shows the yearly average of rolling stock return standard deviation. First compute stock returns standard deviation for each bank in each 3-month rolling window; next take the simple average of the firm level returns standard deviation by type within each 3-month rolling window (type level returns standard deviation); finally take the average of ten 3-month rolling window type level returns standard deviation in each year by type.
0.000 0.010 0.020 0.030 0.040 0.050 0.060 0.070
Figure 2: Average Standard Deviation
BHC_BHC BHC_FHC S20_S20 S20_FHC IB_IB 0 1 2 3 4 5 6 7 8 9 10
Figure 1: Market Concentration Based on Market Equity
30
Figure 3. This figure shows the yearly average of rolling Carhart 4-factor model residual standard deviation. First run Carhart 4-factor regression at firm level by bank type in each 3-month rolling window; then take the average of ten 3-month rolling window residual standard deviation in each year by type.
Figure 4. This figure shows the yearly average of rolling Carhart 4-factor model market beta. First run Carhart 4-factor regression at firm level by bank type in each 3-month rolling window; then take the average of ten 3-month rolling window market beta in each year by type.
BHC_BHC BHC_FHC S20_S20 S20_FHC IB_IB 0.000 0.002 0.004 0.006 0.008 0.010 0.012 0.014 0.016
Figure 4: Average Excess Market Return Beta
BHC_BHC BHC_FHC S20_S20 S20_FHC IB_IB 0.00 0.01 0.02 0.03 0.04 0.05 0.06
Figure 3: Average Indiosyncratic Residual Risk
31
Figure 5. This figure shows the yearly average of rolling Carhart 4-factor model adjusted R-squared. First run Carhart 4-factor regression at firm level by bank type in each 3-month rolling window; then take the average of ten 3-month rolling window adjusted R-squared in each year by type.
0.000 0.100 0.200 0.300 0.400 0.500 0.600
Figure 5: Average Adjusted R2
32
Figure 6. Figure 6A graphs total baseline 𝑆𝑅𝐼𝑆𝐾𝐶𝑜𝑀𝐸𝑆 in millions of USD by bank type and year. In
each quarter, baseline 𝑆𝑅𝐼𝑆𝐾𝐶𝑜𝑀𝐸𝑆 is computed for each bank and summed across banks to obtain
group totals. In Figure 6B, Group totals are summed to obtain the quarterly aggregate amount which is used to scale group totals to calculate group shares of 𝑆𝑅𝐼𝑆𝐾𝐶𝑜𝑀𝐸𝑆. Quarterly shares of each group
are averaged to obtain annual shares. In Figure 6C, quarterly 𝑆𝑅𝐼𝑆𝐾𝐶𝑜𝑀𝐸𝑆 is scaled by the market
value of equity (MVE) for each bank. Quarterly values are summed across banks to obtain quarterly group total. Quarterly total 𝑆𝑅𝐼𝑆𝐾𝐶𝑜𝑀𝐸𝑆/MEV of each group is averaged to calculate annual averages.
MES
SRISK SRISKMES 0% 10% 20% 30% 40% 50% 60% 70% 80% 90% 100%
Figure 6B: Share of Total SRISKMESby Bank Type
BHC_BHC BHC_FHC S20_S20 S20_FHC IB_IB 100,000 200,000 300,000 400,000 500,000 600,000 700,000 800,000 900,000
Figure 6A: SRISKMES by Bank Type
33 0 50 100 150 200 250 300 350 400 450 500
Figure 6C. SRISKMES/MVE by Bank Type
34
Figure 7. This figure shows the baseline SRISKMES ($) for selected S20_FHC bank in each quarter. The threshold value for MES is the stock return that make the firm with zero capital shortfall.
0 50,000 100,000 150,000 200,000 250,000
Figure 7: SRISKMES for Selected S20_FHC Banks
35
Figure 8. Figure 8A graphs total baseline 𝑆𝑅𝐼𝑆𝐾𝐶𝑜𝑀𝐸𝑆 in millions of USD by bank type and year. In
each quarter, baseline 𝑆𝑅𝐼𝑆𝐾𝐶𝑜𝑀𝐸𝑆 is computed for each bank and summed across banks to obtain
group totals. In Figure 8B, Group totals are summed to obtain the quarterly aggregate amount which is used to scale group totals to calculate group shares of 𝑆𝑅𝐼𝑆𝐾𝐶𝑜𝑀𝐸𝑆. Quarterly shares of each group
are averaged to obtain annual shares. In Figure 8C, quarterly 𝑆𝑅𝐼𝑆𝐾𝐶𝑜𝑀𝐸𝑆 is scaled by the market
value of equity (MVE) for each bank. Quarterly values are summed across banks to obtain quarterly group total. Quarterly total 𝑆𝑅𝐼𝑆𝐾𝐶𝑜𝑀𝐸𝑆/MEV of each group is averaged to calculate annual averages.
50,000 100,000 150,000 200,000 250,000
Figure 8A. SRISK by Bank Type
BHC_BHC BHC_FHC S20_S20 S20_FHC IB_IB 0% 10% 20% 30% 40% 50% 60% 70% 80% 90% 100%
Figure 8B. Share of Total SRISK by Bank Type
36 0 50 100 150 200 250 300 350 400 450
Figure 8C. SRISK/MVE by Bank Type
37
Figure 9. This figure shows the baseline SRISKCoMES ($) for each bank in each quarter. The threshold used for CoMES is the VaR (at 5%) of the market returns as specified in equation 14. BOFA, JPMORGAN, CITIGROUP and WELLSFARGO are S20_BHC. BEARSTEARNS, MERRILLLYNCH, MORGANSTANLEY, LEHMANBROTHERS and GOLDMANSACHS are IB_IB.
0 20,000 40,000 60,000 80,000 100,000 120,000 140,000 160,000 1993.1 1993.3 1994.1 1994.3 1995.1 1995.3 1996.1 1996.3 1997.1 1997.3 1998.1 1998.3 1999.1 1999.3 2000.1 2000.3 2001.1 2001.3 2002.1 2002.3 2003.1 2003.3 2004.1 2004.3 2005.1 2005.3 2006.1 2006.3 2007.1 2007.3 2008.1 2008.3 2009.1 2009.3 2010.1 2010.3 2011.1 2011.3 2012.1 2012.3 2013.1 2013.3 2014.1 2014.3 Figure 9. Individual Bank Basedline SRISKCoMES
BOFA JPMORGAN CITIGROUP WELLSFARGO BEARSTEARNS MERRILLLYNCH MORGANSTANLEY LEHMANBROTHERS GOLDMANSACHS
1.BANK OF AMERICA 2.CITIGROUP 3.JPMORGAN 4.WELLS FARGO
38
Figure 10A. This figure shows the average of 1000 simulated SRISKCoMES ($) for each selected bank in each quarter. First, apply DCC-GARCH model to simulate stock returns for each bank, then compute the SRISKCoMESusing the simulated returns and bank’s original market equity and book liability. Repeat the process for 1000 times for each bank and take the average of 1000 simulated quarterly SRISK for each bank. In our DCC-GARCH based SRISKCoMES, the threshold used for CoMES is the VaR (at 5%) of the market returns.
0 20,000 40,000 60,000 80,000 100,000 120,000 140,000 160,000 1993.1 1993.3 1994.1 1994.3 1995.1 1995.3 1996.1 1996.3 1997.1 1997.3 1998.1 1998.3 1999.1 1999.3 2000.1 2000.3 2001.1 2001.3 2002.1 2002.3 2003.1 2003.3 2004.1 2004.3 2005.1 2005.3 2006.1 2006.3 2007.1 2007.3 2008.1 2008.3 2009.1 2009.3 2010.1 2010.3 2011.1 2011.3 2012.1 2012.3 2013.1 2013.3 2014.1 2014.3 Figure 10A. Average of 1000 DCC-GARCH Simulated SRISKCoMES
AmEx Regions USB FifthThird KeyCorp
BofA PNC BB&T State St BNYM
Bear Stearns JPMC Citi MorganStanley Wells Lehman Brothers SunTrust CapOne Goldman MetLife
1.BANKOFAMERICA
2.CITIGROUP
3.JPMORGAN
4.WELLS FARGO
5.MORGANSTANLEY
39
Figure 10B. This figure shows the average of 1000 simulated SRISKCoMES ($) scaled by market value of equity for each selected bank in each quarter. First, apply DCC-GARCH model to simulate stock returns for each bank, then compute the SRISKCoMES using the simulated returns
and bank’s original market equity and book liability. Repeat the process for 1000 times for each bank and take the average of 1000 simulated
quarterly SRISK for each bank. The result showed are simulated SRISK scaled by each bank’s market value of equity. In our DCC-GARCH based SRISKCoMES, the threshold used for CoMES is the VaR (at 5%) of the market returns.
0 1 2 3 4 5 6 7 8 9 10 1993.1 1993.3 1994.1 1994.3 1995.1 1995.3 1996.1 1996.3 1997.1 1997.3 1998.1 1998.3 1999.1 1999.3 2000.1 2000.3 2001.1 2001.3 2002.1 2002.3 2003.1 2003.3 2004.1 2004.3 2005.1 2005.3 2006.1 2006.3 2007.1 2007.3 2008.1 2008.3 2009.1 2009.3 2010.1 2010.3 2011.1 2011.3 2012.1 2012.3 2013.1 2013.3 2014.1 2014.3 Figure 10B. Average of 1000 DCC-GARCH Simulated SRISKCoMES/MVE
AmEx Regions USB FifthThird KeyCorp
BofA PNC BB&T State St BNYM
Bear Stearns JPMC Citi MorganStanley Wells Lehman Brothers SunTrust CapOne Goldman MetLife
1.CITIGROUP 2.FIFTH THIRD 3.BANKOFAMERICA
LEHMAN BROTHERS
40
Figure 11A. For BHC19 group, we first select 19 BHC_BHC banks with the highest market value of equity in a quarter, next compute the baseline SRISKCoMES for each bank for each quarter, then sum up 19 banks’ SRISK within a quarter; For BHC19 group we do not use DCC -GARCH simulated total returns because the top 19 BHCs are different in different years (19 FHCs are the same in each year). For FHC19 groups, we compute two different versions of simulated SRISKCoMES : 1) using DCC-GARCH simulated total returns and original market value of equity and book liability and 2) using DCC-GARCH simulated total returns and hypothesized market value of equity and book liability. SRISK is also computed at bank level for each quarter then sum up across all 19 FHC banks. To compute hypothesized market value of equity and book liability, we use book total assets and market equity of 1999 Q4 as the starting value for the selected 19 FHCs, and we assume that the selected FHCs’ boo