Privatization in Sub-Saharan Africa: Some Lessons from
Experiences to Date
Thierry D. Buchs1 Senior Economist
International Finance Corporation tbuchs@ifc.org
Revised version - December 2003 Abstract
Privatization became a central element of economic reforms in most countries in Sub-Saharan Africa during the 1990s. Yet, empirical evidence regarding the impact of privatization remains scarce. Since the seminal work of CAMPBELL-WHITE & BHATIA [1998], covering transactions on the African continent until 1996, no comprehensive assessment has been conducted. At a time when public opposition to further privatization is growing, this paper aims at giving a broad overview of the impact of privatization in Sub-Saharan Africa from 1991 to 2002 in the light of recent developments, and to derive some general trends and conclusions from the body of empirical evidence available to date. During this period, about 2300 privatization transactions have taken place, generating a total sales value estimated at US$ 9 billion.The main findings on the impact of privatization are as follows: first, privatization has had a minimal one-off impact on the budget; second, firm turnover and profitability have generally increased immediately following privatization but the evidence is mixed regarding the sustainability of the initial post-privatization upswing; third, employment has been adversely affected by privatization, although the latter has not resulted in massive layoffs in absolute terms; fourth, FDI and stock markets have played a limited role in privatization transactions despite some showcase transactions; fifth, regulation and competition have often been overlooked in the privatization process, and even where they have been dealt with, enforcement problems have greatly limited their effectiveness; sixth, privatization has created new political patronage opportunities, leading to numerous corruption scandals which have damaged the credibility of the privatization process; finally, social aspects of privatizations have generally been overlooked, reflecting the tendency to focus on privatization transactions, rather than on sector reorganization at large including wider social objectives.
JEL Classification: D78, L33, L41
Keywords : Africa, competition, governance, privatization, regulation
1 The author is writing in his own capacity. Although the usual disclaimer applies, the author wishes to thank Anastasia Gekis (IFC), Rohit Malhotra (IFC), John Nellis (Center for Global Development), Guy Pfeffermann (IFC) and Brian Samuel (IFC) for useful comments and suggestions. The views presented in this paper do not necessarily represent those either of the World Bank Group or of its shareholders.
1. Introduction
Privatization became a central element of economic reforms in most countries in Sub-Saharan Africa during the 1990s, putting increasing emphasis on private sector development. As elsewhere, privatization policies in Africa were aimed at enhancing the efficiency of resource allocation via increased competition, providing fiscal benefits to cash-strapped governments, attracting more private investment and improving the access of the private sector to finance in general. As a result, privatization has become “the superordinate medium-long term objective of adjustment programs everywhere in Africa” BENNEL [1997] (p.1785). At the same time, public discontent and opposition to
privatization programs has gained ground in various regions, including in Africa. Most criticism voiced by the local press, Parliaments but also NGOs and academics rests on the alleged adverse affects of privatization on unemployment and on the poor, and on perceptions of widespread corruption in the privatization process. The case of Zambia is a case in point: on the one hand, Zambia’s privatization program has been praised by many observers during the 1990s in terms of government commitment, preparatory work, transparency in execution and legal framework2; on the other hand, corruption scandals in some key transactions3 and the pull-out of Anglo American from the KCM copper mine in 2002 have led to strong resistance to further privatizations from parliamentarians and the population at large4. The same resistance can be observed in other countries such as Benin, Ghana, and in Kenya, particularly related to the privatization of public utilities. Ironically, privatization has almost become a “bad word”, but very little is known about its impact in most countries except at the anecdotal level. Since the seminal work of CAMPBELL-WHITE
& BHATIA [1998], covering transactions on the African continent to 1996, no
comprehensive assessment has been conducted, with the exception of a special section on privatization policies in Africa in OECD [2003] and a first review attempt by NELLIS
[2003]. The prime objective of this paper is to shed some light on the impact of privatization in Sub-Saharan Africa, updating the work of Campbell-White & Bathia in the light of recent developments, and to try to derive some general trends and conclusions from the body of empirical evidence available to date. Section 2 conducts a statistical overview of privatization across Sub-Saharan Africa between 1991 and 2002. Section 3 discusses various dimensions of the impact on privatization, covering enterprise performance, unemployment, FDI and capital markets, regulation and competition, governance, and income distribution impact. Due to data limitation, the discussion is primarily aimed at stimulating the debate on these important issues, but does not constitute an exhaustive analysis at this stage. Finally, section 4 draws some key lessons from the experience to date and section 5 offers some conclusions.
2 See CAMPBELL-WHITE & BATHIA [1998], pp.111-112
3 For example, the sale of the Luanshya division of ZZCM mines in 1997.
4 For example, the website www.zamnet.zm/zamnet/post/post.html hosts a "live" debate regarding the controversial privatization of Zambia National Commercial Bank (ZNCB), which is a binding condition for the further release of debt relief funds under the HIPC initiative.
2. Privatization across Sub-Saharan Africa 1991-2002: a Statistical Overview
Like any other statistical exercise in Sub-Saharan Africa, compiling data on privatization transactions and sales value is not an easy task. The data reported here comes primarily from the privatization database, which is being maintained by the World Bank Africa Region. The following caveat is important to note: the database seems to be incomplete, particularly in recent years. To be sure, there are differences among information sources. For instance, there are discrepancies between the Africa Region database and the data gathered by CAMPBELL-WHITE & BATHIA [1998] in their detailed study of privatization, most notably on sales value data. When the comparison is extended to the seminal work of BENNEL [1997], similar problems arise. These problems are not new, and stem from the fact that the final stages of many privatization transactions are often confusing and may involve unexpected developments. Typically, Governments list state-owned enterprises (thereafter “SOEs”) as “divested” when an agreement is signed between the authorities and a private buyer, but transfers may be subsequently cancelled for a variety of reasons (e.g. buyer’s failure to honor payment, government’s failure to approve the deal etc.). However, such transfers could well show in privatization statistics, and when the same enterprises are again lined up for privatization, “new” transactions are reported, hence the obvious problem of multiple accounting. The cut-off date for reporting a transaction as “final” is therefore sensitive, and it is actually an important source of noise in the data5. In addition, firms are sometimes broken up into various companies, which complicates measurement. For instance, Cote d’Ivoire’s Palmindustrie was broken up into 13 companies in the privatization process. Depending on the methodology used, it is either reported as 1 sale or as 13 sales.
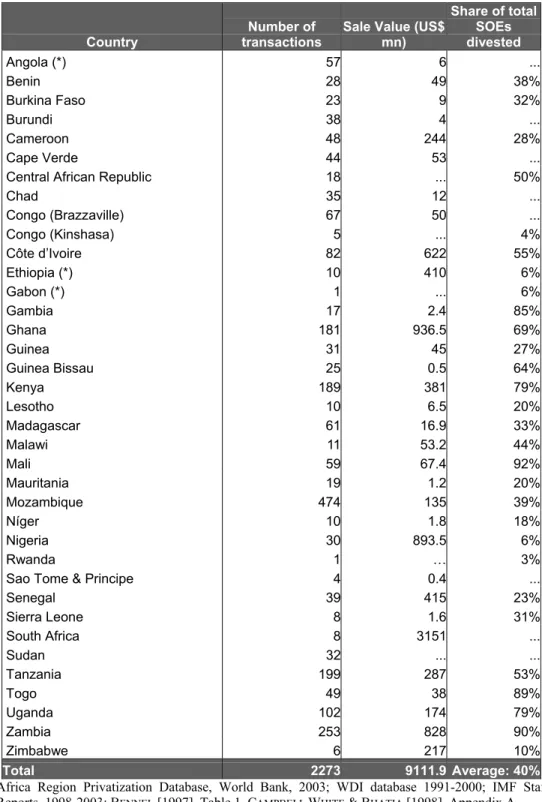
With this caveat in mind, the main findings of the statistical analysis are the following: Between 1991 and 2002, roughly 2300 privatization transactions were recorded, with total sales value estimated at around US$ 9 billion (see Table 1). As shown in Chart 1, privatization transactions followed a bell-shape pattern, peaking in the mid-nineties. Overall, privatization activity seems to have concentrated on Eastern and Southern Africa (Mozambique, Zambia, Tanzania, Kenya, Uganda) and Ghana, with these six countries accounting for 60% of the total number of transactions. In terms of sales value of transactions however, the picture is slightly different, as South Africa alone accounts for 35% of total sales revenue; the other key players include Ghana, Nigeria, Zambia and Cote d’Ivoire, and these 5 countries together account for 70% of total (see Chart 2). This illustrates the fact that there is no correlation between the number of transactions and the total sales value, a point already made in previous studies.
Privatization seems to have been far-reaching in Zambia, Mali, Togo, Kenya, the Gambia and Ghana, where the share of state-owned enterprises divested since the mid-1980s ranges from 70 to 90%. By contrast, countries with less comprehensive privatization programs (0-10% of state-owned enterprises divested) include Congo, Ethiopia, Gabon, Nigeria and Zimbabwe. These are very rough estimates, however, as the total number of state-owned
enterprises at the beginning of the privatization process is not always easy to gauge6 and is very sensitive to public sector definition and coverage.
Chart 1. Number of privatization transactions
0 100 200 300 400 500 600 1991 1992 1993 1994 1995 1996 1997 1998 1999 2000 2001 2002
Chart 2. Total transaction value (Millions US$ per year)
0 200 400 600 800 1000 1200 1400 1991 1992 1993 1994 1995 1996 1997 1998 1999 2000 2001 Sub-Saharan Africa excluding South Africa South Africa
6 In some cases (e.g. Mozambique), the number of divested companies exceeds the official number of SOEs. In addition, no account was taken for newly established state enterprises parastatals since the mid-1980s (e.g. Senegal).
Table 1. Privatization record in Africa 1991-2002
Country transactions Number of Sale Value (US$ mn)
Share of total SOEs divested Angola (*) 57 6 ... Benin 28 49 38% Burkina Faso 23 9 32% Burundi 38 4 ... Cameroon 48 244 28% Cape Verde 44 53 ...
Central African Republic 18 ... 50%
Chad 35 12 ... Congo (Brazzaville) 67 50 ... Congo (Kinshasa) 5 ... 4% Côte d’Ivoire 82 622 55% Ethiopia (*) 10 410 6% Gabon (*) 1 ... 6% Gambia 17 2.4 85% Ghana 181 936.5 69% Guinea 31 45 27% Guinea Bissau 25 0.5 64% Kenya 189 381 79% Lesotho 10 6.5 20% Madagascar 61 16.9 33% Malawi 11 53.2 44% Mali 59 67.4 92% Mauritania 19 1.2 20% Mozambique 474 135 39% Níger 10 1.8 18% Nigeria 30 893.5 6% Rwanda 1 … 3%
Sao Tome & Principe 4 0.4 ...
Senegal 39 415 23% Sierra Leone 8 1.6 31% South Africa 8 3151 ... Sudan 32 ... ... Tanzania 199 287 53% Togo 49 38 89% Uganda 102 174 79% Zambia 253 828 90% Zimbabwe 6 217 10% Total 2273 9111.9 Average: 40%
Sources: Africa Region Privatization Database, World Bank, 2003; WDI database 1991-2000; IMF Staff Country Reports, 1998-2003; BENNEL [1997], Table 1, CAMPBELL WHITE & BHATIA [1998], Appendix A
Notes: The share of total State-Owned Enterprises divested was obtained in using BENNEL [1997] data (state-owned
enterprises as of 1980s) and correcting for privatization operations which took place between the mid-1980s and 1990.
(*) In the case of Angola, the authorities have reported 275 additional privatization transactions, but no information is available regarding the sector, the year and the firms actually privatized. In the same category, 115 additional transactions were reported by Ethiopia and 25 by Gabon, with no information whatsoever. These transactions (total: 415) are excluded from Table 1.
Chart 3. Countries in which total transaction values exceeded US$200 millions (1991-2002) 3151 936 893 828 622 414 410 380 280 244 217 0 500 1000 1500 2000 2500 3000 3500 South Africa Ghana Nigeria Zambia Côte d’Ivoire Senegal Ethiopia Kenya Tanzania Cameroun Zimbabwe
In terms of sectoral distribution, the picture emerging from the CAMPBELL & WHITE [1998] study remains valid: the bulk of privatization transactions has taken place in manufacturing and industry, followed by agriculture, services, tourism and real estate(see Chart 4). Public utilities and energy remain far behind, and quite interestingly, public utilities privatization did not accelerate throughout the second half of the 1990s (see Chart 5)7. This situation could change, however, with many transactions involving utilities are currently under way (as of 2003), mostly in Western and Central Africa. Currently, average government share of equity in those sectors (energy, electricity, water and telecoms) remains sizable after privatization, i.e. ranging from 12% to 40%, as shown in Table 2. This contrasts with all the other sectors where government (average) share after privatization is roughly 6%. As usual, general averages hide sizable country differences, and the relatively low number of transactions involving utilities tends to distort averages.
7 This assessment could be biased by the data-reporting problem referred to when discussing the database, however.
Chart 4. Privatization transactions by sector (1991-2002) 2 13 10 16 38 93 90 178 545 558 675 0 100 200 300 400 500 600 700 800 Electricity Other Telecom Water & Utilities Energy Transport Financial Trade Services, Tourism & Real Estate Agriculture, Agroindustry & Fisheries Manufacturing & Industry
Chart 5. Public Utilities Privatization
0 2 4 6 8 10 12 14 1991-1995 1996-2002 "In preparation" (2003) Telecom Electricity Water
Table 2. Government’s share of equity before and after privatization
Sector Average Government’s share of equity (%)
Manufacturing & Industry Before privatization 79.7
After privatization 7.9
Agriculture, Agroindustry & Fisheries Before privatization 79.5
After privatization 1.6
Services, Tourism & Real estate Before privatization 70.2
After privatization 14.3
Trade Before privatization 95.3
After privatization 3.3
Transport Before privatization 97.6
After privatization 4.9
Financial Before privatization 86.7
After privatization 8.2
Energy Before privatization 88.3
After privatization 46.5
Water Before privatization 100
After privatization 12.5
Electricity Before privatization 100
After privatization 33
Telecoms Before privatization 95.8
After privatization 42.8
Other Before privatization 63.3
After privatization 10.2
Total average government’s share of equity before privatization 89.1 Total average government’s share of equity after privatization 10.3
In terms of privatization methods used throughout the decade, the bulk of transactions were conducted through competitive sale of either shares or assets, as shown in Table 3 and Chart 6. Liquidation was used in 17% of transactions, and most typically in the early stages of privatization programs, which reflects the fact that the first SOEs to be targeted for privatization were often in a desperate financial situation. Quite interestingly, uncompetitive methods (i.e. direct sales of shares or assets, preemptive rights) were used extensively in certain key “privatizers” such as Ghana, Kenya and Cote d’Ivoire, as shown in Table 4: in Kenya, 53% of transactions were conducted through uncompetitive methods8, and the corresponding figures are 31% in Cote d’Ivoire and almost 20% in Ghana. Although the measure is certainly very crude, some (very) limited correlation can be detected between privatization methods and governance, as shown in Chart 7: Governance seems to be poorer in countries where uncompetitive were mostly used, and vice and versa. The use of uncompetitive methods is just an illustration of how transparency and governance problems affected the privatization process, but transparency concerns no doubt go beyond the use of uncompetitive methods. Anecdotal evidence
8 Note however that in many cases, the firms privatized were joint ventures between public and private investors, with shareholders agreements stating that in the case if dissolution of the venture, the non-dissolving partner had to be given a preemptive right to purchase the other partner’s shares. The existence of this legal clause explains the unusually large share of privatizations conducted through preemptive rights in Kenya.
shows that transparency is also a big issue in competitive sales, and in management/employee buyouts.
Table 3. Methods of Privatization (1991-2002)
Method of divestiture Number
Shares sold on Competitive Basis 728
Asset sold on a competitive basis 454
Liquidation 388
Shares sold to Existing Shareholders with Pre-emptive Rights 158
Lease 104
Direct sale of shares (i.e. non-competitive) 96
Shares sold trough public floatation 69
Not specified 48
Restitution to former owner 47
Management contract 42
Management/Employee Buyout 33
Direct sale of assets (i.e. non-competitive) 29
Joint-venture 28
Free transfer of assets 12
Transfer to Trustee 11
Debt-Equity Swap 10
Concession 8
JV(D) 5
Lease /Management contract 2
Merger 2
TOTAL 2274
Chart 6. Privatization methods 1991-2002
48 897 869 460 0 200 400 600 800 1000 Sale of shares Sale of assets Other Unspecified
Table 4. Countries in which uncompetitive methods reached 20% of total transactions (% of transactions)
Country Direct sale of assets Direct sale of shares Preemptive rights
Cote d’Ivoire 8.5% 12% 11% Gambia 23% Ghana 5% 4% 9% Kenya 2% 51% Malawi 27% Sao Tome 25%
Chart 7. Privatization Methods and Governance: Some (limited) correlation
20 25 30 35 40 45 50 55 0% 20% 40% 60%
Percentage of non-competitive transactions
CGI
(Composite Governance Index)
20 25 30 35 40 45 50 55 40% 60% 80% 100%
Percentage of competitive transactions
CGI
(Composite Governance Index)
CGI: Composite Governance Index taking into account government effectiveness, rule of law, regulatory quality and control of corruption. Computed from World Bank Governance Dataset 2001-2002. Index ranges from 0 (poor) to 100 (good).
Non-competitive transactions : defined as transactions processed through either direct sales of shares or assets without competitive bids
Competitive transactions: defined as transactions processed through competitive sales of assets or shares but excluding direct sales, as well as other methods (management contracts, transfers, management/employee buyout, swaps, joint ventures etc.)
3. Impact of privatization
a. Impact on Government financial flows
When CAMPBELL WHITE & BHATIA [1998] compared the stated objectives of privatization programs over time across countries, they found out that one of the most important official motivations was fiscal. Despite several attempts to reform SOEs in the 1980s under donor guidance, notably by setting up data production and monitoring systems, the financial and economic performance of most public enterprises remained dismal, and required heavy subsidies from central governments. So quite logically, if fiscal considerations were the prime driving force of privatization, one could have expected divesture from the largest state-owned companies and other parastatals. In practice however, the larger enterprises were specifically excluded from privatization until the late 1990s, with very few exceptions. Worse, no fiscal monitoring was put in place to assess the impact of privatization, except in Tanzania and Lesotho, resulting in little idea of the expected or actual outcomes of privatization programs. In terms of expectations, it is fair to admit that the fiscal impact of privatization is bound to be dynamic over time, with a one-off stock effect (privatization receipts) which could be either positive or negative depending on costs to be covered (retrenchments, liabilities) and a subsequent positive flow effect resulting from the decrease in direct and indirect subsidies over time, and increased tax revenues arising from the privatized firms. Let’s consider each effect in detail.
In the short run, privatization has had a minimal one-off impact on the budget.
This conclusion is actually quite clear-cut, as only a fraction share of privatization revenues accrued to the Government budget (Chart 9), with the notable exception of Cape Verde. In several countries (e.g. Zambia, Mozambique, Uganda), proceeds were channeled by law to specific extrabudgetary funds in order to finance specific activities or operations such as settling liabilities or retrenchment costs, or even supporting small-scale entrepreneurs9. Given the desperate financial situation of some of the firms to be privatized in certain countries, privatization receipts have often been completely wiped out in settling liabilities or severance payments, without considering serious transparency problems. In Zambia for instance, there were no net proceeds at all to be transferred to the privatization revenue fund. Finally, in some countries, privatization proceeds could still be outstanding: in Ghana for instance, a substantial portion of the proceeds has yet to be collected. One should also point out that in almost all countries, the actual value of some individual sales has been close to an obsession and has fueled considerable political debate (see Box 1 for the example of Zambia’s ZCCM copper mines).
On average, the overall remaining level of subsidization after more than a decade of privatization is an open question mark, although there is limited evidence that direct subsidies decreased dramatically
The lack of data makes it very difficult to draw firm conclusions regarding the evolution of (net) financial transactions between the government and former public enterprises over time. The problem is especially acute for indirect subsidies, which are difficult to identify and to quantify. Such subsidies typically include equity support (usually to absorb financial losses), favorable financing terms and favorable fiscal terms (e.g. exemptions), but can also
cover privileges such as special concessions. Netting out public enterprises subsidies to the government is even more difficult, as public enterprise accounts are rarely available. Even if the analysis is restricted to direct subsidies only –which is very partial-, country data is still scarce, particularly in Francophone African countries. Data collected for 9 countries (Burkina Faso, Ghana, Guinea-Bissau, Mauritania, Mozambique, Tanzania, Uganda, Zimbabwe and Zambia) reveal a sizable fall in direct subsidies between 1991 and 2000, as shown in Chart 10, with average direct subsidies moving from 1.4% GDP to virtually 0% between 1991 and 2000. Although the negative trend identified in the above countries is certainly plausible, the overall remaining level of subsidization after more than a decade of privatization is an open question mark. As a matter of illustration, calculation of the total net subsidies to public enterprises was carried out in the case of Uganda by the IMF10 for the years 1993-1998. The results show that net subsidies to public enterprises have slightly decreased from 3.5% of GDP in 1993 to 2.3% of GDP in 1998 and that indirect subsidies accounted for more than 70% of total subsidies to public enterprises. These ratios of net subsidies to GDP (2.7% on average) are quite large compared to health and education expenditures which averaged 3.5% of GDP during the same period. It turns out that only eight enterprises account for 90% of total net subsidies, including Uganda Railway Corporation, Uganda Commercial Bank, Uganda Electricity Board, Uganda Post and Telecommunications and National Water & Sewerage Corporation. Thus, despite the fact that more than one hundred companies were divested since 1991, it is hard to say that the net fiscal impact of privatization has been impressive, which offers another illustration of the illusion created by the number of privatization transactions. It is reasonable to assume, however, that there will be a net positive fiscal impact in the much longer run, i.e. when large state-owned utilities companies come into private ownership and stop benefiting from indirect subsidies.
The impact of privatization on tax revenue has been mixed at the microeconomic level This conclusion must be qualified in many respects, as it is actually very difficult to isolate the effect of privatization on tax revenues from fundamental changes in the tax regime or exogenous factors affecting tax revenue collection (weather, war etc.). Intuitively, privatization may lead to higher tax revenues for the government. This reflects both increased profitability and efficiency at the level of the private firm responding to market incentives and the fact that public enterprises often benefited from weaker auditing and tax collection efforts. On the other hand, from the point of view of tax administration, tax collection may be easier in a system dominated by few large SOEs than with many smaller private firms which may prove more skillful at evading taxes11. The existence of these two opposite effects has been quite clear in Sub-Saharan Africa. At the one end of the spectrum, JONES, JAMMAL & GOKKUR [1999] found in the case of Cote d’Ivoire that the
increased profitability of privatized firms led to additional tax revenue, accounting for 41% of net government benefits. At the other end of the spectrum, Tanzania illustrates the case of a tax base moving away from a large, easy-to-tax public sector to a largely informal private sector. According to Table 1, roughly 50% of SOEs have been privatized. However, what Table 1 does not reveal is that the tax base has been eroding in the second half of the nineties, reflecting the fact that most private firms remained outside the tax net either because they operated in the informal sector or because they enjoyed various
10 IMF Staff Country Report 99/116, pp.43-51. 11 DAVIS, OSSOWSKI et alt. [2000], p.17.
exemptions12. Interestingly, between 1996 and 2001, the bulk of tax exemptions was granted to private companies (40% of total exemptions) and not to remaining parastatals. Overall, it appears that the major changes in the structure of taxation and tax administration reforms aimed at increasing tax collection introduced during the 1990s have contributed significantly to the slight increase in tax revenue recorded in most Sub-Sahara African countries. Although this may be a bold conclusion at this stage, it would seem indeed that privatization has been less decisive than profound tax administration reform for revenue performance.
These trends tend to suggest that it is perhaps an overstatement to present privatization as an obvious “fiscal opportunity”. Although the argument is theoretically valid in the long run, its amplitude is highly correlated with the level of pre-privatization subsidization and with the overall efficiency of the tax system in the short run.
Chart 9. Countries where the average sale value exceeded 1% of Government revenue (1991-2001) 0 5 10 15 20 Zambia Cape Verde Mozambique Ghana Senegal Tanzania Uganda Ethiopia Benin Côte d’Ivoire Cameroun Kenya Malawi
Percentage of Government Revenue (%)
Average sale salue
Average pivatization proceeds accruing to the budget
Notes: Government revenues exclude grants and refer to average revenue over the period.
• Data on privatization proceeds accruing to the budget should be considered with caution as there were many classification and definition problems in the early 1990s. As a result, data tends to be biased towards the latter part of the time period considered (i.e. 1996-2001).
• Data is often biased by some key transactions: the copper & cobalt transactions of the late 1990s substantially inflate Zambia’s rating. If such transactions were to be removed, average sale value would amount to 7.7% of government revenues during the period under consideration. In the case of Cape Verde, divestment from public utilities (telecom, electricity and water) and banks transactions largely inflate the figure. The sale of Ashanti Goldfields has the same effect on Ghana’s rating. In the case of Senegal, the rating is also biased by the sale of SONATEL (Telecom) and SENELEC (electricity) in 1997. Finally, Mozambique’s rating is sensitive to the very low average of Government revenue (11.3% of GDP).
Sources: World Bank Privatization Database, IMF Staff Country Reports, various years
Graph 10. Direct Subsidies to Public Enterprises 0 0.2 0.4 0.6 0.8 1 1.2 1.4 1.6 1991 1992 1993 1994 1995 1996 1995 1996 1997 1998 1999 2000 (% GDP) Average % GDP in 9 Sub-Saharan Countries
Sample countries: Burkina Faso, Ghana, Guinea-Bissau, Mauritania, Mozambique, Tanzania, Uganda, Zimbabwe, Zambia
Sources: IMF Staff Country Reports, various years
Chart 11. Uganda - Direct and Total Net Subsidies (1993-1998) 0 0.5 1 1.5 2 2.5 3 3.5 4 1993 1994 1995 1996 1997 1998
(% GDP) Direct subsidiesTotal Net Subsidies
Box 1. Looking for the best deal. The case of Zambia’s ZCCM copper mines
Zambia Consolidated Copper Mines Limited (ZCCM) was Zambia’s largest commercial enterprise,
generating more than 70% of the country’s foreign exchange earnings and contributing about 10% of GDP in the early 1990s. The main shareholders of the company were the Zambian government (60% of the shares) and the South African conglomerate Anglo American (27% of the shares). Although ZCCM was the fifth largest copper producer in the world, it was in dire financial condition and suffered from a chronic lack of investment, Between 1992 and 1996, the government examined a number of options to privatize ZCCM and initiated talks with Anglo American, the latter beingan essential partner as it also held preemptive rights to purchase any shares sold by the government once the government share fell below 50%. Even if Anglo American’s cooperation was perceived as essential for the success of any privatization proposal, there were also fears about the formidable influence Anglo could exert on the future of Zambia, were ZCCM to be entirely swallowed by Anglo. This concern was actually behind the 1994 Kienbaum report funded by the World Bank, which advised the unbundling of ZCCM assets13. After two years of internal debate and another study commissioned by the Zambian government, the unbundling strategy was finally adopted. The Zambia Privatization Agency (ZPA) took over responsibility for managing the ZCCM privatization and negotiations with interested investors started in 1997. Anglo American had all the way stated that the unbundling was not its preferred option, but it was willing to cooperate with government’s strategy. The first asset to go was the Luanshya Division to the RAMCOZ group for US$35 mn14, but only one bid was received for the largest package of sets. The bid, which came from the Kafue Consortium representing US, UK and Canadian companies, offered US$150 mn in cash plus committed investment of US$400 mn. This fell short of Zambia’s expectations. In the following months however, as the price of copper collapsed, partly because of the East-Asian crisis, the Kafue Consortium reduced its cash offer and demanded the inclusion of additional assets in the package. ZCCM operating losses were also mounting and the assets were deteriorating, lacking badly needed investment. Eventually, as ZPA became systematically bypassed by the Zambian government (who appointed the former CEO of ZCCM to lead the negotiations), discussions soured on book asset valuation and negotiations collapsed. By mid-1998, “ Anglo-American was the only suitable mining investor that continued to show lukewarm interest in ZCCM’s assets”15, but it took almost one and half more year to form a consortium including the International Financial Corporation (IFC) and the UK’s Commonwealth Development Corporation. The sale of what now constitutes KCM (the largest chunk of ZCCM) finally took place in March 2000, for US$30 in cash and committed investment of US$200 mn for the Konkola Deep16. Yet, in early 2002, Anglo American announced its intention to step out: accumulated losses since March 2000 were estimated at US$108m, partly because of plummeting copper prices and because the cost of developing Konkola had more than trebled from US$300m to US$1bn. Zambia is now back to square one, looking for a brave enough strategic investor to take over vastly outdated assets in the midst of a depressed copper environment.
The ZCCM story shows that the costs of delays in the privatization process turned the fiscal opportunity into a major financial disaster for the Zambian government. As part of the deal, the government had to assume ZCCM’s accumulated debts of about US$ 770 mn and had to grant generous tax incentives to investors. Ultimately, the drive for maximizing the transaction value has turned into a major financial and economic debacle.
13 CRAIG [2001], p.394.
14 The outcome proved a disaster as the firm collapsed shortly after the deal with RAMCOZ being placed into receivership. More details about this particular transaction are given in section 3c.
15 WORLD BANK [2002d], p.16.
b. Change in Enterprise Performance
Assessing enterprise performance post-privatization is a very challenging task, both methodologically and statistically. This is usually done either by comparing pre and post enterprise performances, or by trying to work out a counterfactual scenario under a “reasonable” set of assumptions (“what would have happened in absence of privatization?”). Unfortunately, there are very few rigorous studies dealing with Sub-Saharan Africa. For one thing, access to enterprises financial data is very limited and even when firms are willing to disclose information on post-privatization performance, there are often unable to provide pre-privatization data for comparison17. This situation is aggravated by the fact that in most situations, there is no post-privatization monitoring. Last but not least, privatizations often do not take place in a vacuum, but are part of an evolving macroeconomic framework where liberalization policies can affect enterprise behavior and financial performance18. External economic shocks such as a sharp reduction in commodity prices or more generally, a global economic downturn or boom, are also likely to affect enterprise performances, which makes the analysis very time sensitive. In such circumstances, assessing causality between privatization and enterprises performance is a difficult challenge.
Available studies (BENNEL [1997], CAMPBELL-WHITE & BHATIA [1998] and PAULSON [1999]) rely mostly on anecdotal evidence and on mail questionnaires to report some results on the ground, but no attempt has been made to date to measure financial and operating performance of newly privatized firms in Africa. BOUBAKRI & COSSET [1999] carried out a first analysis of privatized firms’ performance in Africa, but their sample is limited to 16 enterprises spread out between Ghana, Morocco, Nigeria, Senegal and Tunisia. Their results suggest a weak improvement in the profitability of newly privatized firms, and indicate that efficiency as well as output measured by real sales decreased slightly, while capital expenditure rose significantly in the post-privatization period. The limited sample, as well as the over-representation of firms from Morocco and Tunisia (65% of the sample) make it impossible to draw any conclusion from such results for Sub-Saharan Africa. However, three general findings can be derived from the existing country studies over the 1991-2002 period:
Privatization results have generally been positive in the manufacturing, industrial and service sectors.
Firm turnover and profitability have generally increased immediately following privatization –which is to be expected- but the evidence is mixed regarding the sustainability of the initial post-privatization upswing.
Notwithstanding measurement problems, private investment has generally increased following privatization relative to public investment.
These average results hide large performance variation across sectors and countries, which are associated with considerable variation in the country business environments. Although the evidence is still patchy, some country examples are provided in Box 2. From a business
17 CAMPBELL WHITE & BATHIA [1998], p.85.
18 An obvious example is the devaluation of the CFA Franc, in January 1994, which put tremendous financial pressure on those firms dependent on imports.
performance point of view, an important message is that privatization appears to have been a relatively successful “damage control exercise”. Against this background, the biggest question mark has to do with the sustainability of privatized firms over time. To some extent, the private investment picture in most countries also signal a more or less bell-shape trend (see Chart 12), which may indicate that the volume of private investment so far realized does not suffice to fulfill the objective of using privatization as a catalyst to private sector activity. This is hardly surprising given the fact that most countries have only recently started to divest from the larger infrastructure firms and other “strategic” sectors.
More fundamentally, the existence of a small number of outright failures and scandals has definitely affected the general public’s perception of the economic impact of privatization. For instance, even if the overall privatization program of Zambia is often described as a model case and a “success”19, the most of important sector of the economy (copper) has gone through a very messy privatization process involving scandals and eventually the pulling out of the private buyer after two years of operation in the case of the most important mines20.
Chart 12. Aggregate Ratio of Private to Public Investment in Sub-Saharan Africa21 0 0.5 1 1.5 2 2.5 3 3.5 19911992 1993 19941995199619971998 199920002001
Source: IMF Staff Country Papers, various years
19 See CAMPBELL-WHITE & BATHIA [1998], pp.111-113. 20 See Box 1.
21 Private sector definition is not uniform across Sub-Saharan Africa and SOE investment is often reported as “private investment”. As a result, private investment figures are notoriously inflated in some countries, which makes it very difficult to identify reliable trends over time. In Chart 12, 24 countries were used but only 10 of them exclude SOEs in private investment figures.
Box 2. Enterprise performance post-privatization. Some country evidence
In Cote d’Ivoire, an impact study applied to 81 privatizations (JONES, JAMMAL & GOKGUR [1999]), covering not just infrastructure firms but a range of firms already operating in competitive markets (in agriculture, agro-industries, tradable and non-tradable sectors) concluded that firms performed better after privatization and that they performed better than they would have had they remained under public ownership. The study also found that the set of transactions as a whole contributed positively to economic welfare, with annual net welfare benefits equivalent to about 25% of pre-divestiture sales. These results stemmed from a number of effects, including increases in output, investment, labor productivity, and intermediate-input productivity. Available studies do not point to major failures in the privatization program, but a number of questions remain with respect to competition (cocoa sector) and regulation (electricity, telecommunications), as there are claims that public monopolies were simply replaced by private monopolies.
In Mozambique, a 1996 impact study over 91 firms across the country found that following privatization, most of the enterprises in the sample could be characterized as showing an overall improvement in their performance based on increases in sales, production levels, number of employees and salaries paid. Another study covering 152 firms in the manufacturing sector between 1992 and 1998 found similar results in terms of labor productivity, investment and sales growth, although new entrants seemed to be better than privatized firms in terms of sales growth, job creation and contribution to investment22. A flagship of the privatization program is that of
Cervejas de Moçambique (CDM), a brewery company created following the privatization of the
three local breweries in 1995. Production tripled between 1995 and 1998. One of the major failures of the program is certainly that of the privatization of Banco Commercial de Moçambique in 1996, which was completed despite major concerns about the only bidder, a Portuguese consortium. Soon after, the bank was in trouble because of fraud, large loans to connected parties and problems with the pre-privatization portfolio resulting from poor regulations and lax supervision and political pressure to lend to “well connected” parties, and had to be recapitalized in 2001.
In Tanzania, a study by an independent auditing form for the Parastatal Sector Reform Commission (PSRC) compared indicators before and after privatization, based on the results of a survey at the end of 1998. The study found that on average, companies showed an increase in productivity and investment post-privatization23. Another study, covering 18 newly privatized firms in various manufacturing, services and industrial sectors, revealed mixed profit performance in the first years following privatization24. In many instances, amounts and status of parastatal debt greatly affected and complicated profitability measures.
22 See BIGGS, et alt. [1999], pp.11-21.
23 “Tanzania: Selected Issues & Statistical Appendix”, IMF Country Report 03/2, January 2003, pp.96-97. 24 DUE, TEMU & TEMU [2000].
Box 2. Enterprise performance post-privatization. Some country evidence (continued)
In Zambia, a 2001 survey of 56 privatized firms (including the largest 20 privatized enterprises and a sample of smaller companies) found that the turnover of most enterprises increased in the two years immediately following privatization, and that firms were generally slightly better off for years after privatization despite a depressed business environment25. However, for many of the typically smaller and local market oriented enterprises, the initial post privatization upswing in turnover has not been sustained. The study concludes that the program achieved an important measure of “damage control” since only 19 firms (out of 254) had failed since privatization Among the flagships of the privatization program are the cases of Zambia Coffee and Zambia Brewery, which have both expanded production and investment massively since privatization. But the program’s darkest spot is certainly that of the Copper Mining Company ZCCM, which was finally privatized in 2000 after 5 years of procrastination. The debacle began with the collapse of RAMCOZ in 1999 including retrenchment scandals, and followed with the pulling out of Anglo-American from ZCCM in 2002. These problems seriously tarnished the privatization picture given the importance of the copper sector in Zambia.
In Ghana, partial studies show a general growth in the divested companies, particularly those in the mining, manufacturing and services sector between 1992 and 199826. In the mining sector for instance, the profit ratio to sales increased by 950%. A 1999 survey of 47 newly privatized firms showed that privatization also helped increase the volume of investment in the divested sectors through the introduction of new equipment and major rehabilitation of production plants which would not otherwise have taken place. Pooled data from 32 firms over the 1986-1995 period show that the financial performance of private firms both in terms of return on assets and return on sales was stronger than in state-owned enterprises, although other factors also played a role in explaining financial performance27. Among the flagship cases is the privatization of Ashanti Goldfields Company (AGC), which was able to tap into international capital markets to fund investment in new equipment and technology following state divestiture. As a result, gold production rose substantially while production costs declined over time. Other sectors, such as the “strategic” oil sector, have been much more difficult to deal with, but the most striking failure of the program is the privatization of Ghana Telecom (GT) in 1997, sold to Malaysia Telekom. Ghana was among the first African markets to see the partial privatization of a state-owned fixed carrier and the introduction of competition in the basic services market in 1997. Although GT’s financial performance has improved since its privatization, the company failed to meet cumulative network deployment targets, overall quality of service has remained low, with Ghana remaining one of the few African markets with more fixed than mobile users. This failure is first and foremost that of a disorganized market framework that led to the licensing of multiple operators using various technology standards, confusing Telecom sector policy, and ineffectual regulatory oversight. It was labeled as a “case study in how not to liberalize a market”28.
25 WORLD BANK [2002d]
26 See APPIAH-KUPI [2001] and OPOKU [1999]. 27 BAVOn [1998], pp.53-72.
Box 2. Enterprise performance post-privatization. Some country evidence (ctd)
In Nigeria, a survey over 34 firms conducted by the Nigerian government revealed that the performance of the enterprises improved markedly compared to their status before privatization29. For instance, the average turnover of the companies increased by 221%. A further assessment of profitability of these enterprises using return on investment showed positive post privatization growth for most companies as 19 or 55.9 percent of the companies recorded more earnings after privatization from funds invested. A look at the investment turnover also revealed that most of the companies (62%) experienced increases in the ratio of turnover to capital employed.
In Sénégal, a WORLD BANK [1995] study concluded that the collective performance of privatized firms deteriorated after privatization in terms of net operating surplus and profits before taxes, real variable costs and total factor productivity. In the second half of the 1990s, the privatization of its major utilities (telecom and water in 1996, electricity in 1999) have been more positive in terms of profitability at the firm level, but the cases of water and electricity have not yielded the expected results in terms of performance, access and prices.
In Uganda, firm surveys indicate that privatization has led to increased industrial capacity utilization and profitability. Capacity utilization of the privatized firms has increased by 11% according to some reports, with the more spectacular growth recorded in the beverage industries. NGO reports also indicate that privatization has led to increased supply of quality good and services to the market, especially essential commodities (sugar, salt, soap), which prior to privatization were in short supply30. Among the flagship cases is the opening up of the Telecommunication sector in 1998 when a second network license was won by Mobile Telephone Networks of South Africa (MTN). At the other side of the spectrum is the case of the Uganda
Commercial Bank in 1997, which had to be placed under government management again two
years after its privatization owing to a huge governance scandal (see Box 4).
In some other countries, evidence about post-privatization performance is patchier, which reflects the fact that some important transactions took place very recently. In Cameroon for instance, privatization only gained momentum after 1998, when the focus shifted to large agro-industrial and transportation enterprises and the public utilities. Even so, only a very limited number of deals were effectively finalized (among which, the sale of the electricity company SONEL in 2001) and post-privatization performance assessment is still in its infancy. Anecdotal evidence reveal significant problems with electricity supply since privatization, but no detailed study exists to date The only sector subject to monitoring is the financial sector, following its restructuring from 1996 to 1998. All commercial banks in Cameroon have been privatized or liquidated, show satisfactory management ratios, and are now solvent, liquid and profitable.
29Abuja Mirror, January 19-25, 2000. See also International Privatization Review 2001, pp.116-117. 30 SAPRI [2001].
c. Impact on Employment
One of the most common fears associated with privatization worldwide is certainly job destruction. Given the size of the public sector in Sub-Saharan Africa, similar fears have and continue to be nurtured. Here again, data is scarce and incomplete, and exhibits large variation across sectors and countries. Available studies and information point to the following observations:
Employment has been adversely affected mainly in the period leading up to privatization or in case of liquidation
Even if the work force of privatized/liquidated firms diminished in relative terms, there has not been massive layoffs in absolute terms. In some countries, retrenchment packages have become a serious issue, however.
Although the general trend is a continuous decline in employment levels over time, there are a few cases where employment increased in the years following privatization, reflecting good performance and new business opportunities
The first observation reflects the expected pre-sale “cleaning up” of many parastatals, where overstaffing and redundant labor force was a major issue.
The second observation reflects the fact that first and foremost, government have deliberately delayed privatizing enterprises where a high social cost could be expected31, which also explains why privatizations have targeted by and large small and medium-sized SOEs. In Zambia, employment of the privatized non-mining sector declined by about 30% between 1992 and 2001, and by about 20% in the mining sector. Interestingly, although the layoffs were largely concentrated in the earlier years, employment declined on a continuous basis until 2001. In Tanzania, partial data obtained from a sample of privatized enterprises indicated that employment declined by 30-50%32,
with sizable firm variation. In Benin, overall employment in the companies declined by 36% between 1990 and 1996. In Mozambique, the decline in employment has been fairly small, at least in the manufacturing sector, i.e. about 0.8% between 1992 and 1997. These partial results are more anecdotal than anything else, as no systematic study has been conducted on the employment trend of privatized companies over a sustained period of time. As for firm performance, it is perhaps best to describe the employment effects in terms of “damage control” for the time being.
Workers and trade unions opposition to privatization has been a major factor behind the delay of the privatization process in a number of countries, and more particularly in Ghana, Malawi and Tanzania in the mid-1990s. This has resulted in harsh negotiations about retrenchment benefits, which have not only deterred potential investors but also exhausted a sizable portion of privatization receipts in a number of cases. In some countries (e.g. Benin, Mozambique, Zambia), employment guarantees have been used as bidding conditions, with various degrees of success. The best-known failure in imposing employment guarantees is the case of the Luanshya and Baluba copper mines in Zambia. Although it was assessed in 1998 that up to 3000 workers would become redundant under any reasonable business plan, the private company RAMCOZ agreed to take over the
31CAMPBELL WHITE & BATHIA [1998], p.95. 32 DUE, TEMU & TEMU [2000].
mines and not to dismiss any of the 7000 workers. Shortly after the deal, RAMCOZ laid off 3000 workers and failed to make termination payments. When the company went out of business in 1999, the remaining 4000 workers joined the unemployed. Eventually, the Zambian government had to pay partial compensation to the workers, but the case is still not finalized as of mid-2003.
Another example of the retrenchment issue is the management contract for the electricity utility in Tanzania, TANESCO, in May 2002. In the context of an ad hoc system of widely varying retrenchment payments, TANESCO workers prevented the members of the new management team from entering their offices, pending an agreement on a generous retrenchment package with the government that would cost more than 1% of GDP. Although the new management team eventually took over the company, no agreement between the government and the workers has been reached to date33.
The third observation is perhaps the most encouraging, since it suggests that after the initial shock on employment as a result of privatization, some firms were able to expand. In Ghana for instance, employment in divested enterprises went up by 59%, and enterprises such as Golden Tulip Hotel, Ghana Agro-Food Company or Tema Steel Company have all achieved employment increase rates beyond 100%34. In Cote d’Ivoire, employment in privatized firms increased by an average of 3.9% per year after privatization while falling by almost 2% per year prior to privatization according to a 1999 study of 81 privatizations35. In Burkina Faso, employment in privatized firms has also marginally increased following privatization between 1993 and 1999. Such examples remain the exception rather than the rule, although the general trend is a continuous albeit less pronounced decline in employment over time.
Lastly, it is important to note that there are very limited information available about employment benefits, making it extremely difficult to assess post-privatization evolution of wages and salaries at this stage.
One very general conclusion can be drawn from this limited discussion: the impact of privatization on employment has been by and large postponed in most countries, as most of the overstaffed SOEs remains to be privatized. The ongoing privatization of large SOEs, mainly public utilities, may change the picture in the near future. As a result, despite the fact that the decline in employment may appear to be high in some privatized firms in percentage terms, absolute numbers of retrenched personnel remain fairly low. One possible exception to this conclusion is Zambia, where several thousands of jobs have been lost in the mining debacle as well as in the privatization of public transportation services. d. Impact on FDI and Local Capital Markets
Privatization programs have attracted foreign direct investment in most countries, particularly in connection with some large transactions such as the Ashanti gold mine in
33 IMF, “Tanzania: Selected Issues & Statistical Appendix”, IMF Staff Country Report 03/2, January 2003, p.98.
34 APPIAH-KUBI [2001], p.217.
Ghana or the ZCCM copper mines in Zambia. However, privatization-related FDI in Africa has remained fairly small by international standard: during the first half of the 1990s, privatization-related flows represented a mere 5% of total FDI on average, versus 43% in Eastern and Central Europe and 15% in Latin America36. With the exception of 1997 and 1998 when important services companies (e.g. Telecom Cote d’Ivoire, SONATEL in Senegal) were privatized, the situation is likely to be only marginally better in the second half of the 1990s. Although data on privatization-related FDI is scarce, it can be seen from Chart 13a below that net FDI flows to Sub-Saharan Africa were 50% higher in the second half of the 1990s although the total transaction value was 30% higher on average than during the first half of the 1990s. Even when South Africa and Angola are removed from the sample, which together attract 65% of total FDI in Sub-Saharan Africa, the picture does no fundamentally change (Chart 13b). Among the reasons behind the limited role of FDIs in the privatization process already identified by earlier studies, the most important seems to be the lack of opportunities for foreign investors. As noted earlier, in most countries, the bulk of divested firms consisted of small and medium sized enterprises, with few “big tickets” beyond the mining sector and former public utilities.
Chart 13. Net Foreign Direct Investment and Privatization Transaction Values (US$mn)
a. Sub-Saharan Africa b. SSA excluding South Africa & Angola
0 1000 2000 3000 4000 5000 6000 7000 8000 1991 1992 1993 1994 1995 1996 1997 1998 1999 2000 2001 Privatization FDI 0 1000 2000 3000 4000 5000 6000 7000 8000 1991 1992 1993 1994 1995 1996 1997 1998 1999 2000 2001 Privatization FDI
Source: Global Development Finance 2003
What about capital market development? Privatization and capital markets are interdependent, as stock exchanges can be used to mobilize domestic and foreign capital for privatization while the off-loading of SOE’s shares can boost local stock exchanges. With privatization, market capitalization is expected to increase, and so is the volume and value of stocks traded. Given the very low development of financial markets in Sub-Saharan Africa (except in South Africa and to a lesser extend in Zimbabwe), how have stock markets and privatization programs been connected? Evidence to date point to two general conclusions:
Stock markets have played a limited role in privatization transactions despite some showcase transactions
Some privatizations have stimulated embryonic stock market activity in the short run
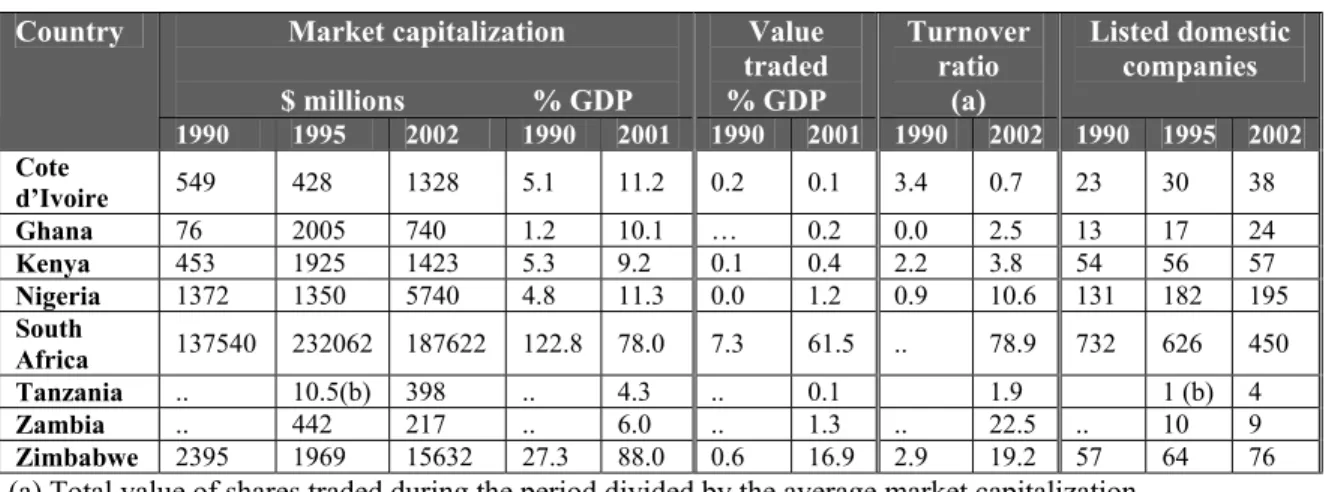
The first finding is not really a surprise, as it reflects the embryonic state of financial markets in many African countries. There are about 15 stock exchanges in Sub-Saharan Africa37, the bulk of them being very small both in terms of GDP share and turnover. In 1998, the government of Tanzania sold 26% of the shares of Tanzania Breweries Ltd through the newly established Dar es Salaam Stock Exchange. This was the only privatization carried out entirely through the stock market. The market remains very small, however, with only 4 companies listed. In Ghana, a number of state-owned enterprises, including all the banks, were sold through public share offers on the stock exchange. Interestingly enough, some large companies such as Ghana Telecom and Ghana Oil Company have not been allowed to be privatized on the stock market. Capitalization of five former SOEs alone accounted for 75% of total stock exchange capitalization in 1998. In Cote d’Ivoire, the privatization program had a substantial impact on the growth of the Abidjan Stock Exchange (BVA): privatized companies have constituted the main source of new additions to the BVA since 1993. The regional stock market (Bourse Régionale des Valeurs Mobilières), which replaced the BVA in 1998, also played an important role in allowing Senegal’s privatized telecom company SONATEL to have access to finance, but still lacks depth and liquidity, as only an handful of shares are truly dynamic. The second finding reflects the fact that some key privatization transactions have indeed boosted the otherwise non-existent stock-market activities for a limited period of time, but as can be seen from Table 5, the effect on market capitalization is especially manifest for the 1990-1995 period but less for the 1996-2000 period, especially in terms of value traded.
Table 5. Capital Markets Indicators (1990-2002) Market capitalization $ millions % GDP Value traded % GDP Turnover ratio (a) Listed domestic companies Country 1990 1995 2002 1990 2001 1990 2001 1990 2002 1990 1995 2002 Cote d’Ivoire 549 428 1328 5.1 11.2 0.2 0.1 3.4 0.7 23 30 38 Ghana 76 2005 740 1.2 10.1 … 0.2 0.0 2.5 13 17 24 Kenya 453 1925 1423 5.3 9.2 0.1 0.4 2.2 3.8 54 56 57 Nigeria 1372 1350 5740 4.8 11.3 0.0 1.2 0.9 10.6 131 182 195 South Africa 137540 232062 187622 122.8 78.0 7.3 61.5 .. 78.9 732 626 450 Tanzania .. 10.5(b) 398 .. 4.3 .. 0.1 1.9 1 (b) 4 Zambia .. 442 217 .. 6.0 .. 1.3 .. 22.5 .. 10 9 Zimbabwe 2395 1969 15632 27.3 88.0 0.6 16.9 2.9 19.2 57 64 76
(a) Total value of shares traded during the period divided by the average market capitalization (b) 1998 value, i.e. at the opening of the Dar es Salaam Stock Exchange
Source: World Development Indicators 2003
37 At the local level: Botswana, Cameroon (not yet effective), Ghana, Kenya, Namibia, Malawi, Mozambique, Mauritius, Nigeria, South Africa, Swaziland, Tanzania, Uganda, Zambia and Zimbabwe. At the regional level: Cote d’Ivoire (UEMOA) and Gabon (CEMAC, in preparation).
e. Impact on Ownership
The issue of local versus foreign participation in privatization deals is highly political in many countries as it is linked both to the general public’s acceptance of privatization policies and to transparency and governance issues. In several countries, business groups have criticized the prominent role of foreign companies in the privatization and denounced “economic recolonization”38. In fact, nationality issues have become an extremely hot political issue especially in Eastern and Southern Africa countries39, in contrast to West Africa where the debate has been less emotional. Broadening local participation has sometimes been a decisive element in certain transactions, but it has never been an explicit strategy in Sub-Saharan African countries. In fact, several privatization deals in Eastern Africa involved sales of investments in companies with preemptive rights of existing shareholders or sales on non-competitive terms40, which seems to be in contradiction with the desire to broaden ownership. One obvious reason behind the absence of a clear strategy regarding the broadening of ownership is the very limited access of domestic investors to finance. Another is the lack of management expertise in sensitive sectors. As stated before, there have been some attempts to deal with the ownership question in the context of a number of transactions: in Kenya, when KLM bought 26% of the shares of Kenya Airways in 1996, shares were also listed on the London and Nairobi Stock exchanges, with both offerings oversubscribed. Kenyan investors acquired 34% of the shares, international investors took 14%, the airline employees enrolled in a special program to purchase 3% while the government of Kenya retained 23%. It is estimated that as many as 110’000 different shareholders participated in the domestic offering41. Other examples include Uganda, with the ownership scheme involving farmers of the Uganda Tea Growers’ Corporation (UTGC) and Zambia’s Privatization Trust Fund established in 1994 as a vehicle for selling public minority shareholdings once the majority of shares have been sold by the Zambia Privatization Agency to core private investors. With this caveat in mind, the following observations can be made about the impact of privatization on ownership:
Local entrepreneurs have bought the vast majority of small and medium sized SOEs Large SOEs in the “strategic” sectors (e.g. mining, public utilities) have almost invariably been taken over by foreign investors. As a rule, the larger the transaction value, the higher the involvement of foreign investors42
Whenever nationals purchase a public enterprise, they are more likely to buy it on credit than on a cash basis, compared to foreign buyers, with potential default implications43
38 HARSCH [2000], p.8
39 See TANGRI [1999], pp.54-61.
40 Kenya offers a compelling case in this respect with 51% of transactions were in the form of preemptive rights sales between 1991 and 2001.
41 MAKONNEN [1999], pp16-17. 42 See CRAIG [2002], p.13.
43 See BENNELL [1997], op.cit. p.1797; “Ghana: Selected issues”, IMF Country Report Nr.2, January 2000, p.90.
f. Regulation and Competition
Market structure, competition and regulation frameworks clearly matter in the privatization process. In competitive sectors, “competition” is not necessarily a trivial outcome depending on the original market structure and the sequencing of reforms, and requires a proper framework. In non-competitive sectors, such as some infrastructure monopolies like water distribution or power distribution, enterprise privatization is tantamount to privatizing the sector in which is operates. Adequate regulation is therefore crucial for the proper functioning of the sector. In all cases, the conventional wisdom is that competition and regulation should be dealt with before any final decisions are taken on the ownership question44. The main argument here is that privatizing first and regulating later does not constitute a first-best option from an economic standpoint, and instead tends to strengthen vested interests, complicates subsequent regulations, leads to “regulation capture” and may seriously curb effective competition. In the telecom sector for instance, empirical research indicates that competition gains are higher in countries where regulation has been addressed prior to the introduction of competition45. SHIRLEYet al.. [2002b] also insists on
the “reputation advantage” of setting up the regulator beforehand.
One would a priori think that regulatory and competition issues are even more decisive for the post-privatization business environment in Sub-Saharan African economies, where most sectors have generally been either oligopolistic or monopolistic, and operated with information asymmetries and poor institutional frameworks. With widespread private participation in public utilities and infrastructures across the region (as shown in Table 6), how have these issues been dealt with in Sub-Saharan Africa. Available evidence point to two general findings.
In the first half of the 1990s, neither the regulatory framework nor the competition framework was developed as an integral part of the reform
In the second half of the 1990s, when large utilities were privatized in some countries, although regulatory frameworks were put in place, enforcement problems have limited the effectiveness of both regulation and competition in several countries.
The first conclusion, which is very blunt, was reached unambiguously by CAMPBELL-WHITE
& BATHIA [1998] (p.48), and indicates that the issues of competition and regulation have almost systematically come as a painful afterthought. In most countries, privatization was pushed ahead before a sound regulatory framework was in place, which both prejudiced the process of privatization itself and laid it open to the charge of creating private monopolies which would exploit the consumer. The very same argument holds for competition, as it turns out that there are no anti-trust legislation in most African countries, which favor cartel arrangements and abuse of economic position. In Ghana for instance, it appears that the privatization program focused on economic considerations but paid little attention to establishing credible regulatory institutions. Apart from a free trade policy, the government had no policy on either competition or regulation46, and the guidelines on
44 GUISLAIN [1997], p.212.
45 WALLSTEN [2002]. See also FINK, MATTOO & RATHINDRAN [200] for further analysis of sequencing. 46 See APPIAH-KUBI [2001], p.223.