The Effect of Family Shareholders on Firm Leverage
Shu-hui Lin*
Department of Business Education, National Changhua University of Education
JEL classification: G30, G32, G34
*
Address for correspondence: Department of Business Education, National Changhua University of Education, 2, Shi-Da Rd., Changhua 500, Taiwan. Tel: 886-4-7232105 ext. 7135; Fax: 886-4-7211162; E-mail: shlin@cc.ncue.edu.tw (Shu-Hui Lin)
The Effect of Family Shareholders on Firm Leverage
Abstract
In this study, we explore the relation between family shareholders and debt usage decisions by examining the effects of family ownership, control, and management on financial leverage. We find family ownership, control, and management have differential effects on financial leverage. Moreover, our results show that when suffering serious agency problems of debt, firms with higher family ownership operate at a higher level of debt, while those with higher family control and with family management operate at a lower level of debt. Our findings suggest that high family ownership helps to align the interests of controlling families and debt holders. However, family shareholders with tight control over a firm and occupying the CEO position have a detrimental effect on the relation between the families and creditors.
The Effect of Family Shareholders on Firm Leverage
I. Introduction
In firms with widely dispersed ownership managers have a great deal of discretion over corporate policies and a large amount of research has documented how they influence corporate financial leverage (e.g., Noe and Rebello, 1996; Berger, Ofek, and Yermack, 1997; Novaes, 2003; Ag(ca and Mansi, 2008). On the other hand, recent literature shows that around the world family firms are as common among public corporations as widely held firms (La Porta et al., 1999; Claessens et al., 2000; Faccio and Lang, 2002). Controlling families are at least as powerful as managers, and their distinctive attributes, such as undiversified family holdings, the desire to pass the firms onto their descendents, and concerns for the family’s reputation, provide substantially different incentive structures when compared to those of non-family managers (Anderson et al., 2003). However, the literature has paid relatively little attention to if and how controlling families affect capital structure.
In this study, by examining the effects of family ownership, control, and management on financial leverage, we explore the relation between family shareholders and debt usage decisions. Family ownership, control, and management
are three fundamental aspects that can show how a family shareholder is involved in a firm’s operations. Villalonga and Amit (2006) suggests that the three elements have a differential effect on a firm’s value. Following their arguments, we posit that family ownership, control, and management may impact corporate financial leverage in different ways. Several recent studies suggest that family shareholders influence debt-financing decisions, but none takes into account concurrently the effects of family ownership, control, and management. Anderson et al. (2003) examines the effects of family ownership and management on the cost of debt financing but does not distinguish ownership from control. Romano et al. (2000) and Du and Dai (2005) show that the preference for maintaining control by family shareholders has a positive relation on a firm’s leverage; however, they do not examine the effects of family ownership and management.
Using a sample of listed family firms in Taiwan, we find evidence that family ownership, control, and management have differential effects on financial leverage. Moreover, we find that the three elements interact with agency problems of debt to influence the level of debt financing. Our results show that when suffering serious agency problems of debt, firms with higher family ownership operate at a higher level of debt, while those with higher family control and with family management operate at a lower level of debt. The evidence suggests that whether the presence of
controlling families can mitigate the conflicts between shareholders and debt holders depends on how controlling families involve themselves in a firm’s business. High family ownership helps to align the interests of controlling families and debt holders. However, family shareholders with tight control over a firm and occupying the CEO position have a detrimental effect on the relation between the families and creditors.
Previous research suggests that the presence of family shareholders not only can create value for a firm, but also can destroy a firm’s value (Claessens et al., 2002; Villalonga and Amit, 2006; Lin and Hu, 2007). Our study complements these works by showing that family shareholders can not only bring benefits to the shareholder-debtholder relation, but also have a detrimental effect on the relation. Our results are consistent with Villalonga and Amit (2006) and suggest that whether family shareholders decrease the conflicts between shareholders and creditors depends on the features of the familial involvement in the three areas (i.e., family ownership, control, and management).
II. Hypothesis Development
Controlling families have the ability to influence corporate policy and make financing decisions to pursue their own interest. Maintaining control over a firm is one of a
controlling family’s main concerns (Chrisman, Chua and Litz, 2003). Families can use debt financing in place of issuing equity to avoid sharing ownership. If a family can obtain a lower cost of debt1, it will also increase a firm’s reliance on debt financing. On the other hand, a controlling family may be more risk averse and may mitigate firm risk by employing less debt in a firm’s capital structure (Anderson and Reeb, 2003).
Three aspects of a controlling family’s characteristics (i.e. ownership, control, and management) may affect a firm’s leverage and its reliance on debt. Information asymmetries exist between controlling families (insiders) and lenders. Family ownership can serve as a signal of a firm quality to the lending market, showing the true quality of the firm (Leland and Pyle, 1977). High ownership by a family reflects a firm’s positive attributes, which can alleviate the problem of information asymmetry and lower the cost of debt. In addition, high ownership is positively related to families’ concerns for long-term survival (Le Breton-Miller and Miller, 2006), which can mitigate the conflict of interest between shareholders and debt holders (Anderson, Mansi, and Reeb, 2003). If creditors view high ownership by controlling families as a mechanism that better protects their interests, high family ownership will lead to a higher debt ratio. On the other hand, undiversified shareholdings of families may
1
Anderson, Mansi, and Reeb (2003) finds that family ownership is related to a lower cost of debt
motivate families to mitigate firm risk by seeking capital forms with low probability of default, which indicates less use of debt financing (Anderson and Reeb, 2003). From the perspective of risk aversion, family ownership would be negatively related to financial leverage. Ultimately, the influence of family ownership on firm leverage is an empirical issue. We expect that the positive effect of family ownership on debt levels will be stronger when a firm suffers a serious agency problem of debt.
The desire to have control over a firm differs among family shareholders. To retain control, family shareholders may actively place limits on the use and the growth of equity by debt financing (Hutchinson, 1995; Berger and Udell, 1998). The desire to keep control in the family has a positive effect on a firm’s use of debt, as the stronger desire to retaining family control should be associated with stronger reliance on debt financing. On the other hand, family shareholders may enhance their power over the firm through crossholdings and/or taking control of the board of directors (Claessens, Djankov, Fan, and Lang, 2002; Yeh, 2005), which may lead to a higher agency cost of debt. Families using these mechanisms to enhance their control are apt to be less concerned about a firm’s future and more likely to extract resources from the firm at the expense of minority shareholders and debt holders (Yeh, 2005; Le Breton-Miller and Miller, 2006). Creditors may view a strong desire to retain control by a family as a sign that the family is more likely to expropriate debt holder wealth, resulting in a
negative effect of family control on the use of debt financing. The desire for family control has two opposite effects on a firm’s debt ratio. We expect that the negative effect of family control will increase with the agency problems of debt that characterized a particular firm.
Agency theory suggests that debt can alleviate the conflicts of interest between shareholders and managers. Debt creation, requiring a firm to make future interest and principle payments, reduces the resources under management control. When hiring non-family members as CEOs, controlling families can use debt financing to weaken the CEOs’ power and prevent them from wasting resources on low-return projects (Grossman and Hart, 1982; Jensen, 1986). Hence, the presence of a non-family CEO may motivate family shareholders to increase the reliance on debt financing (i.e. less use of debt when the CEO is a family member). Furthermore, if family shareholders choose a CEO from among family members (i.e. a restricted labor pool), the less competent CEO, compared to outside managers, will lead to a poorer operating performance (Johnson et al., 1985; Morck et al., 1988). Anderson et al. (2003) indicates that creditors may view family management as detrimental to their wealth, which increases their conflict with the family and may result in less use of debt. Overall, family management has a negative relation to financial leverage. We expect that when firms suffer a greater agency problem of debt, the negative relation
will be stronger.
III. Sample and Data Description
Sample
For our investigation, we use family firms that are listed in Taiwan during the period from 1991 to 2000 as the sample. The financial market in Taiwan is characterized by weak protection for investors2. Ownership concentration of Taiwanese companies is high and family control is significant, which is similar to other emerging markets (Lemmon and Lins, 2003; Claessens et al., 2000). We follow Morck and Yeung (2004) to distinguish family firms using the following criteria: (1) the largest shareholder in a firm is a specific family, and (2) the voting rights of that family are not less than 10%. Because the controlling shareholder of a Taiwanese firm usually uses pyramid structures and/or cross shareholdings to separate the voting rights from the cash-flow rights (Claessens et al., 2000; Yeh et al., 2001), we follow the ultimate control concept proposed by La Porta et al. (1999) to trace the largest shareholder. We collect
2
Taiwan is a German-civil-law country. According to the investigation of La Porta et al. (1998), The
score for anti-director rights is 3 for Taiwan, compared to the score 5 for United States. The average
country score for five legal enforcement variables is 8.08 for Taiwan, compared to the average score
9.52 for United States. The rating on accounting standards is 65 for Taiwan, compared to the rating 71
ownership data from company prospectuses and “Business Groups in Taiwan”, published annually by the China Credit Information Services3. We obtain accounting information and stock data from the Taiwan Economics Journal (TEJ) database.
There are 575 listed non-financial firms in Taiwan during the 1991-2000 periods. We exclude financial services industry because government regulations potentially affect firm debt ratio and ownership structures. We reduce the sample by eliminating firms with incomplete data and there remain 2,028 firm-years, containing 375 firms. After distinguishing family firms by the criteria proposed by Morck and Yeung (2004), we finally end up with a sample of 1,063 firm-years, containing 232 firms. It shows that 61.87% (= 232/375) of the listed non-financial firms in Taiwan are controlled by families during the 1991-2000 periods.
Primary variable measures
We introduce four variables to account for the features of the controlling family. We follow previous literature to compute the cash-flow and voting rights of the controlling family (La Porta et al., 1999), and measure family ownership as the cash-flow rights of the controlling family. A controlling family often enhances its
3
In Taiwan, the Securities and Exchange Act requires publicly listed companies to file with the
competent authority and announce to the public the class and number of shares held by its directors,
control over a firm using cross-holdings and/or pyramid structure, which leads to a separation of cash flow from voting rights, and control over the board of directors (Claessens et al., 2002; Yeh, 2005). We employ “Separation of ownership and control” and “Affiliated directors” as the indicator of a family’s desire to maintain control over a firm. We define separation of ownership and control as a binary variable, which is equal to one if a family’s share of voting rights is higher than its share of cash-flow rights, and zero otherwise. Affiliated directors are a percentage of all the directors who are members of the controlling family4. The fourth variable “Family CEO” is also a binary variable, which equals one when a CEO is a member of the controlling family and zero otherwise. We include Family CEO to investigate the impact of family management on debt ratio.
We measure a firm’s leverage by the ratio of book value of debt to total assets. To investigate whether the relation between debt and the controlling family changes with the extent of the agency problem of debt, we employ two variables: R&D intensity and market-to-book ratio of assets, to measure a firm’s agency problem of debt. A firm with high R&D intensity and market-to-book ratio of assets usually has large growth opportunities whose value depends on future discretionary investment by the firm (Myers, 1977; Smith and Watts, 1992; Adam and Goyal, 2008). Myers (1977)
4
points out that financing with debt will make a firm pass up valuable investment opportunities, which will reduce the present market value of a firm. Furthermore, high R&D intensity and market-to-book ratio of assets also imply more intangible assets, which are highly specialized and firm specific, and that will increase the difficulty of asset sales or liquidation when a firm renege on the debt contract (Williamson, 1988). R&D intensity is measured as the ratio of research and development expenses to total assets by percentage. Market-to-book ratio of assets is the sum of the book value of debt and the market value of equity divided by the book value of assets.
Control variable measures
We use several variables in our analysis to control for the impact of firm-specific characteristics on leverage. Numerous studies suggest that financial leverage is a function of firm size (e.g. Warner, 1977; Titman and Wessels, 1988). Firm size is measured by the natural logarithm of the book value of assets. Risk is another factor that has an association with firm leverage (Toy et al., 1974; Kale et al., 1991). Firms with a higher operating risk will have less capacity to sustain high debt ratios. We use the standard deviation of return on assets (ROA) during the previous five years to proxy for firm operating risk. Previous research suggests that a firm’s fixed asset ratio affects firm leverage (Scott, 1977; Titman and Wessels, 1988). We measure fixed
assets ratio as the sum of land, plant, and machinery value, and we scale the value by total assets. Opler et al. (1999) finds there is a significant relation between leverage and cash holdings. We measure cash holdings by the ratio of cash and marketable securities to total assets. We also include firm and year fixed effects in each regression to control for time effect and a firm’s unobservable characteristics.
Summary statistics
Table 1 reports the descriptive statistics for the sample firms. Included are the mean, median, standard deviation, and maximum and minimum values for the key variables in the analysis. The descriptive statistics show that the average ownership of the controlling family is 20.34% (18.14% median), and that 32% of family firms have a separation of ownership from control. A controlling family controls, on average, 40.49% (40% median) of directors. Over fifty percent of CEOs are related to controlling families.
The data also show that the average debt ratio for family firms is 38.67% (39.04% median), with a standard deviation of 15.04%, and a maximum and a minimum ratio of 89.62% and 4.95%, respectively5. The data reveals that there is substantial cross-sectional variation in the debt ratio of family firms. R&D intensity
5
The 10th percentile of the debt ratio in our sample has a value of 17.99%, and the 90th percentile has a
has a mean of 0.78% (0.11 median), and a standard deviation of 1.40%. The mean market-to-book ratio of assets is 1.79 (1.58 median), with a standard deviation of 0.94. Furthermore, the average firm risk is 4.34% (3.40% median). Firm size has a mean of 15.65 (15.54 median). On average, the fixed asset ratio is 35.92% (35.33% median), and the ratio of cash holdings is 9.83% (6.30% median).
Table 2 provides a simple correlation matrix for the variables in our analysis. Among the four variables of a controlling family’s features, family ownership and separation of ownership and control have a significantly negative relation. The proportion of affiliated directors has a significantly positive relation to the separation of ownership and control. This is consistent with previous arguments that control over the board and separation of ownership from control are important methods by which a controlling family enhances its control over a firm. In addition, there is a significantly positive relation between affiliated directors and the presence of a family CEO. The data also show that the debt ratio has a moderate relation to the family features of the controlling shareholder. To estimate the partial effects of these key variables, we provide regression tests in the following section.
We employ regression models to examine the relation between family shareholders’ features (i.e., family ownership, control, and management) and debt ratio. In the regressions, we use separation of ownership and control and affiliated directors respectively to measure a family’s desire to control a firm. All regressions include firm and year fixed effects6. However, we do not report the coefficients in the tables.
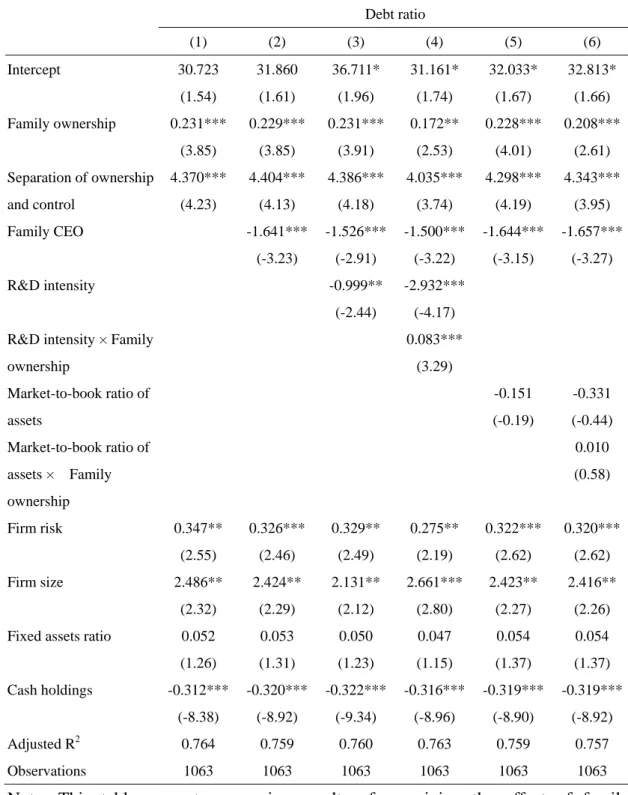
Table 3 presents regression results using separation of ownership and control as the family control variable. The coefficient estimates on family ownership, control, and management are all significant, indicating that the three aspects of controlling families influence a firm’s leverage. Family ownership has a significantly positive coefficient, suggesting that family ownership is beneficial to the relation between family shareholders and creditors. The result is also consistent with the findings of Anderson and Reeb (2003) that high family ownership does not reduce firm risk through less use of debt financing. The coefficient for separation of ownership and control is positive, consistent with the findings of Du and Dai (2007), which suggests that preventing the dilution of its shareholdings has a higher priority for the controlling family when the family has a stronger desire to maintain its control over a firm. As we expected, family CEO has a negative coefficient, indicating that for firms with a non-family member as CEO, debt ratio is significantly higher than for those
6
We also use random effects as an alternative way to control for unobserved heterogeneity and the
with a family CEO.
We further employ R&D intensity and market-to-book ratio of assets in the regressions to measure agency problems of debt. We introduce an interaction term between family shareholders’ features and the measure of agency problems to examine whether family ownership, control, and management interact with agency problems of debt to affect a firm’s financial leverage. First, we examine the interaction between family ownership and the agency problem and present the results in columns 3-6 of Table 3. The coefficient estimate for the interaction term is positive, and when the measure of agency problems is R&D intensity, it is significant at the 1% level. The positive coefficient is consistent with our suggestion that for firms with greater agency problems of debt, the positive effect of family ownership on firm leverage is higher than for those with less agency problems. We also find that the coefficients of R&D intensity and market-to-book ratio of assets are negative and those of R&D intensity are even significant at the 1% level. The negative coefficient is consistent with Myers (1977) and Smith and Watts (1992) and suggests that a greater agency problem of debt results in less debt financing. Taken together, these results support the argument that high family ownership reduces the conflict between debt holders and shareholders. This increases a firm’s capacity for debt financing.
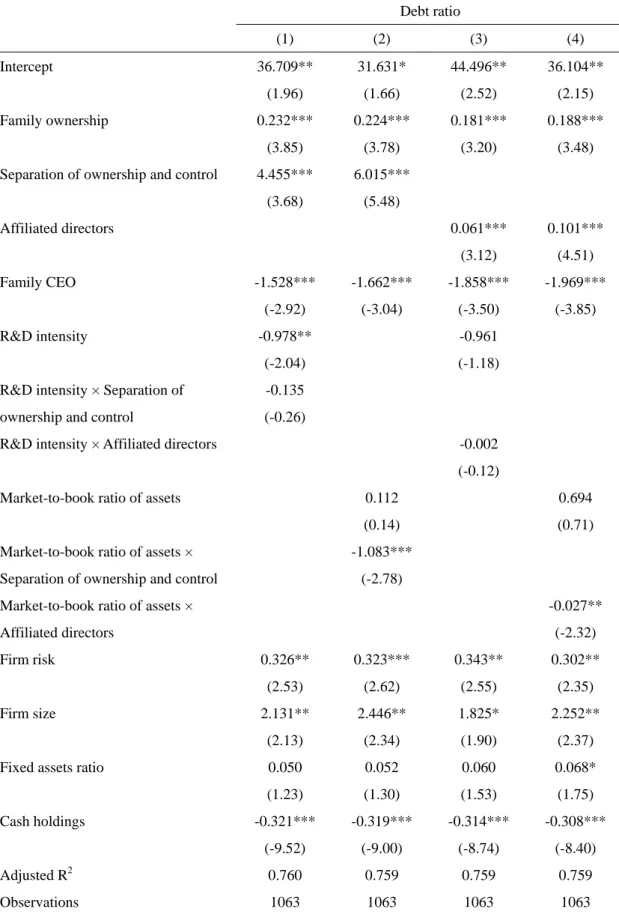
family control. The results are presented in Table 4. Consistent with the results in Table 3, the coefficient estimate of family control (here it is affiliated directors) remains positive and significant. In addition, the signs of other coefficient estimates are the same as those presented in Table 3. Our results of a positive relation between family ownership and debt ratio remain unchanged.
Table 5 presents the results of examining the effect of the interaction between family control and agency problems. First, we use separation of ownership and control as the family control variable, and then use affiliated directors as the measure for family control. Columns 1 and 3 present the results with R&D intensity as an agency problem measure. The results with market-to-book ratio of assets as the measure are presented in columns 2 and 4. The coefficient estimate of the interaction term is negative, and when the measure of agency problems is market-to-book ratio of assets, the estimate is significant (with a different family control variable, the p-value is 0.005 and 0.02 respectively). The negative coefficient is consistent with our expectations, indicating that when a firm suffers more serious agency problem of debt, stronger family control leads to a lower level of firm leverage. Previous studies point out that control-enhancing mechanisms of family shareholders reduce a firm’s value (Claessens et al., 2002; Yeh, 2005; Villalonga and Amit, 2006). Our findings suggest that debt holders view stronger family control through these control-enhancing
mechanisms as detrimental to their wealth.
Table 6 shows the effect of interacting family management with agency problems of debt. Columns 1 and 2 present the results of using separation of ownership and control as the family control variable. When the measure of agency problems is market-to-book ratio of assets, the coefficient for the interacting term is negative and significant at the 1% level. However, there is no significant relation between debt ratio and interacting family management with R&D intensity. We find similar results when using affiliated directors as the family control variable (see columns 3 and 4). Our result shows that when firms have a high market-to-book ratio of assets, the firms with controlling families involved in management carry a lower level of debt. Anderson et al. (2003) indicates that family shareholders can have a detrimental effect on the shareholder-debt holder relation if family members occupy the CEO position. Our finding, which is consistent with that of Anderson et al. (2003), suggests that family management, by increasing the conflict between controlling families and debt holders, results in lower debt levels when the firm suffers greater agency problems of debt.
Ownership, control, and management are three fundamental elements that can characterize a family shareholder. Prior literature suggests that the three aspects have a differential effect on a firm’s value (Villalonga and Amit, 2006). Recognizing the potential different impact of the three elements, our research investigates if and how family shareholders influence a firm’s financial leverage by examining the effect of the controlling family’s ownership, control, and management. To the best of our knowledge, this is the first empirical study to distinguish the effect of these elements on a firm’s debt financing decisions.
Using a sample of family firms in Taiwan, we find that family ownership, control, and management have different effects on a firm’s leverage. The results show that there is a significantly positive relation between family ownership and debt ratio. Moreover, the coefficient of the interaction term of family ownership with agency problems is also positive; suggesting that the positive impact of family ownership is stronger when a firm suffers greater agency problems of debt. This finding is consistent with the argument that controlling families’ and debt holders’ interests become more closely aligned when family ownership increases.
Family control and family management also significantly influence a firm’s financial leverage. The coefficient of the family control variable is positive and the
coefficient of its interaction term with the measure of agency problems of debt is negative. This suggests that strong family control is related to a higher debt level, but the conflict of interests between shareholders and creditors weakens the positive relation between family control and firm leverage. Family management and its interaction with agency problem of debt both have a negative coefficient. These findings suggest that the presence of a family CEO is related to less use of debt, and the negative effect of family management increases with the agency problem of debt. Overall, our analysis suggests that a controlling family’s features affect a firm’s debt financing decisions. High family ownership helps mitigate the conflict between shareholders and creditors, resulting in higher debt levels. Family shareholders with a strong desire to have control over a firm tend to increase the debt ratio to prevent the dilution of their controlling position. On the other hand, our results indicate that family control and management have detrimental effects on the relation between the family and debt holders, which leads to a lower debt ratio when the firm suffers severe agency problems of debt.
References
Adam, T. and V. Goyal, 2008, The investment opportunity set and its proxy variables, Journal of Financial Research 31, 41-63.
Ag(ca, S. and S. Mansi, 2008, managerial ownership, takeover defenses, and debt financing, Journal of Financial Research 31, 85-112.
Anderson, R. and D. Reeb, 2003, Founding-Family ownership and firm performance: evidence from the S&P 500, Journal of Finance 58(3), 1301-1328.
Anderson, R., S. Mansi, and D. Reeb, 2003, Founding family ownership and the agency cost of debt, Journal of Financial Economics 68, 263-285.
Berger, A., G. Udell, 1998, The economics of small business finance: The roles of private equity and debt markets in the financial growth cycle, Journal of Banking & Finance 22, 613-673.
Berger, P., E. Ofek, and D. Yermack, 1997, Managerial entrenchment and capital structure decisions, Journal of Finance 52, 1411-1438.
Chrisman, J, J. Chua, and R. Litz, 2003, A unified systems perspective of family firm performance: an extension and integration, Journal of Business Venturing 18, 467-472.
Claessens S., S. Djankov, J. Fan, and L. Lang, 2002, Disentangling the incentive and entrenchment effects of large shareholder, Journal of Finance 57, 2741-2771.
Claessens, S., S. Djankov, and L. Lang, 2000, The separation of ownership and control in East Asian corporations, Journal of Finance Economics 58, 81-112. Du, J. and Y. Dai, 2005, Ultimate corporate ownership structures and capital
structures: evidence from East Asian economies, Corporate Governance 13, 60-71.
Faccio, M. and L. Lang, 2002, The ultimate ownership of western European corporations, Journal of Financial Economics 65, 365-395.
Grossman, S., and M.R. Hart, 1982, Corporate financial structure and managerial incentives. In J. McCall (ed.), The Economics of Information and Uncertainty. Chicago: University of Chicago Press.
Hutchinson, R., 1995, The capital structure and investment decision of the small owner-managed firm: Some exploratory issues, Small Business Economics 7, 231-239.
Jensen, M., 1986, Agency costs of free cash flow, corporate finance, and takeovers, American Economic Review 76, 323-329.
Johnson, B., R Magee, N. Nagarajan, H. Newmand, and G. Schwert, 1985, An analysis of the stock price reaction to sudden executive deaths: Implications for the management labor market, Journal of Accounting and Economics 7, 151-174.
Kale, J., T. Noe, and G. Ramirez, 1991, The effect of business risk on corporate capital structure: Theory and evidence, Journal of Finance 46, 1693-1715.
La Porta, R., F. Lopez-de-Silanes, A. Shleifer, and R. Vishny, 1998, Law and finance, Journal of Political Economy 106, 1113-1155.
La Porta, R., F. Lopez-de-Silanes, and A. Shleifer, 1999, Corporate ownership around the world, Journal of Finance 54, 471-581.
Le Breton-Miller, I. and D. Miller, 2006, Why do some family businesses out-compete? Governance, long-term orientations, and sustainable capability, Entrepreneurship Theory and Practice, 731-746.
Leland, H. and D. Pyle, 1977, Informational asymmetries, financial structure, and financial intermediation, Journal of Finance 32, 371-387.
Lemmon, M. L. and K. V. Lins, 2003, Ownership structure, corporate governance, and firm value: Evidence from the East Asian Financial crisis, Journal of Finance 8, 1445-1468.
Lin, S. and S. Hu, 2007, A family member or professional management? The choice of a CEO and its impact on performance, Corporate Governance 15, 1348-1362.
Morck, R., A. Shleifer, and R. Vishny, 1988, Managerial ownership and market valuation: An empirical analysis, Journal of Financial Economics 20,
293-315.
Morck, Strangeland, and B. Yeung, 2000, Inherited wealth, corporate control, and economic growth? In Randall Morck, Ed.: Concentrated corporate ownership, (NBER Conference Volume, University of Chicago Press, Chicago, IL). Myers, S.C., 1977, Determinants of corporate borrowing, Journal of Financial
Economics 5, 147-175.
Noe, T. H. and M. J. Rebello, 1996, Asymmetric information, managerial opportunism, financing and payout policies, Journal of Finance 51, 637-660.
Novaes, W., 2003, Capital structure choice when managers are in control: entrenchment vs. efficiency. Journal of Business 76, 49-81.
Opler, T., L. Pinkowitz, R. Stulz, R. Williamson, 1999, The determinants and implications of corporate cash holdings, Journal of Financial Economics 52, 3-46.
Romano, C., G. Tanewski, and K. Smyrnios, 2000, Capital structure decision making: a model for family business, Journal of Business 16, 285-310.
Scott, J. 1977, Bankruptcy, secured debt and optimal capital structure, Journal of Finance 32, 1-19.
Smith, C. and R. Watts, 1992, The investment opportunity set and corporate financing, dividend, and compensation policies, Journal of Financial Econmics 32,
263-292.
Titman, S., and R. Wessels, 1988, The determinants of capital structure choice, Journal of Finance 43, 1-19.
Toy, N., A. Stonehill, L. Remmers, R. Wright, and T. Beekhuisen, 1974, A comparative international study of growth, profitability, and risk as determinants of corporate debt ratios in the manufacturing sector, Journal of Financial and Quantitative Analysis 9, 875-886
Villalonga, B. and R. Amit, 2006, How do family ownership, control, and management affect firm value? Journal of Financial Economics 80, 385-417. Warner, J., 1977, Bankruptcy costs, absolute priority and the pricing of risk debt
claims, Journal of Financial Economics 4, 239-276.
Williamson, O. E., 1988, Corporate finance and corporate governance, Journal of Finance 43, 567-591.
Yeh, Y. H., T. Lee and T. Woidtke, 2001, Family control and corporate governance: Evidence for Taiwan, International Review pf Finance 2, 21-48.
Yeh, Yin-Hua and T. Woidtke, 2005. Commitment or Entrenchment?: Controlling Shareholders and Board Composition. Journal of Banking and Finance, 29 (7), 1857-1885.
TABLE 1. Descriptive Data for Family Firms.
Mean Median Standard Deviation Max. Min.
Family ownership (%) 20.34 18.14 13.18 72.48 0.001
Separation of ownership and control 0.32 0.00 0.46 1.00 0.00
Affiliated directors (%) 40.49 40.00 29.76 100.00 0.00
Family CEO 0.55 1.00 0.49 1.00 0.00
Debt ratio (%) 38.67 39.04 15.04 89.62 4.95
R&D intensity (%) 0.78 0.11 1.40 9.50 0.00
Market-to-book ratio of assets 1.79 1.58 0.94 8.39 0.41
Firm risk (%) 4.34 3.40 3.49 33.04 0.23
Firm size 15.65 15.54 1.04 19.24 12.75
Fixed assets ratio (%) 35.92 35.33 18.52 97.09 0.14
Cash holdings (%) 9.83 6.30 9.76 57.65 0.01
Note: The sample comprises 1,063 firm-year observations from family firms listed in Taiwanese stock markets during the period from 1991 to 2000. Family firms are defined as those in which the largest shareholder is a specific family, and the voting rights of that family are not less than 10%. Family ownership is the cash-flow rights of the controlling family. Separation of ownership and control is a binary variable, which is equal to one if a family’s share of voting rights is higher than its share of cash-flow rights, and zero otherwise. Affiliated directors are a percentage of all the directors who are members of the controlling family. Family CEO is also a binary variable, which equals one when a CEO is a member of the controlling family and zero otherwise. Debt ratio is measured by the book value of debt divided by total assets. R&D intensity is measured as the ratio of research and development expenses to total assets by percentage. Market-to-book ratio of assets is the sum of the book value of debt and the market value of equity divided by the book value of assets. We use the standard deviation of return on assets (ROA) during the previous
five years to proxy for firm operating risk. Firm size is measured by the natural logarithm of the book value of assets. We measure fixed assets ratio as the sum of land, plant, and machinery value, and we scale the value by total assets. Cash holdings are measured by the ratio of cash and marketable securities to total assets.
TABLE 2. Pearson Correlations.
1 2 3 4 5 6 7 8 9 10
1. Family ownership (%) 1.00
2. Separation of ownership and control -0.41*** 1.00
3.Affiliated directors (%) 0.09*** 0.32*** 1.00 4. Family CEO 0.15*** -0.04 0.38*** 1.00 5. Debt ratio (%) 0.03 0.06** -0.07** -0.12*** 1.00 6. R&D intensity (%) 0.05* -0.16*** -0.14*** -0.09*** -0.11*** 1.00
7. Market-to-book ratio of assets 0.02 -0.10*** -0.13*** -0.02 -0.27*** 0.29*** 1.00
8. Firm risk (%) -0.13*** -0.03 -0.11*** -0.03 -0.08*** 0.19*** 0.20*** 1.00
9. Firm size -0.01 0.23*** 0.12 -0.17*** 0.32*** -0.08*** -0.18*** -0.13*** 1.00
10. Fixed assets ratio (%) 0.01 0.06* 0.11*** 0.08*** -0.02 -0.22*** -0.01 -0.006 -0.16*** 1.00 11. Cash holdings (%) -0.02 -0.07** -0.04 0.002 -0.48*** 0.13*** 0.23*** 0.17*** -0.20*** -0.15*** Note: This table provides the correlations between variables. The sample comprises 1,063 firm-year observations from family firms listed in Taiwanese stock markets during the period from 1991 to 2000. Family ownership is the cash-flow rights of the controlling family. Separation of ownership and control is a binary variable, which is equal to one if a family’s share of voting rights is higher than its share of cash-flow rights, and zero otherwise. Affiliated directors are a percentage of all the directors who are members of the controlling family. Family CEO is also a binary variable, which equals one when a CEO is a member of the controlling family and zero otherwise. Debt ratio is measured by the book value of debt divided by total assets. R&D intensity is measured as the ratio of research and development expenses to total assets by percentage. Market-to-book ratio of assets is the sum of the book value of debt and the market value of equity divided by the book value of assets. We use the standard deviation of return on assets (ROA) during the previous five years to proxy for firm operating risk. Firm size is measured by the
natural logarithm of the book value of assets. We measure fixed assets ratio as the sum of land, plant, and machinery value, and we scale the value by total assets. Cash holdings are measured by the ratio of cash and marketable securities to total assets.
*** Significant at the 1% level. ** Significant at the 5% level. * Significant at the 10% level.
TABLE 3. Effect of Family Ownership on Firm Leverage: Separation of Ownership and Control as the Measure of Family Control.
Debt ratio (1) (2) (3) (4) (5) (6) Intercept 30.723 (1.54) 31.860 (1.61) 36.711* (1.96) 31.161* (1.74) 32.033* (1.67) 32.813* (1.66) Family ownership 0.231*** (3.85) 0.229*** (3.85) 0.231*** (3.91) 0.172** (2.53) 0.228*** (4.01) 0.208*** (2.61) Separation of ownership and control 4.370*** (4.23) 4.404*** (4.13) 4.386*** (4.18) 4.035*** (3.74) 4.298*** (4.19) 4.343*** (3.95) Family CEO -1.641*** (-3.23) -1.526*** (-2.91) -1.500*** (-3.22) -1.644*** (-3.15) -1.657*** (-3.27) R&D intensity -0.999** (-2.44) -2.932*** (-4.17) R&D intensity × Family
ownership 0.083*** (3.29) Market-to-book ratio of assets -0.151 (-0.19) -0.331 (-0.44) Market-to-book ratio of assets × Family ownership 0.010 (0.58) Firm risk 0.347** (2.55) 0.326*** (2.46) 0.329** (2.49) 0.275** (2.19) 0.322*** (2.62) 0.320*** (2.62) Firm size 2.486** (2.32) 2.424** (2.29) 2.131** (2.12) 2.661*** (2.80) 2.423** (2.27) 2.416** (2.26) Fixed assets ratio 0.052
(1.26) 0.053 (1.31) 0.050 (1.23) 0.047 (1.15) 0.054 (1.37) 0.054 (1.37) Cash holdings -0.312*** (-8.38) -0.320*** (-8.92) -0.322*** (-9.34) -0.316*** (-8.96) -0.319*** (-8.90) -0.319*** (-8.92) Adjusted R2 0.764 0.759 0.760 0.763 0.759 0.757 Observations 1063 1063 1063 1063 1063 1063
Note: This table presents regression results of examining the effect of family ownership on firm leverage by using separation of ownership and control as the family control variable. Dependent variable is debt ratio, which is measured by the book value of debt divided by total assets. All regressions include firm and year fixed effects. However, we do not report the coefficients in the table. Family ownership is the cash-flow rights of the controlling family. Separation of ownership and control is a binary variable, which is equal to one if a family’s share of voting rights is higher than
its share of cash-flow rights, and zero otherwise. Family CEO is also a binary variable, which equals one when a CEO is a member of the controlling family and zero otherwise. Debt ratio is measured by the book value of debt divided by total assets. R&D intensity is measured as the ratio of research and development expenses to total assets by percentage. Market-to-book ratio of assets is the sum of the book value of debt and the market value of equity divided by the book value of assets. We use the standard deviation of return on assets (ROA) during the previous five years to proxy for firm operating risk. Firm size is measured by the natural logarithm of the book value of assets. We measure fixed assets ratio as the sum of land, plant, and machinery value, and we scale the value by total assets. Cash holdings are measured by the ratio of cash and marketable securities to total assets. t-values are in parentheses and are corrected for serial correlation with the Huber-White Sandwich Estimators for variance. *** Significant at the 1% level.
** Significant at the 5% level. * Significant at the 10% level.
TABLE 4. Effect of Family Ownership on Firm Leverage: Affiliated Directors as the Measure of Family Control.
Debt ratio (1) (2) (3) (4) (5) (6) Intercept 38.448** (2.07) 39.716** (2.16) 44.612** (2.55) 38.722** (2.37) 39.877** (2.23) 40.449** (2.20) Family ownership 0.177*** (3.17) 0.177*** (3.20) 0.180*** (3.22) 0.124* (1.91) 0.177*** (3.30) 0.161** (2.16) Affiliated directors 0.056*** (3.23) 0.060*** (3.40) 0.060*** (3.39) 0.052*** (2.94) 0.060*** (3.38) 0.059*** (3.24) Family CEO -1.981*** (-3.83) -1.866*** (-3.54) -1.786*** (-3.92) -1.984*** (-3.74) -1.988*** (-3.79) R&D intensity -1.019** (-2.36) -2.913*** (-4.12) R&D intensity × Family
ownership 0.081*** (3.13) Market-to-book ratio of assets -0.147 (-0.19) -0.293 (-0.40) Market-to-book ratio of assets × Family ownership 0.008 (0.49) Firm risk 0.364*** (2.64) 0.340** (2.55) 0.343** (2.58) 0.288** (2.27) 0.336*** (2.71) 0.334*** (2.71) Firm size 2.189** (2.17) 2.116** (2.12) 1.820* (1.92) 2.360*** (2.67) 2.116** (2.10) 2.113** (2.10) Fixed assets ratio 0.061
(1.53) 0.063 (1.61) 0.060 (1.52) 0.056 (1.41) 0.064* (1.66) 0.063* (1.67) Cash holdings -0.303*** (-7.78) -0.312*** (-8.41) -0.314*** (-8.78) -0.309*** (-8.43) -0.311*** (-8.37) -0.311*** (-8.38) Adjusted R2 0.757 0.758 0.759 0.761 0.758 0.757 Observations 1063 1063 1063 1063 1063 1063
Note: This table presents regression results of examining the effect of family ownership on firm leverage by using affiliated directors as the family control variable. Dependent variable is debt ratio, which is measured by the book value of debt divided by total assets. All regressions include fixed effects for year and firm. However, we do not report the coefficients in the table. Family ownership is the cash-flow rights of the controlling family. Affiliated directors are a percentage of all the directors who are
members of the controlling family. Family CEO is also a binary variable, which equals one when a CEO is a member of the controlling family and zero otherwise. Debt ratio is measured by the book value of debt divided by total assets. R&D intensity is measured as the ratio of research and development expenses to total assets by percentage. Market-to-book ratio of assets is the sum of the book value of debt and the market value of equity divided by the book value of assets. We use the standard deviation of return on assets (ROA) during the previous five years to proxy for firm operating risk. Firm size is measured by the natural logarithm of the book value of assets. We measure fixed assets ratio as the sum of land, plant, and machinery value, and we scale the value by total assets. Cash holdings are measured by the ratio of cash and marketable securities to total assets. t-values are in parentheses and are corrected for serial correlation with the Huber-White Sandwich Estimators for variance.
*** Significant at the 1% level. ** Significant at the 5% level. * Significant at the 10% level.
TABLE 5. Effect of Family Control on Firm Leverage. Debt ratio (1) (2) (3) (4) Intercept 36.709** (1.96) 31.631* (1.66) 44.496** (2.52) 36.104** (2.15) Family ownership 0.232*** (3.85) 0.224*** (3.78) 0.181*** (3.20) 0.188*** (3.48) Separation of ownership and control 4.455***
(3.68) 6.015*** (5.48) Affiliated directors 0.061*** (3.12) 0.101*** (4.51) Family CEO -1.528*** (-2.92) -1.662*** (-3.04) -1.858*** (-3.50) -1.969*** (-3.85) R&D intensity -0.978** (-2.04) -0.961 (-1.18)
R&D intensity × Separation of ownership and control
-0.135 (-0.26)
R&D intensity × Affiliated directors -0.002
(-0.12)
Market-to-book ratio of assets 0.112
(0.14)
0.694 (0.71)
Market-to-book ratio of assets × Separation of ownership and control
-1.083*** (-2.78)
Market-to-book ratio of assets × Affiliated directors -0.027** (-2.32) Firm risk 0.326** (2.53) 0.323*** (2.62) 0.343** (2.55) 0.302** (2.35) Firm size 2.131** (2.13) 2.446** (2.34) 1.825* (1.90) 2.252** (2.37)
Fixed assets ratio 0.050
(1.23) 0.052 (1.30) 0.060 (1.53) 0.068* (1.75) Cash holdings -0.321*** (-9.52) -0.319*** (-9.00) -0.314*** (-8.74) -0.308*** (-8.40) Adjusted R2 0.760 0.759 0.759 0.759 Observations 1063 1063 1063 1063
Note: This table presents regression results of examining the effect of the interaction between family control and agency problems of debt on firm leverage. Dependent
variable is debt ratio, which is measured by the book value of debt divided by total assets. All regressions include fixed effects for year and firm. However, we do not report the coefficients in the table. Family ownership is the cash-flow rights of the controlling family. Separation of ownership and control is a binary variable, which is equal to one if a family’s share of voting rights is higher than its share of cash-flow rights, and zero otherwise. Affiliated directors are a percentage of all the directors who are members of the controlling family. Family CEO is also a binary variable, which equals one when a CEO is a member of the controlling family and zero otherwise. Debt ratio is measured by the book value of debt divided by total assets. R&D intensity is measured as the ratio of research and development expenses to total assets by percentage. Market-to-book ratio of assets is the sum of the book value of debt and the market value of equity divided by the book value of assets. We use the standard deviation of return on assets (ROA) during the previous five years to proxy for firm operating risk. Firm size is measured by the natural logarithm of the book value of assets. We measure fixed assets ratio as the sum of land, plant, and machinery value, and we scale the value by total assets. Cash holdings are measured by the ratio of cash and marketable securities to total assets. t-values are in parentheses and are corrected for serial correlation with the Huber-White Sandwich Estimators for variance. *** Significant at the 1% level.
** Significant at the 5% level. * Significant at the 10% level.
TABLE 6. Effect of Family Management on Firm Leverage. Debt ratio (1) (2) (3) (4) Intercept 36.867* (1.90) 28.972 (1.50) 44.639** (2.47) 36.802** (2.06) Family ownership 0.231*** (3.87) 0.236*** (4.15) 0.180*** (3.18) 0.185*** (3.42) Separation of ownership and
control 4.386*** (4.17) 4.459*** (4.23) Affiliated directors 0.061*** (3.36) 0.062*** (3.42) Family CEO -1.604*** (-2.18) 0.513 (0.83) -1.878*** (-4.26) 0.220 (0.33) R&D intensity -1.036** (-2.18) -1.025** (-2.11)
R&D expenditure × Family CEO 0.087 (0.15)
0.014 (0.03)
Market-to-book ratio of assets 0.554
(0.69)
0.577 (0.70)
Market-to-book ratio of assets × Family CEO -1.257*** (-3.97) -1.291*** (-4.19) Firm risk 0.328** (2.47) 0.310** (2.47) 0.343** (2.56) 0.324** (2.58) Firm size 2.123** (2.03) 2.535** (2.36) 1.818* (1.85) 2.228** (2.21)
Fixed assets ratio 0.051
(1.24) 0.055 (1.38) 0.060 (1.52) 0.064* (1.67) Cash holdings -0.321*** (-9.54) -0.326*** (-8.85) -0.314*** (-8.97) -0.319*** (-8.29) Adjusted R2 0.760 0.760 0.759 0.758 Observations 1063 1063 1063 1063
Note: This table presents regression results of examining the effect of the interaction between family management and agency problems of debt on firm leverage. Dependent variable is debt ratio, which is measured by the book value of debt divided by total assets. All regressions include fixed effects for year and firm. However, we do not report the coefficients in the table. Family ownership is the cash-flow rights of the controlling family. Separation of ownership and control is a binary variable, which is equal to one if a family’s share of voting rights is higher than its share of cash-flow
rights, and zero otherwise. Affiliated directors are a percentage of all the directors who are members of the controlling family. Family CEO is also a binary variable, which equals one when a CEO is a member of the controlling family and zero otherwise. Debt ratio is measured by the book value of debt divided by total assets. R&D intensity is measured as the ratio of research and development expenses to total assets by percentage. Market-to-book ratio of assets is the sum of the book value of debt and the market value of equity divided by the book value of assets. We use the standard deviation of return on assets (ROA) during the previous five years to proxy for firm operating risk. Firm size is measured by the natural logarithm of the book value of assets. We measure fixed assets ratio as the sum of land, plant, and machinery value, and we scale the value by total assets. Cash holdings are measured by the ratio of cash and marketable securities to total assets. t-values are in parentheses and are corrected for serial correlation with the Huber-White Sandwich Estimators for variance. *** Significant at the 1% level.
** Significant at the 5% level. * Significant at the 10% level.