䉷2006 Springer Publishing Company 129
Field Testing, Refinement, and
Psychometric Evaluation of a New
Measure of Nursing Home Care
Quality
Marilyn J. Rantz, PhD, RN, FAAN
University of Missouri-ColumbiaMary Zwygart-Stauffacher, PhD, RN, FAAN
University of Wisconsin-Eau ClaireDavid R. Mehr, MD, MS
Gregory F. Petroski, MS
University of Missouri-ColumbiaSteven V. Owen, PhD
University of Texas Health Science Center at San Antonio
Richard W. Madsen, PhD
Marcia Flesner, RN, PhD
Vicki Conn, PhD, RN
Jane Bostick, RN, PhD
University of Missouri-ColumbiaRobyn Smith, MSN, RN
Luther-Midelfort/Mayo Health SystemEau Claire, WI
Meridean Maas, RN, PhD, FAAN
University of IowaIowa City, IA
The primary aim of this NINR-NIH–funded field test in 407 nursing homes in 3 states was to complete the development of and conduct psychometric testing for the Observable Indicators of Nursing Home Care Quality Instrument (Observable Indicators, OIQ). The development of the OIQ was based on extensive qualitative and iterative quantitative work that described nursing home care quality and did initial validity and reliability field testing of the instrument in 123 nursing homes in 1 state. The scale is meant for researchers, consumers, and regulators interested in directly observing and quickly evaluating (within 30 minutes of observation) the multiple dimensions of care quality in nursing homes. After
extensive testing in this study, the Observable Indicators instrument has been reduced to 30 reliable and discriminating items that have a conceptually coherent hierarchical factor structure that describes nursing home care quality. Seven first-order factors group together into two second-order factors of Structure (includes Environment: Basics and Odors) and Process (includes Care Delivery, Grooming, Interpersonal Communication, Environment: Access, and Environment: Homelike) that are classic constructs of Quality, which was the third-order factor. Internal consistency reliability for the 7 first-order factors ranged from .77 to .93. Construct validity analyses revealed an association between survey citations and every subscale as well as the total score of the OIQ instrument. Known groups analysis revealed expected trends in the OIQ scores. The Observable Indicators instrument as a whole shows acceptable interrater and test-retest reliabilities, and strong internal consis-tency. Scale subscales show acceptable reliability as well. Generalizability Theory analyses revealed that dependability of scores can be improved by including a second site observer, or by revisiting a site. There is a small additional benefit from increasing observers or visits beyond two.
Keywords: Generalizability Theory; nursing homes; psychometrics; quality of care;
reliability and validity
N
othing has raised such persistent concerns about quality than the care that our nation’s elders receive in nursing homes. During the past 20 years there have been legislative hearings, commissioned quality of care reports to Congress, and much public outcry that care must be improved (Committee on Nursing Home Regulation, 1986; Committee on the Adequacy of Nurse Staffing in Hospitals and Nursing Homes, 1996; Committee on Improving Quality in Long-term Care, 2001; Health Care Financing Admin-istration, 2000; Kane, 1995; Kane, Kane, & Ladd, 1998). Yet, quality care problems persist. Most American adults have had an experience with a nursing home, as an immediate or extended family member has faced the need for nursing home care. Every day, 1.7 million elders live in our nation’s nursing homes; that is projected to grow to more than 5 million by 2030. What once was identified as a need to “develop and use valid and reliable instru-ments to measure quality of care” in nursing homes (Committee, 1986, p. 56) has now become urgent (Rantz & Mehr, 2001). Researchers need measures of nursing home care quality as they study costs and outcomes. Consumers need a guide to quality of care to assist in choosing a nursing home. And state and federal regulators need new ways to examine quality of nursing home care as they attempt to focus inspections on problem facilities (Pear, 2000, 2001). To date, there is no validated—and brief—instrument that can be used to directly observe and quickly evaluate the multiple dimensions of quality of nursing home care.The primary aim of this study was to complete the development of the Observable Indicators of Nursing Home Care Quality Instrument (OIQ; Observable Indicators) for use by researchers interested in studying the multiple dimensions of care quality in nursing homes. Item reduction and subscale development were guided by reliability results from several statistical methods and by exploratory and confirmatory factor analysis. Methods from Generalizability Theory (Brennan, 2001) were used to evaluate the reliability of the final instrument. A secondary study aim was to assess the psychometric properties of the Observable Indicators instrument when used by consumers and when used by regulators.
BACKGROUND
The Institute of Medicine (IOM) concluded that “regulation is necessary but not sufficient for high-quality care” (Committee, 1986, p. 24). Fifteen years later, another IOM
committee concluded that “no single or simple formula is available to guide those at-tempting to evaluate the quality of long-term care” (Committee, 2001, p. 76). Our multi-disciplinary research team at the University of Missouri-Columbia Schools of Nursing and Medicine has conducted a series of studies to understand and measure the various dimen-sions of quality of nursing home care (Rantz et al., 1998, 1999, 2000a, 2001, 2002), the latest of which was funded by the National Institute of Nursing Research (NINR) to refine and test an instrument to directly observe and rapidly assess nursing home care quality. No other instruments have been developed nor psychometrically tested for this purpose.
The instrument was also designed in response to the investigators’ other quality research in nursing homes using large data sets that indirectly measure quality of nursing home care. These studies include the use of the nursing home Minimum Data Set (MDS) quality indicators (QIs) and quality measures (QMs), which require sophisticated inferences from longitudinal quantitative data that have considerable time delays in analysis (Rantz et al., 1996, 1997b, 2001, 2003, 2004a, 2004b; Rantz & Connelly, 2004). Although QIs and QMs measure some aspects of quality of care in nursing homes, they are not able to capture some very important features that require on-site observation, such as odor, communication between staff and residents, the presence of volunteers, a feeling of home, appealing food, and other features commonly expressed as important by consumers (Burger et al., 1996; Rantz et al., 1999). The research team was interested in developing a way to directly observe and rapidly measure quality of nursing home care that is valid and reliable to augment quality of care information obtainable from large data set analyses.
The research team initiated a series of qualitative studies to identify and describe the many dimensions of quality of care in nursing homes of importance to consumers, pro-viders, and regulators (Rantz et al., 1998, 1999). In this field work, the investigators were able to propose two theoretical models of nursing home care quality: one from the point of view of direct care providers and regulators and one from the view of consumers. The dimensions from the two models were merged into one comprehensive model defining nursing home care quality as a multidimensional concept with seven dimensions: central focus of the agency is on residents, families, staff, and community; care; communication; staff; environment; home; and family involvement (Rantz et al., 1998, 1999). Based on this qualitative work, an initial instrument, Observable Indicators of Nursing Home Care Quality Instrument (OIQ; Observable Indicators), was constructed from the descriptive statements of study participants. Items were constructed to measure each of the dimensions of the theoretical model of nursing home care quality (Rantz et al., 2000a). As the instru-ment name implies, each item refers to some directly observable aspect of any nursing home. In the earlier studies, the instrument was revised four times and field-tested each time in a total of 123 nursing homes in Missouri and a small international sample. The field tests delivered promising reliability and validity results (Rantz et al, 2000a, 2002; Rantz & Mehr, 2001). The instrument was designed to guide researchers, health care professionals, and potential consumers in appraising specific observable indicators of qual-ity care during an approximate 30-minute inspection of a nursing home.
METHODS AND RESULTS
Content Validity Evidence
Prior to field testing, the 47-item Observable Indicators instrument, Version 7, was evaluated by six content experts of nursing home administrators, directors of nursing, and nursing home consultants, who were selected using established criteria for selection of
experts (Jaeger, 1991). Experts were asked to rate the relevance of each item on a scale of 1⳱not relevant, and 4⳱very relevant (Waltz, Strickland, & Lenz, 2005). Ratings were averaged across the six raters. Average item ratings ranged from 4 to 2.5 with only four items rated between 2.5 and 2.8; 43 of the 47 items had average ratings of between 3 and 4. Therefore, all 47 items of Version 7 were retained for field testing. The Content Validity Index (CVI) for Version 7 was .91.
Sample
Sample selection was limited to non-hospital-based nursing facilities with more than 30 licensed beds that were located within 200 miles of the two study sites, Columbia, MO, and Eau Claire, WI, which resulted in a sampling frame of 418 in Missouri, 408 in Wisconsin, and 241 in Minnesota. The intended sample size was 400 nursing homes: 250 in Missouri and 150 from the Minnesota and Wisconsin. Study facilities were randomly selected from those that met the inclusion criteria and were willing to participate. Facilities were continuously recruited until the sample was complete, with 46 Missouri facilities and 26 Wisconsin and Minnesota facilities declining to participate. Ultimately, data were collected from observations of 407 nursing homes from the defined population in Missouri (n⳱257), Wisconsin (n⳱84), and Minnesota (n⳱66). The oversampling of Missouri was done because of missing data for a planned construct validity analysis that required complete Minimum Data Set (MDS) data for each facility. All facilities were observed by at least one RN with subsets in Missouri visited by pairs of observers to provide data for interrater reliability estimates, and by a single observer revisiting for stability (test-retest) evidence.
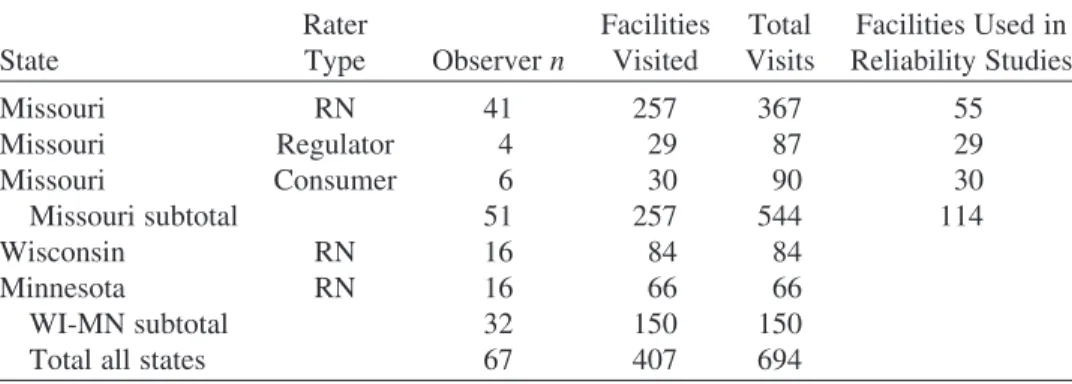
As displayed in Table 1, in Missouri there were a total of 544 visits to 257 different facilities by 41 RNs, 6 consumers, and 4 retired regulators. For interrater purposes, 114 facilities were visited by a pair of observers, 55 facilities were visited by a pair of RNs, 30 facilities by a pair of consumers, and 29 by a pair of retired regulators. For test-retest purposes, a return visit was made to 108 facilities by one of the initial observers; RNs made return visits to 49 facilities, consumers to 30 facilities, and regulators to 29 facilities. The target retest interval was 1 week, on the same day of the next week to reduce variations in care and staffing schedules from one visit to the next. Scheduling complexity prevented identical revisit intervals. Return visits followed the initial visit by an average of 7.6 days (SD⳱2.7 days) with a minimum of 5 days and a maximum of 27 days. In Wisconsin
TABLE 1. Summary of Visits Made by Rater Type and State
State Rater Type Observer n Facilities Visited Total Visits Facilities Used in Reliability Studies Missouri RN 41 257 367 55 Missouri Regulator 4 29 87 29 Missouri Consumer 6 30 90 30 Missouri subtotal 51 257 544 114 Wisconsin RN 16 84 84 Minnesota RN 16 66 66 WI-MN subtotal 32 150 150
and Minnesota, 16 RNs made single observations of a total of 150 facilities. A total of 694 visits were made to 407 different facilities in the three states by 67 observers.
Before beginning data collection, all observers were trained by research staff as they observed and completed the instrument in a nonparticipating test facility to assure accurate use. A large number of observers were used to maximize observer variability, required for the planned generalizability reliability analyses. Observers were not employees of facilities they observed, nor were they employees of potential competitors of facilities they observed. All data were collected within 15 months from all sites and coded for analysis that commenced after all data were collected.
Preliminary Data Analyses
Response frequencies for each item by state were examined for the first visit to each facility by an RN (N⳱407). Most items showed good variation, with all responses options used, and similar response patterns across states.
Final Item Selection
Items were evaluated using a variety of statistical techniques to assess their psychometric characteristics. Data from reliable items show good congruence between simultaneous observers, and a high degree of stability across visits. In Generalizability Theory, items that maximize individual differences are those for which a large proportion of their variance is attributable to between-facility differences.
Weighted Kappa coefficients (Fleiss, 1981), with corresponding 95% confidence intervals, were used to evaluate both interrater and test-retest reliability. These analyses were performed separately for each type of rater (nurse, consumer, regulator). Landis and Koch (1977) offered guidelines for interpreting Kappa, suggesting that values between 0.21 and 0.40 represent “fair” agreement. With this guideline, items with a Kappa below 0.30 (the mid-range of fair agreement), or whose lower end of the 95% confidence interval fell below 0.21 (the lower limit of “fair” agreement) were flagged for removal. Using this approach, seven items were identified as potentials to discard; in most cases these seven were flagged from results from each of the three rater types.
As a third step, a mixed linear model (Littell, Milliken, Stroup, & Wolfinger, 1996) was fit to the data set containing interrater (n⳱ 114) and test-retest (n ⳱108) data. In this mixed model approach, the item response was modeled as an overall mean, plus a fixed effect because of the type of rater, plus a random effect reflecting the facility itself, plus a random effect for the different raters (persons doing the ratings, not the type of rater), plus a random effect relating to within-rater variability (i.e., error). The same seven items were selected for discarding using this approach as identified to discard based on Kappa.
Exploratory Factor Analysis
With the shortened 40-item instrument, factor analysis data sets were prepared. Data for the factor analyses were randomly split, allocating half of the single visits to the exploratory factor analysis (EFA) data set and half to the confirmatory factor analysis (CFA) data set. Next, of the 114 facilities with more than one visit, one visit was randomly assigned to the EFA data set and another visit was assigned to the CFA data set. Thus, observations from the same facility were used in both data sets, but the observations were different and each facility appeared only once in each data set. Sample size for the EFA was n⳱260, and for the CFA, n⳱261.
Using SPSS Version 12.02 (SPSS, 2004), sequential exploratory factor analyses were run on the EFA data set. In particular, these models specified varying numbers of factors, ranging from seven factors down through two. The rationale for beginning with seven factors was that the original item pool development had been built on seven logical dimensions derived from previous qualitative research during the instrument’s conception (Rantz et al., 1998, 1999). All factor models used oblique (direct oblimin) solutions. The simplest loading structures occurred with the six and seven factor solutions, which were then reviewed by the research team.
The seven-factor solution was preferred, as the factors showed the strongest alpha reliability estimates, and invited more precise conceptual explanations for the factors. The items assigned to each factor were reviewed; two with double loadings and five with loadings below 0.30 were eliminated. Three additional items were eliminated based on their low loadings relative to other items within their respective factors. A total of 30 items remained after these analyses.
The seven factors from the EFA were named and Cronbach’s coefficient alphas for dimensions of the remaining 30 items were calculated: Care Delivery (␣⳱.80), Grooming (␣ ⳱.83), Interpersonal Communication (␣ ⳱ .93), Environment: Access (␣ ⳱.74), Environment: Basics (␣⳱.78), Environment: Homelike (␣⳱.81) and Odors (␣⳱.77). In this initial approach to evaluating OIQ dimensionality, all reliability estimates were acceptable.
Confirmatory Factor Analyses
A multiconstruct confirmatory factor analysis (CFA) was arranged using the CFA data set. This was essentially a replication of the EFA, to test the fit of the proposed seven-factor model with a new data set. This analysis confirmed the structure discovered in the final EFA solution.
Overall model fit is evidenced by the Comparative Fit Index (CFI), which assesses the proportion that the proposed covariance structure fits the data better than the worst possible structure (i.e., the null model, which contains no covariances). In our data, the CFI was .91, indicating acceptable fit (Hu & Bentler, 1999). Another index of model fit, recommended by Byrne (2001) and others, is the root mean square error of approximation (RMSEA), which estimates the amount of error per parameter in the model. Typically, 0.08 is interpreted as adequate fit between the data and the model, and .05 (or less) represents close fit (Brown, 2006). In this data, the RMSEA was .056 (.90 confidence interval⳱.049-.062), showing acceptable fit. Finally, all standardized loadings were .41 or higher, suggesting that each item was a useful indicator of its underlying construct, and verifying that the measurement structure discovered in the original EFA sample also made sense for the replication CFA sample.
In the CFA, the seven constructs showed correlations ranging from .18 to .80, with a mean of .44 (calculated with Fisher z-transformations of the raw correlations). Because of the construct intercorrelations, further CFAs were developed to determine whether a second-order factor model might be more suitable in describing the data. The construct intercorrelations were resubmitted to the original EFA data set to assess higher-order dimensionality, and two higher-order factors emerged, which we interpreted as Process and Structure. A new confirmatory model, using the CFA data set, was then structured, depicting seven first-order factors caused by two second-order factors. This new model also had adequate fit indices. However, there was a substantial correlation (.74) between the two second-order factors, which suggested the possibility of a single third-order factor.
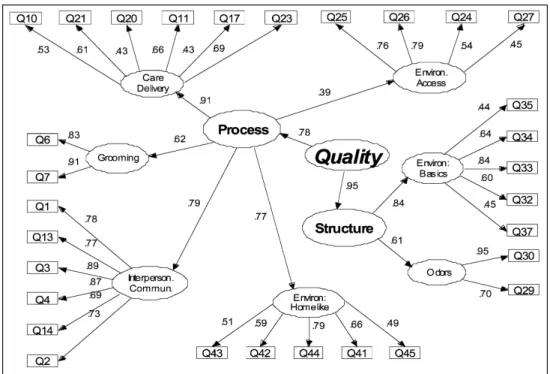
This led to a final CFA, using the CFA data set (n⳱263), which is illustrated in Figure 1. In such structural diagrams, a construct (latent variable) is depicted as an ellipse, and an original score (indicator variable) sits in a rectangle. The arrows show the direction of causal relationships. For simplicity, error and residual variances are not shown in Figure 1. This hierarchical model contained four levels of variables: At the top level, a single comprehensive construct, which we call Quality, is responsible for two subordinate constructs, Process and Structure. These latter two constructs are in turn responsible for the original seven first-order constructs, five of which flow from Process, and the remaining two, from Structure. At the lowest level of the hierarchy, the first-order constructs cause the observed scores (i.e., the 30 Observable Indicators items). Fit indices and alpha reliabilities for this final model were all acceptable (Standardized root mean residual, aiming to be less than .08, was .065; CFI
⳱.90; and RMSEA⳱.058 with .90 CI⳱.051–.064).
The hierarchical layers of Observable Indicators dimensions implies a flexible three-tier scoring rubric, which produces scale scores at varying levels of construct precision. At the grossest level, all 30 items are combined to form an overall Quality score. At the mid-level, two item subsets comprise the Process and Structure subscales. And at the most specific level, smaller item subsets create scales that refer to the original first-order factors. Because of the complexity (and statistical debate; see, e.g., Wainer, 1976) surrounding weighted scale scores, we suggest unweighted averages for computing each of the three levels of scores.
Classical Test Theory Analyses
The final 30-item instrument was analyzed using interrater and test-retest observations for all rater types (RN, consumer, and regulator) for all facilities in the reliability study (n⳱
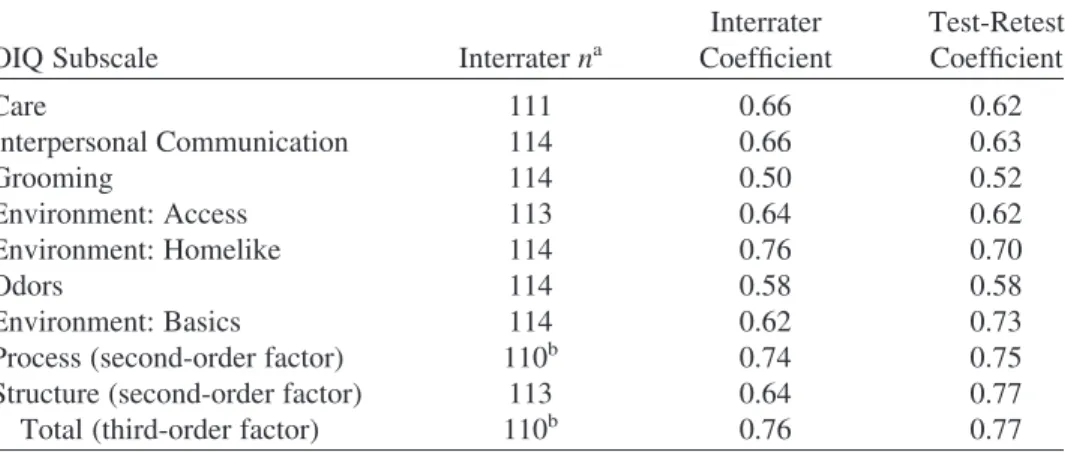
TABLE 2. Interrater and Test-Retest Reliability Estimates for OIQ (All Rater Types, 114 Nursing Facilities)
OIQ Subscale Interrater na
Interrater Coefficient Test-Retest Coefficient Care 111 0.66 0.62 Interpersonal Communication 114 0.66 0.63 Grooming 114 0.50 0.52 Environment: Access 113 0.64 0.62 Environment: Homelike 114 0.76 0.70 Odors 114 0.58 0.58 Environment: Basics 114 0.62 0.73
Process (second-order factor) 110b 0.74 0.75
Structure (second-order factor) 113 0.64 0.77
Total (third-order factor) 110b 0.76 0.77
Note. All correlations significant at p⬎.0001.
aMinor variations in n due to missing items for some subscales.
bn lower because higher level subscales cannot be calculated if lower level subscales are missing.
114). Coefficient alphas were calculated using all first RN visits to all facilities in the study (n ⳱ 407). Tables 2 and 3 display these results, which indicate that the Observable Indicators instrument has acceptable interrater and test-retest reliability evidence, as well as strong internal consistency for all subscales and the total instrument.
Generalizability Theory Analyses
Because different forms of reliability estimates in Classical Test Theory use different definitions of score consistency, there is no way to combine the various sources of error into an “overall” value. Generalizability Theory (GT) (Brennan, 2001), however, provides
TABLE 3. Coefficient Alpha and Descriptive Data for OIQ (All First RN Visits, 407 Nursing Facilities)
OIQ Subscale Alpha SEMa Mean Standard Deviation
Care 0.78 2.1 21.5 4.5 Interpersonal Communication 0.91 1.2 25.6 4.1 Grooming 0.83 0.5 8.4 1.2 Environment: Access 0.72 1.8 14.5 3.4 Environment: Homelike 0.79 1.9 18.4 4.1 Odors 0.75 0.8 8.4 1.5 Environment: Basics 0.73 1.3 19.5 2.5
Process (second-order factor) 0.90 4.1 88.4 13.0 Structure (second-order factor) 0.76 1.6 28.0 3.4 Quality (third-order factor) 0.91 4.5 116.4 15.2 a
Standard error of measurementSEM ⳱ std Z1ⳮ␣was based on data from all first RN visits in all three states.
such a framework, as it allows examining and summarizing multiple sources of measurement error that make up the total variation in a score. Because the full data set for this study contained the multiple items of the Observable Indicators, collected by two observers on a single visit and by one observer on two occasions, a GT study was conducted to combine these three sources of error (items, raters, occasions, and their interactions) into a single coefficient. Once calculated, the G-coefficient has the same properties as the conventional reliability estimate: it ranges from 0.00 to 1.00, with larger values indicating greater reliability, and it represents the proportion of the observed score that is dependable.
Data for the generalizability analysis was a subset of the Missouri data. The data consisted of observations from 114 facilities that had simultaneous visits by two observers with a visit by one of the two initial observers. For a few homes, scheduling problems produced a delay, but in most cases (108 of 114⳱95%), the return visit was within one week of the original visit. Separate generalizability analyses were conducted for each rater type. The method of minimum norm quadratic unbiased estimation (MIVQUE0) (Hartley, Rao, & LaMotte, 1978) was used for variance component estimation.
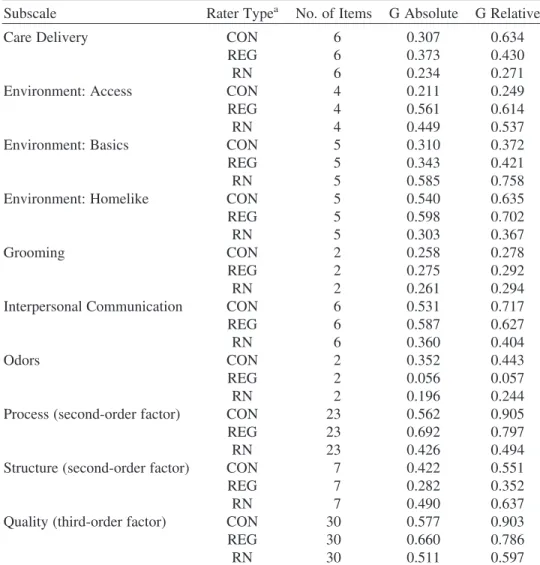
Two forms of G-coefficients may be calculated. Gabsolute is aligned with a criterion-referenced approach to measurement in which the purpose of the score is to answer the question, “How much of this characteristic does a person (or facility) possess?” Grelative corresponds to a norm-referenced use of scores in which scores are intended to make meaningful rank orderings of persons (or facilities). Both Gabsoluteand Grelativeare reported in Table 4. The coefficients reported here represent dependable variation under the conditions of a single rater and a single measurement occasion. And, because they contain multiple sources of error (e.g., among items, between raters, across occasions, plus various item, rater, and occasion interactions), the G-coefficients are predictably lower than their Classical Test Theory counterparts. It is also predictable that G-coefficients shrink when fewer items are involved, as with the seven first-order scales. As scales grow in size (e.g., Structure and Process 2nd-order dimensions, and Quality 3rd-order dimension), so do their G-coefficients. Another advantage of GT is the ability to play out various scenarios to see how they affect the G-coefficient. These are called Decision Studies. A D-Study may ask, for example, what should happen to the G-coefficient if one increased a 5-item scale to 8 items. Or it might ask how the G-coefficient changes if one uses 3 raters instead of 2, or 1 rating occasion instead of 2. Figure 2 displays the results of a D-Study completed for the total score of the OIQ. As illustrated in the diagrams, increasing the number of visits improves the dependability of data from the instrument, in particular by increasing the number of visits from 1 to 2. Increasing the raters from 1 to 2 has a similar effect on improving dependability.
Construct Validity Evidence
In this study, three approaches to construct validity evidence were employed, using survey citations, MDS-derived quality indicators, and MDS-derived quality measures. For these analyses, only one site visit was used for each facility, so in instances of multiple visits for interrater or test-retest reliability estimation, only the first visit to the facility was used. Known groups were constructed using survey citations and Quality Measures (QMs) from the national Nursing Home Compare Web site (2004), as well as Quality Indicators (QIs) collected from facilities at the time of the site visit in Wisconsin and Minnesota, and calculated from the Missouri MDS data for facilities in Missouri. Both QIs and QMs are derived from MDS data using standard algorithms used nationally and by our research
TABLE 4. G-Study Results for Subscales and Total Scale of OIQ
Subscale Rater Typea No. of Items G Absolute G Relative
Care Delivery CON 6 0.307 0.634
REG 6 0.373 0.430
RN 6 0.234 0.271
Environment: Access CON 4 0.211 0.249
REG 4 0.561 0.614
RN 4 0.449 0.537
Environment: Basics CON 5 0.310 0.372
REG 5 0.343 0.421
RN 5 0.585 0.758
Environment: Homelike CON 5 0.540 0.635
REG 5 0.598 0.702
RN 5 0.303 0.367
Grooming CON 2 0.258 0.278
REG 2 0.275 0.292
RN 2 0.261 0.294
Interpersonal Communication CON 6 0.531 0.717
REG 6 0.587 0.627
RN 6 0.360 0.404
Odors CON 2 0.352 0.443
REG 2 0.056 0.057
RN 2 0.196 0.244
Process (second-order factor) CON 23 0.562 0.905
REG 23 0.692 0.797
RN 23 0.426 0.494
Structure (second-order factor) CON 7 0.422 0.551
REG 7 0.282 0.352
RN 7 0.490 0.637
Quality (third-order factor) CON 30 0.577 0.903
REG 30 0.660 0.786
RN 30 0.511 0.597
aCON⳱consumer; REG⳱regulator; RN⳱registered nurse.
team for many years (Morris et al., 2002; Rantz et al., 1997a, 1997b, 2000b, 2001, 2004a, 2004b; Zimmerman et al., 1995).
For the OIQ items, missing data were examined and handled conservatively. There were very few missing items in the OIQ data set (for example, of the 689 total instruments completed by all observer types, 97.5% of the care subscales had complete item-level data). However, for those missing, we allowed only one missing item per subscale with items of four or more and no missing items were allowed in the calculation of the 2-item subscales.
Survey Citations. These data were used to develop criterion-related validity
coefficients, a subset of construct validity. Data from Nursing Home Compare were examined for all participating facilities in three states (N⳱407). Survey citations are the results of regulator site visits to a facility to examine for compliance with state and federal nursing home regulations about the operation of nursing homes. Survey citations have
Figure 2. D-Study results: generalizability coefficients for OIQ total score.
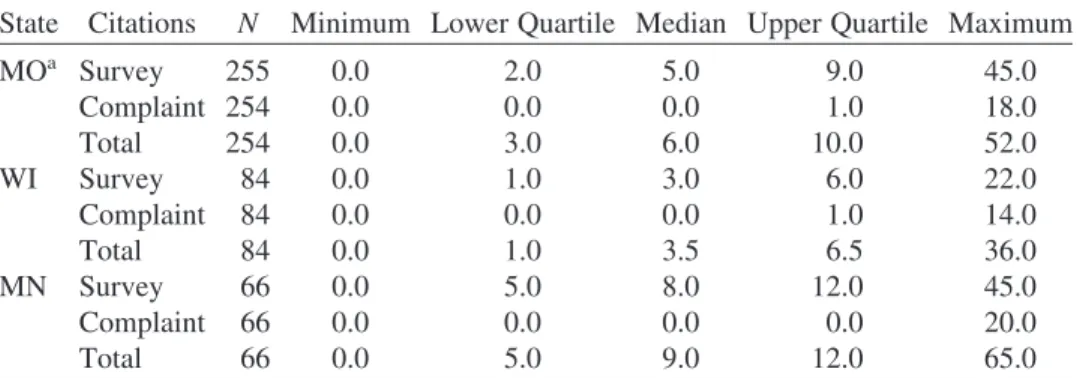
TABLE 5. Distribution of Survey, Complaint, and Total Citations by State
State Citations N Minimum Lower Quartile Median Upper Quartile Maximum
MOa Survey 255 0.0 2.0 5.0 9.0 45.0 Complaint 254 0.0 0.0 0.0 1.0 18.0 Total 254 0.0 3.0 6.0 10.0 52.0 WI Survey 84 0.0 1.0 3.0 6.0 22.0 Complaint 84 0.0 0.0 0.0 1.0 14.0 Total 84 0.0 1.0 3.5 6.5 36.0 MN Survey 66 0.0 5.0 8.0 12.0 45.0 Complaint 66 0.0 0.0 0.0 0.0 20.0 Total 66 0.0 5.0 9.0 12.0 65.0 a
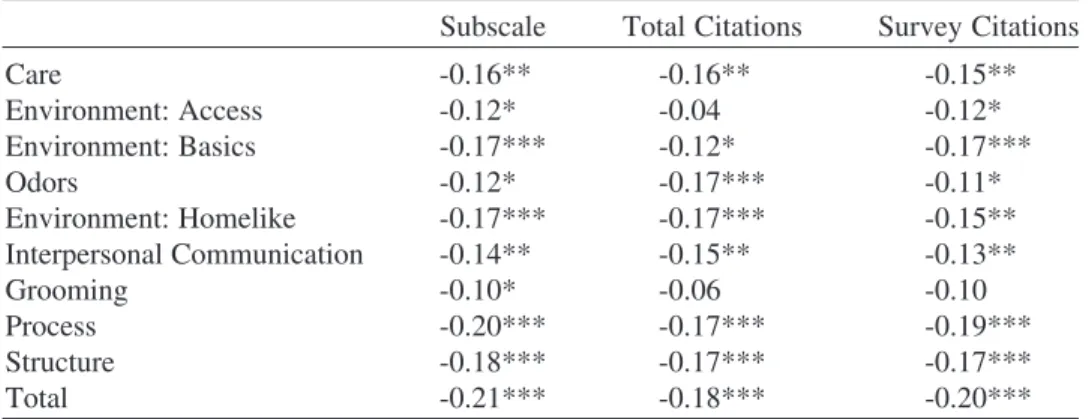
TABLE 6. Spearman Correlations of Citations With OIQ Subscales
Subscale Total Citations Survey Citations
Care -0.16** -0.16** -0.15** Environment: Access -0.12* -0.04 -0.12* Environment: Basics -0.17*** -0.12* -0.17*** Odors -0.12* -0.17*** -0.11* Environment: Homelike -0.17*** -0.17*** -0.15** Interpersonal Communication -0.14** -0.15** -0.13** Grooming -0.10* -0.06 -0.10 Process -0.20*** -0.17*** -0.19*** Structure -0.18*** -0.17*** -0.17*** Total -0.21*** -0.18*** -0.20***
Note. Citation data were not available for three Missouri homes. Cell sizes ranged from 401 to 405. *p⬍.05. **p⬍.01. ***p⬍.001.
been used as proxy measures of quality of care in nursing homes for many years by many researchers (Graber & Sloane, 1995; Harrington, Woolhandler, Mullan, Carrillo, & Himmelstein, 2001; Harrington, Zimmerman, Karon, Robinson, & Beutel, 2000). Citation data were available for all but three facilities. Citations were a result of the standard survey process or those that were initiated by complaints (Table 5 summarizes the citation data by state).
Citations were correlated with the OIQ using Spearman rank correlation coefficient (Spearman’s Rho) coefficients, and as illustrated in Table 6, total citations are significantly correlated with the total Quality score, the higher level subscales, and all subscales (p⬍ .05). These validity coefficients thus provide supporting evidence of construct validity for the OIQ with citations.
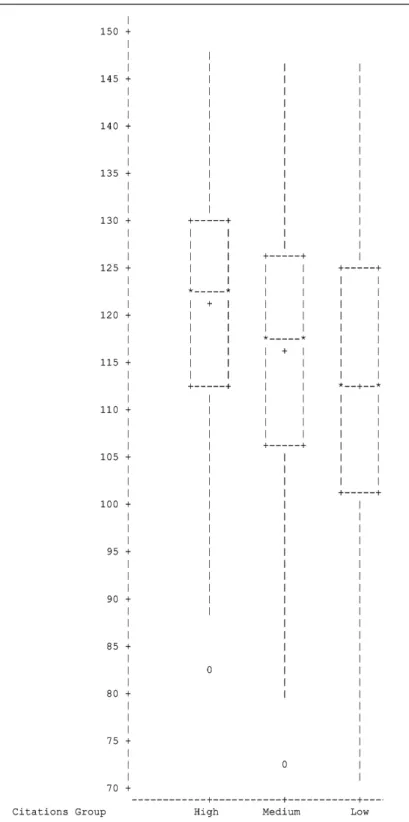
Another approach to construct validation of an instrument is a known groups (also called contrasting groups) analysis (Polit & Beck, 2004). The method involves selecting groups known to be different on some relevant factor, and then demonstrating that the groups can be distinguished by their test scores (see, e.g., Varni, Burwinkle, Jacobs, Gottschalk, Kaufman, & Jones, 2003). Facilities were rank ordered according to their total number of citations and then were divided into three groups, using the 25th and 75th percentiles. Next, the group scores for the Observable Indicators were compared across the three groups. Figure 3 shows box plots of the OIQ scores by citations groups. The nonparallel plots suggest that the known citation groups vary in the expected direction for the OIQ.
Quality Indicators. For additional construct validity evidence, QI reports were collected
by research staff from each participating facility in Wisconsin and Minnesota within a week of the observation site visit; in Missouri, QIs were calculated using the Missouri MDS data set (DUA #12500) and carefully matched to each facility’s site visit date. As a first step, individual facility QI scores for nine QIs found to be the most sensitive to discriminate among facilities with a range of quality resident outcomes (Rantz et al., 2004a) were correlated with facility OIQ scores from the first RN visits for all facilities for all states for subscales, structure and process higher level subscales, and total scale (n⳱406; one facility was primarily private pay and did not have adequate MDS data to use). Results of this analysis revealed few significant correlations except that stage 1–4 pressure ulcers was negatively correlated with the Care subscale (-.12, p⳱.02), Grooming (-0.12, p⬍.01),
Process (-.13, p⬍ 0.01), Structure (-0.10, p⳱0.04), and Total Scale (-1.13, p⬍ 0.01). These correlations in the expected direction provide some evidence of construct validity.
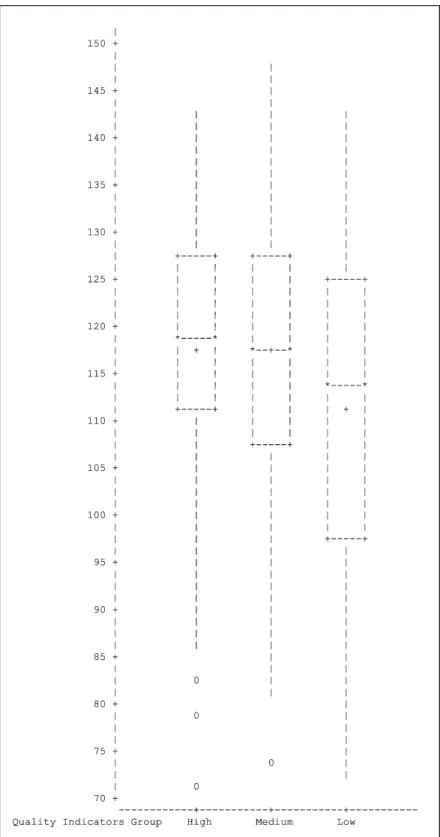
As the next step, a single variable Quality Score was created for each facility using their nine QI scores to again establish known groups and compare performance on the OIQ across groups. We used an approach to interpret good and poor quality scores for each QI using previously published interpretive thresholds (Rantz et al., 1997a, 2000b, 2004a). The single variable Quality Score was formed by adding Ⳮ1 for each QI below the lower (good) threshold, -1 for each QI above the upper (poor) threshold, and 0 for each QI between the thresholds. When facilities were ranked based on their Quality Score, three clusters of facilities were evident from the rank ordering and were interpreted as 1 (good), 2 (average), and 3 (poor) quality. Spearman’s rank correlations were used to examine the association between Quality Score and each of the OIQ scale scores. Only the Interpersonal Communication subscale was significantly correlated (q⳱0.13, p⳱0.01). Box plots were examined and illustrate trends of better OIQ scores for the facilities in group 1 (good), particularly as compared to those in group 3 (poor) for the subscales of Care, Environment: Homelike, Environment: Basics, Odor, Interpersonal Communication, Grooming, both summative subscales of Process and Structure, as well as for the total Quality score. These trends are some evidence of known group validity for the OIQ. The only subscale that did not illustrate trends in the expected direction was Environment: Access. The box plots for the total OIQ score and the quality indicator groups are displayed in Figure 4.
Quality Measures. QM scores for participating facilities were downloaded from
Nursing Home Compare Web site within 1 week of the first site visit. However, missing data from the Web site resulted in the deletion of 47 of the 407 facilities from the analysis. The QM scores of 360 participating facilities were used to divide facilities into three groups based on an average percentile rank of the facility scores for activity of daily living, pressure ulcers, pain, restraints, and infections. Groups were formed using the 25th and 75th percentiles, illustrating groups with likely good, average, or poor quality based on the QM scores. No differences in OIQ scores were detected across the groups for either individual subscales or the total score; the range of scores for the group of facilities above the 75th percentile was higher than the other groups, but the group means of the total Quality score were not different. A second approach was attempted, using factor analysis to form two factors from the four QMs, calculating the 25th and 75th percentile scores, and comparing OIQ scores for the extreme factor groups. Neither did this approach reveal any statistical differences among the groups’ OIQ scores or any discernable pattern indicating a trend in OIQ association with QMs.
Scoring Guidelines
Interpreting performance is an essential step for facilities to take to determine actions to improve quality of care, for regulators to make judgments about additional assessment or time in a facility, and for consumers to compare facilities as they make crucial choices for long-term care. To guide those interested in using the Observable Indicators Instrument, rater effect was examined for differences in subscale, summative process and structure subscales, and total scale. There were no differences in the process or structure subscales or in the total scores; the only subscales with significant differences among raters were grooming and odor. Therefore, all data from all raters in all states were used to construct ranges of scores from which to guide interpretation of scores from the instrument. Examining the distribution of scores for all observations (n ⳱694), the research team decided to use the score at the 20th percentile as suggestive of quality problems in a facility,
the score at the 80th percentile as suggestive of a quality facility, and the scores between as typical of most nursing facilities. This approach of selecting the 20th and 80th percentiles as benchmarks for interpretation of quality is similar to upper and lower control limit setting used by others (Dearmin, Brenner, & Migliori, 1995; Katz & Green, 1997; Kiefe, Woolley, Allison, Box, & Craig, 1994). The range of scores for the Observable Indicators for all observations is 56 to 148, with 103 at the 20th percentile and 128 at the 80th percentile. Therefore, the guidelines for interpretation of the OIQ total score are: • a score above 128 suggests a quality facility;
• scores between 103 and 128 suggest the typical nursing facility care quality; • a score below 103 suggests a facility with quality problems.
Detailed scoring guidelines for each subscale are available from the corresponding author, as is the complete instrument and User’s Guide. The instrument can be ordered at no charge via the Internet at www.nursinghomehelp.org, a Web site maintained by our research team for providers, consumers, regulators, and other researchers.
DISCUSSION
After extensive testing, the Observable Indicators of Nursing Home Care Quality Instru-ment has been reduced from 47 to 30 reliable and discriminating items for researchers, consumers, and regulators interested in directly observing and quickly evaluating (within 30 minutes of observation) quality of care in nursing homes. The scale has a coherent 7-factor structure that conceptually describes the multidimensional concept of nursing home care quality. The seven first-order factors group together into two second-order factors of Structure (includes Environment: Basics and Odors) and Process (includes Care Delivery, Grooming, Interpersonal Communication, Environment: Access, and Environment: Homelike) that are classic constructs of Quality (Donabedian, 1969, 1988), which was the third-order factor from the CFA of this study.
Classical Test theory results indicate the total Quality score from the Observable Indi-cators instrument has acceptable interrater and test-retest reliabilities (0.76 and 0.77 re-spectively), and very strong internal consistency (0.91). The seven primary factors, and their second-order parents, demonstrate acceptable reliability and internal consistency as well. Generalizability Theory analyses reveal that dependability of scores from the instru-ment can be improved by including a second observer who conducts a site visit and independently completes an instrument, or by a single observer conducting two site visits and completing instruments during each visit. GT analyses also indicate little additional benefit from increasing either observers or visits to more than two. Other researchers such as Hintze and Matthews (2003) have found similar effects in other instruments.
These findings are important to the utility and cost-effective application of the instrument as researchers, regulators, or consumers plan to use it. Importantly, construct validity analyses revealed a significant association (p⬍.05) between survey citations and every subscale as well as the total score of the OIQ instrument. Known groups analyses showed expected trends in the OIQ scores when facilities were classified into three quality groups based on two methods: their survey citations and their quality indicators (QIs) derived from nursing home Minimum Data Set (MDS) assessment data. Both of these sources of construct validity evidence are important to potential users of the instrument. Survey ci-tations are frequently used by researchers (Graber & Sloan, 1995; Harrington et al., 2000,
2001) as well as regulators and consumers using the Nursing Home Compare Web site maintained by the federal Centers for Medicare and Medicaid to judge quality of care, as are MDS QIs. Potential users can be assured that there is construct validity evidence for the OIQ instrument with survey citations and MDS QIs.
As states make decisions about scarce survey resources, a tool such as the OIQ could be a valuable proxy for a full, resource-intensive state survey team conducting an in-depth assessment of a facility. In this situation, it would be important for users to assure that two observers participate, or that one observer makes two visits to maximize the instrument’s dependability. State officials could review the facility MDS data for evidence of ongoing acceptable quality of care and quickly verify those findings with a short on-site visit (with two observers or one going back the next week) using the OIQ. A strength of the OIQ is that it can be completed quickly, but it requires an actual on-site observation. Evidence from MDS data are analyzed off-site and examine other specific areas of care such as specific improvement or decline in pressure ulcers or weight loss over a period of several months. With the snap-shot view of the OIQ used with the longitudinal views provided by the MDS data, the two in tandem could be of powerful assistance to regulators, con-sumers (who can use MDS-derived information via the public federal Nursing Home Compare Web site), and researchers.
The MDS-derived Quality Measures (QMs) were not associated with the results of the OIQ scores. The QMs were recorded from the Nursing Home Compare Web site at the time of the observation of each facility in the study. However, there is an apparent lag time of several months or more in data used to calculate the QMs posted on the Web site. Thus, a plausible explanation for the lack of association of the QMs with the Observable Indicators scores is the lag time. This is particularly likely in light of trends in the expected direction identified in forming groups of facilities according to MDS quality indicator (QI) scores and comparing OIQ scores. The data used for the QI analyses were closely matched to the visit date, so current resident MDS assessment data were used. Timeliness of MDS data must be considered when making quality decisions about facilities. This result is similar to earlier research by our team (Rantz et al., 2004a) that showed QI scores fluctuating for facilities as resident populations and conditions changed within facilities.
Other explanations for the lack of association with QMs could be the fewer number used (four QMs vs. nine QIs), as well as missing data from the Nursing Home Compare Web site. Because of confidentiality concerns, the Web site does not post QM scores that have small numbers of residents. This resulted in 47 facilities excluded from our QM construct validity analyses. The lack of association may also be because of differences in the calculation methods for the indicators.
The lack of association with QMs could also be of help to researchers, regulators, and consumers who are looking for alternative ways to measure different aspects of quality of care in nursing homes. The QMs can be interpreted as providing some measures of quality of care and information from the OIQ instrument can be interpreted as providing additional, different measures of dimensions of quality.
We have carried out and summarized extensive psychometric evidence that the Ob-servable Indicators of Nursing Home Care Quality Instrument generates scores that can serve several purposes. First, they may be useful for analysts or program evaluators who are interested in comparing nursing homes or in studying various nursing home interven-tions or structures. Second, the OIQ may be used by regulators as a brief assessment tool, where low scores may signal the need for a more comprehensive facility appraisal. The OIQ is not meant to replace accreditation or existing regulatory teams, and further research is needed to discover the relationship between regulator team findings (other than survey
citations) and OIQ scores. Finally, consumers who are evaluating the acceptability of potential nursing homes may appreciate a brief tool that is considerably more structured than the usual intuitive facility visit and interview.
REFERENCES
Brennan, R. L. (2001). Generalizability theory. New York: Springer.
Brown, T. A. (2006). Confirmatory factor analysis for applied research. New York: The Guilford Press.
Burger, S. G., Fraser, V., Hunt, S., & Frank, B. (1996). Nursing homes: Getting good care there. San Luis Obispo, CA: Impact Publishers/The National Citizen’s Coalition for Nursing Home Reform. Byrne, B. M. (2001). Structural equation modeling with AMOS. Mahwah, NJ: Lawrence Erlbaum. Committee on the Adequacy of Nurse Staffing in Hospitals and Nursing Homes, Institute of Medicine. (1996). Nursing staff in hospitals and nursing homes. Washington, DC: National Academy Press. Committee on Improving Quality in Long-term Care, Institute of Medicine. (2001). Improving the
quality of long-term care. Washington, DC: National Academy Press.
Committee on Nursing Home Regulation, Institute of Medicine. (1986). Improving the quality of care in nursing homes (IOM-85–10). Washington, DC: National Academy Press.
Dearmin, J., Brenner, J., & Migliori, R. (1995). Reporting on QI efforts for internal and external customers. Joint Commission Journal on Quality Improvement, 21, 277–288.
Donabedian, A. (1969). Some issues in evaluating the quality of nursing care. American Journal of Public Health, 59, 1833–1836.
Donabedian, A. (1988). The quality of care: How can it be assessed? Journal of the American Medical Association, 260, 1743–1748.
Fleiss, Joseph L. (1981). Statistical methods for rates and proportions (2nd ed.). New York: Wiley. Graber, D. R., & Sloane, P. D. (1995). Nursing home survey deficiencies for physical restraint use.
Medical Care, 33, 1051–1063.
Harrington, C., Woolhandler, S., Mullan, J. Carrillo, H., & Himmelstein, D. U. (2001). Does inves-tor-ownership of nursing homes compromise the quality of care? American Journal of Public Health, 91, 1452–1455.
Harrington, C., Zimmerman, D., Karon S.L. Robinson, J., & Beutel P. (2000). Nursing home staffing and its relationship to deficiencies. Journals of Gerontology Series B-Psychological Sciences & Social Sciences, 55, S278–S287.
Hartley, H. O., Rao, J. N. K., & LaMotte, L. R. (1978). A simple “synthesis”-based method of variance component estimation. Biometrics, 34, 233–242.
Health Care Financing Administration. (2000). Report to Congress: Appropriateness of minimum nurse staffing ratios in nursing homes. Baltimore: Author.
Hintze, J., & Matthews, W. J. (2003, April). Generalizability of systematic direct observation data across occasion and time. Paper presented at the annual meeting of the National Association of School Psychologists, Toronto, CA. Summary available at http://www.umass.edu/education/ schoolpsychology/Presentations/G-theoryNASP.pdf.
Hu, L.-T., & Bentler, P. M. (1999). Cutoff criteria for fit indices in covariance structure analysis: Conventional criteria versus new alternatives. Structural Equation Modeling, 6, 1–55. Jaeger, R. M. (1991). Selection of judges for standard setting. Educational Measurement: Issues &
Practice, 10, 3–14.
Kane, R. L. (1995). Improving the quality of long-term care. Journal of the American Medical Association, 273, 1376–1380.
Kane, R. A., Kane, R. L., & Ladd, R. C. (1998). The heart of long-term care. New York: Oxford University Press.
Katz, J. M., & Green, E. (1997). Managing quality: A guide to system-wide performance manage-ment in health care (2nd ed.). St. Louis: Mosby.
Kiefe, C., Woolley, T. W., Allison, J. J., Box, J. B., & Craig, A. S. (1994). Determining benchmarks: A data-driven search for the best achievable performance. Clinical Performance and Quality Health Care, 2, 190–194.
Landis, J. R., & Koch, G. G. (1977). The measurement of agreement for categorical data. Biometrics, 33, 159–174.
Littell, R. C., Milliken, G. A., Stroup, W. W., & Wolfinger, R. D. (1996). SAS System for Mixed Models. Cary, NC: SAS Institute.
Morris, J. N., Moore, T., Jones, R., Mor, V., Angelelli, J., Berg, K., Hale, C., Morris, S., Murphy, K. M., & Rennison, M. (2002). Validation of long-term and post-acute care quality indicators. Executive summary of report to CMS, Contract # 500–95–0062/TO#2.
Nursing Home Compare (NHC). (2004). Available from http://www.medicare.gov/NHCompare/ Include/DataSection/Questions/SearchCriteria.asp?version ⳱ default&browser ⳱ IE%7C6% 7CWinXP&language⳱English&defaultstatus⳱0&pagelist⳱Home
Pear, R. (2000). U.S. recommending strict new rules at nursing homes. New York Times, July 23, p. 1. Pear, R. (2001). U.S. may ease rein on nursing homes. New York Times, September 7, p. 1, A16. Polit, D. F., & Beck, C. T. (2004). Nursing research (7th ed.). Philadelphia: Lippincott, Williams
& Wilkins.
Rantz, M. J., & Connolly, R. (2004). Measuring nursing care quality and using large data sets in non-acute care settings: State of the science. Nursing Outlook, 52(1), 23–37.
Rantz, M. J., Hicks, L., Grando, V. T., Petroski, G. F., Madsen, R. W., Mehr, D. R., Conn, V., Zwygart-Stauffacher, M., Scott, J., Flesner, M., Bostick, J., Porter, R., & Maas, M. (2004b). Nursing home quality, cost, staffing, and staff-mix. Gerontologist, 44, 24–38.
Rantz, M .J., Hicks, L., Petroski, G. F., Madsen, R. W., Mehr, D. R., Conn, V., Zwygart-Stauffacher, M., & Maas, M. (2004a). Stability and sensitivity of nursing home quality indicators. Journal of Gerontology: Medical Science, 59A(1), 79–82.
Rantz, M., Jensdottir, A. B., Hjaltadottir, I., Gudmundsdottir, H., Sigurveig Gudjonsdottir, J., Brun-ton, B., & Rook, M (2002). International field test results of the observable indicators of nursing home care quality instrument. International Nursing Review, 49, 234–242.
Rantz, M. J., & Mehr, D. R. (2001). A quest to understand and measure nursing home quality of care. Long-Term Care Interface, 2, 34–38.
Rantz, M. J., Mehr, D. R., Conn, V., Hicks, L. L., Porter, R., Madsen, R. W., Petroski, G. F., & Maas, M. (1996). Assessing quality of nursing home care: The foundation for improving res-ident outcomes. Journal of Nursing Care Quality, 10(4), 1–9.
Rantz, M. J., Mehr, D. R., Petroksi, G. F., Madsen, R. W., Popejoy, L., Hicks, L. L., Conn, V. S., Grando, V. T., Wipke-Tevis, D. D., Bostick, J., Porter, R., Zwygart-Stauffacher, M., & Maas, M. (2000a). Initial field-testing of an instrument to measure “Observable indicators of nursing home care quality.” Journal of Nursing Care Quality, 14, 1–12.
Rantz, M. J., Mehr, D., Popejoy, L., Zwygart-Stauffacher, M., Hicks, L., Grando, V., Conn, V., Porter, R., Scott, J., & Maas, M. (1998). Nursing home care quality: A multidimensional theo-retical model. Journal of Nursing Care Quality, 12, 30–46.
Rantz, M. J., Petroski, G., Madsen, R., Mehr, D., Popejoy, L., Hicks, L., Porter, R., Zwygart-Stauffacher, M., & Grando, V. (2000b). Setting thresholds for quality indicators derived from MDS data for nursing home quality improvement reports: An update. Joint Commission Journal on Quality Improvement, 26, 101–110.
Rantz, M. J., Petroski, G.F., Madsen, R. W., Scott, J., Mehr, D., Popejoy, L., Hicks, L., Porter, R., Zwygart-Stauffacher, M., & Grando, V. (1997a). Setting thresholds for MDS quality indicators for nursing home quality improvement reports. Joint Commission Journal on Quality Improve-ment, 23, 602–611.
Rantz, M. J., Popejoy, L., Mehr, D., Zwygart-Stauffacher, M., Hicks, L., Grando, V., Conn, V., Porter, R., Scott, J., & Maas, M. (1997b). Verifying nursing home care quality using minimum data set quality indicators and other quality measures. Journal of Nursing Care Quality, 12(2), 54–62. Rantz, M. J., Popejoy, L., Petroski, G. F., Madsen, R. W., Mehr, D. R., Zwygart-Stauffacher, M.,
(2001). Randomized clinical trial of a quality improvement intervention in nursing homes. Gerontologist, 41, 525–538.
Rantz, M. J., Vogelsmeier, A., Manion, P., Minner, D., Markway, B., Conn, V., Aud, M. A., & Mehr, D. R. (2003). A statewide strategy to improve quality of care in nursing facilities. Ger-ontologist, 43, 248–258.
Rantz, M. J., Zwygart-Stauffacher, M., Popejoy, L., Grando, V., Mehr, D., Hicks, L., Conn, V., Wipke-Tevis, D., Porter, R., Bostick, J. & Maas, M. (1999). Nursing home care quality: A multidimensional theoretical model integrating the views of consumers and providers. Journal of Nursing Care Quality, 14(1), 16–37.
SPSS for Windows [computer program] (2004). Version 12.02. Chicago: SPSS, Inc.
Varni, J. W., Burwinkle, T. M., Jacobs, J. R., Gottschalk, M., Kaufman, F., & Jones, K. L. (2003). The PedsQLTM in Type 1 and Type 2 Diabetes: Reliability and validity of the Pediatric Quality of Life InventoryTMGeneric Core Scales and Type 1 Diabetes. Diabetic Care, 26, 631–637. Wainer, H. (1976). Estimating coefficients in linear models: It don’t make no never mind.
Psycho-logical Bulletin, 83, 213–217.
Waltz, C. F., Strickland, O. L., & Lenz, E. R. (2005). Measurement in nursing and health research (3rd ed.). New York: Springer.
Zimmerman, D. R., Karon, S. L., Arling, G., Clark, B. R., Collins, T., Ross, R., & Sainfort, F. (1995). Development and testing of nursing home quality indicators. Health Care Financing Review, 16(4), 107–127.
Acknowledgments. The authors wish to acknowledge the contributions of other University of Missouri-Columbia MDS and Nursing Home Quality Research Team: Rose Porter, RN, PhD, Dean; Deidre D. Wipke-Tevis, PhD, RNC, CVN, Associate Professor; Myra Aud, RN, PhD, Assistant Professor; Jill Scott-Cawiezell, RN, PhD, Assistant Professor; Donna Minner, Carol Seim, Clara Boland, Amy Vo-gelsmeier, Katy Nguyen, Elizabeth Sutherland, Margie Diekemper, Quality Improvement Nurses, Sin-clair School of Nursing; Steve Miller, Data Support staff; Debra Oliver, PhD, Assistant Professor; Consultants to our team: Dr. Robin Froman, RN, PhD, FAAN, Dean, School of Nursing, University of Texas Health Science Center at San Antonio; Dr. Gwen Uman, Founding Partner, Vital Research, Los Angeles, California; Dr. David Zimmerman, Director, Health Systems Research and Analysis, University of Wisconsin-Madison; and Dr. Francois Sainfort, Professor, Georgia Institute of Technol-ogy. The members of the MU MDS and Nursing Home Quality Research Team gratefully acknowledge the ongoing support of the Missouri Department of Health and Senior Services staff, the Missouri Healthcare Association, and the Missouri Association of Homes and Services for the Aged; they are truly committed to helping homes embrace quality improvement. Research activities were supported by NINR 1R01NR/AG05287–01A2. Opinions are those of the authors and do not represent NINR. Copies of instrument are available on request at www.nursinghomehelp.org.
Offprints. Requests for offprints should be directed to Marilyn J. Rantz, PhD, RN, FAAN, School of Nursing 5406, University of Missouri, Columbia, MO 65211. E-mail: [email protected]