Effecting and Measuring Risk Reduction in Software Development
Desmond GREER*, David W. BUSTARD*
and Toshihiko SUNAZUKA†
Abstract
This paper describes an application of SERUM, a risk management methodology, to the definition and prioritisation of changes in a network management system at NEC Corporation. SERUM makes use of two risk reduction strategies: (i) performing a business analysis as the means of establishing required system changes and (ii) using an evolutionary delivery mechanism as means to implement those changes. SERUM also makes use of explicit risk management techniques. These are effected right at the start in the business analysis stage and through to the stage where evolutionary system changes are planned. As part of the planning process, SERUM uses a metric, Relative Risk Reduction Efficacy (RRRE), which helps to assess the risk-reducing effect of a system change. This metric, along with assessments of costs, benefits and development risks, enables system changes to be prioritised in preparation for implementing them in an evolutionary fashion.
Keywords: Software risk, Risk management, Project management, SERUM, Risk reduction, Evolutionary development, Soft Systems Methodology
* University of Ulster, School of Information and Software Engineering, Coleraine, County Londonderry, UK
† SPEED Technology Lab., Software Design Labs., NEC Corporation
1. Introduction
There are inherent risks in all software development projects. If those risks are not handled properly, a project may exceed its schedule or budget, or the resulting product fails to meet the needs of the organisation in which it is used. SERUM (Software Engineering Risk: Understanding and Management) is a risk management methodology that has been developed to help identify and control such risks (Greer, 1997). SERUM assumes that system change is evolutionary. In evolutionary development (Gilb, 1998), parts of a system are developed and delivered in phases. Each delivery is a complete system that is of value to the client. The delivered system is evaluated by the client and the results fed back to the developers who then take that information into account when implementing subsequent phases. This may lead to large or small adjustments to objectives after each delivery.
SERUM helps define the change increments through an analysis of the associated costs, benefits and risks. This paper describes and discusses the results of applying SERUM to the definition and prioritisation of changes in
the NEC Corporation’s network management system.
This example emerged from an ‘action research’ study (Susman, 1978) at NEC undertaken by the first named author during a visiting fellowship in the summer of 1998 (Greer, 1998).
In the next section, a model of the NMS system is developed in a form suitable for SERUM analysis (diagnosing stage). The third section then considers how changes to the NMS system can be identified through this model (action planning and action taking). In this section, the SERUM method as applied to the NMS system is described. The paper then shows how the
identified changes are refined through risk analysis, and then prioritised taking account of cost, benefit and risk factors. During the application of SERUM, a new metric was introduced, the Relative Risk Reduction Efficacy (RRRE), to help compare system changes in terms of their effectiveness in reducing overall risk. A concluding section evaluates the approach and describes lessons learned from the research (Evaluating and Specifying learning stage). Directions for future research and development are identified.
2. The Network Management System Case
Study
The Network Management System (NMS) is used by large telecommunications and Internet service providers for centralised management of networks distributed across cities, countries or even continents. Physically, the NMS consists of at least one server and several workstations connected to the managed network. The NMS software allows a network to be modelled. The main functions of the model cover standard concerns such as network performance, fault handling, configuration management, accounting and security. The managed network is modelled graphically for user convenience.
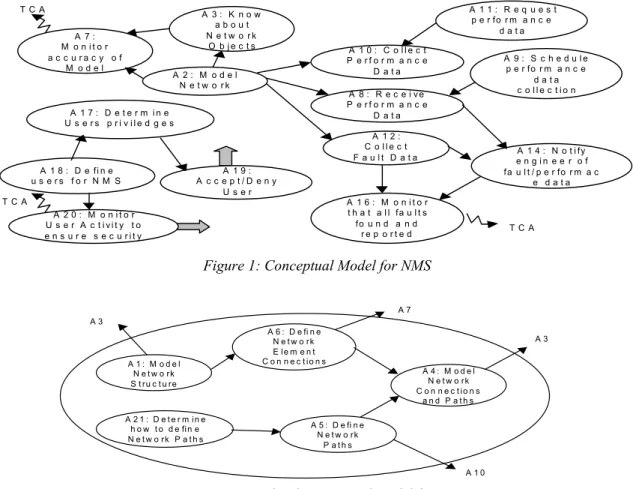
The diagram in Figure 1 is derived from a Soft Systems Methodology (Checkland, 1990; Wilson, 1990) analysis and shows the activities required to implement the NMS. The text in the ellipses represents activities and the arrows represent dependencies between these activities. The thick arrow indicates a dependency with all of the other activities and TCA stands for a standard activity, “Take Control Action”. One of the activities, “A2: Model Network” can be further defined at a lower level as shown in Figure 2.
A 2 : M o d e l N e t w o r k A 1 2 : C o l l e c t F a u l t D a t a e n g i n e e r o f A 1 4 : N o t i fy fa u l t / p e r fo r m a c e d a t a A 1 1 : R e q u e s t p e r fo r m a n c e d a t a A 9 : S c h e d u l e p e r fo r m a n c e d a t a c o l l e c t i o n A 1 9 : A c c e p t / D e n y U s e r A 1 8 : D e fi n e u s e r s f o r N M S A 1 7 : D e t e r m i n e U s e r s p r i v i l e d g e s A 3 : K n o w a b o u t N e t w o r k O b j e c t s T C A T C A A 7 : M o n i t o r a c c u r a c y o f M o d e l A 1 0 : C o l l e c t P e r f o r m a n c e D a t a A 2 0 : M o n i t o r U s e r A c t i v i t y t o e n s u r e s e c u r i t y T C A A 8 : R e c e i v e P e r f o r m a n c e D a t a A 1 6 : M o n i t o r t h a t a l l fa u l t s fo u n d a n d r e p o r t e d
Figure 1: Conceptual Model for NMS
A 1 : M o d e l N e t w o rk S t ru c t u re A 6 : D e fi n e N e t w o rk E le m e n t C o n n e c t io n s A 2 1 : D e t e r m in e h o w t o d e fin e N e t w o rk P a t h s A 4 : M o d e l N e t w o rk C o n n e c t io n s a n d P a t h s A 3 A 7 A 3 A 1 0 A 5 : D e fi n e N e t w o rk P a t h s
Figure 2: Lower level Conceptual model for NMS
SSM supports a goal driven approach to systems analysis. This is achieved by first documenting each
intended purpose of a system as a root definition. For
example, the following is a simple root definition for the NMS.
NMS Root Definition
A telecommunications-provider owned system to manage a network, on behalf of engineers, by modelling the network and responding to information on performance and faults collected using the model, taking into account the need for security and accountability.
A root definition identifies a central goal or purpose of a
system and the transformation it performs (to manage a
network). It may also, optionally, include the owner of
the system (telecommunications provider), the customer
for the system (same as owner here), the actors of the
transformation (engineers) and any environmental
constraints (security and accountability). A conceptual
model is constructed from a root definition identifying
the activities stated or implied in that definition. Systems often have several root definitions as there may be different goals identified. As a simplification only one model is developed here. Where there are multiple conceptual models they can be merged to form a single system model, introducing activities as necessary to resolve any conflicts that arise.
Comparing the activities in a conceptual model with the current implementation will identify differences. Typically, this will highlight activities where
improvement is desirable. Also, some required activities may currently be missing altogether and others appear unnecessary in relation to the stated purpose. An analysis of these differences leads to recommendations for system improvement.
3. Risk Management
“Risk is the potential for realisation of unwanted, negative consequences of an event” [Rowe, 1988].
Thus, risk has two aspects: Probability and Loss.
Risks to an organisation can arise from several sources.
There may be technical risks in the organisation’s
ongoing operations. Software technical risks are those
arising specifically due to software malfunction or any unexpected behaviour in the software concerned
[Chittister & Haimes, 1994]. Software development risk
is any possibility of failure in the software development process. This includes project risks such as those relating to schedule or budget.
Risk Management covers the activities necessary to analyse and control risk. Boehm (1989) breaks risk
management into six stages: Identification, Assessment,
Prioritisation, Management Planning, Resolution and
Monitoring. The first three stages are concerned with analysis and the latter three with reduction and control. This is explicit risk management but risk can also be reduced implicitly through appropriate design of the software development process (Greer, 1997(1)). For example, testing and inspections are risk reduction techniques in that they lower technical risk.
The identification of risk has been the subject of many studies (e.g. Down, 1994), the most popular method being the use of a checklist. In the NMS case study, a checklist based on the activity model (Figures 1 & 2) was derived from a consideration of the inputs, outputs and transformation in each activity in the model.
Risk Exposure (RE) is the product of the probability of a risk occurring and the associated loss.
RE = Prob(Risk) * Loss associated with Risk (Boehm, 1989)
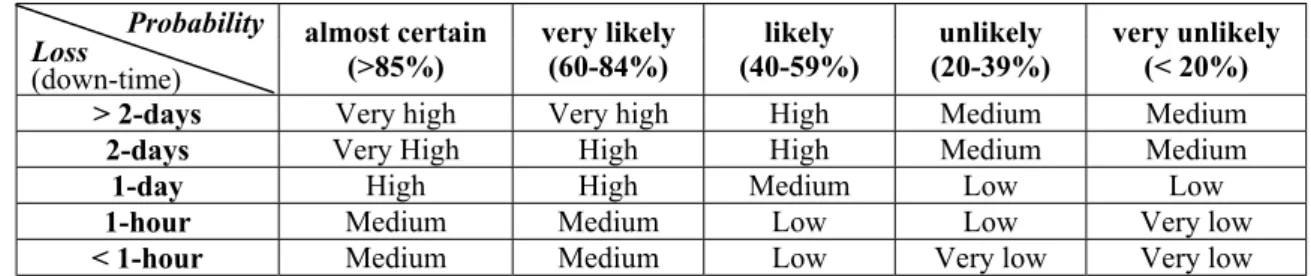
The choice of unit for loss can be difficult. It may be estimated in financial terms, for example, but other units such as time may be more appropriate in some circumstances. In fact, for high-level planning, it can be more convenient to score the probability and loss on a cardinal scale (e.g. 1 to 5) or even replace the scale with more meaningful explanatory terms. Table 1, for example, illustrates the approach found most useful in the NMS study. Loss is given in terms of ‘down-time’, ranging from ‘> 2-days’ to ‘< 1-hour’. Probability ranges from ‘almost certain’ to ‘very unlikely’. The product risk exposure similarly covers a five-point scale from ‘very high’ to ‘very low’.
Table 1: Risk Exposure Table for Technical Risk in the NMS project Probability Loss (down-time) almost certain (>85%) very likely (60-84%) likely (40-59%) unlikely (20-39%) very unlikely (< 20%) > 2-days Very high Very high High Medium Medium
2-days Very High High High Medium Medium
1-day High High Medium Low Low
1-hour Medium Medium Low Low Very low
< 1-hour Medium Medium Low Very low Very low Figure 3 shows the results of one such assessment in the NMS case study.
Activity:A1- Model Network Structure
Current mechanism: Create root and submaps. Add symbols by dragging from template, set the selection
name linking to the parent symbol, then domains, then office, then NE, each time entering the parent details
Risk Probability Impact Reduction Strategy Contingency
Network grows so that adding
to it becomes difficult Likely (3) < 1hr loss (1) Advise users to create excess capacity when modelling in first instance
Remodel Because of a deep hierarchy
in the model, it becomes difficult to split domains
Unlikely (2) 2-day
loss (4)
Advise users to create excess capacity when modelling in first instance
Remodel
Figure 3: Sample Risk Assessment in NMS study
A similar approach is used in identifying and assessing risk in the proposed mechanisms relating to each activity in the model. Hence, there is an assessment of risks in the current mechanism and in the proposed mechanism for each activity. Proposed changes can then be assessed in their efficacy in reducing this risk.
4. SERUM
The SERUM methodology (Software Engineering Risk: Understanding and Management) combines two inherent
risk-reducing techniques: Business Analysis and
Evolutionary Development. The Business Analysis approach is based on Soft Systems Methodology (Checkland, 1990, Wilson, 1990) and Evolutionary Development on Gilb’s (1988) Evolutionary Delivery. Software risk and business risks are intertwined. While much work has been done on risks associated with software development and on risks associated with the operation of computing systems, little attention has been paid to the relationship between risks to a business through software systems. This is despite the fact that computing solutions are increasingly used in Business
Process Reengineering [Hammer, 1993] which is by nature high risk. SERUM uses a top-down approach of first analysing the business before considering computing support within that business. Risk is examined at each level.
Starting with a business analysis was found to offer several risk-reducing benefits. Firstly, the risk of placing an undue reliance on a computing system to bring about improvement is avoided. In traditional systems analysis, there is a tendency to assume at the outset that computing facilities are needed. SSM instead focuses on business needs, without any assumptions about how those needs will be met. In this way the business can be improved in whatever way is considered appropriate and may not involve computing development at all.
Secondly, the risk that system changes do not achieve potential benefit (or that the solution is merely a
computerised version of the current system) is reduced
sincethe first models developed in SSM (root definitions
and conceptual models) describe an ‘ideal’ world and
consider the activities that should be carried out rather
Thirdly, allowing multiple perspectives on the purpose of the system reduces the risk that system changes will fail to satisfy those in the problem situation. SSM allows several conceptual models to be produced, each with a different central purpose.
Fourthly, the inclusion of monitoring activities measure the effectiveness, efficacy and economy reducing the risk that system changes do not have the effect predicted or
that the system deteriorates over time.
While all process models should implicitly reduce risk, the evolutionary development model offers further advantages [Greer, 1997(2)]. Firstly, proposed changes can be prioritised according to their user-value to development cost ratio [Gilb, 1988] so that the initial changes, at least, should provide a good return for the costs involved. Hence the risk of losing user support is abated since users get a return early on in the process and have the opportunity, via feedback to the next stage to influence the development process. Secondly, if a change proves to be unsatisfactory, the cost is not so severe if the evolutionary steps are small. Thirdly, there is some flexibility in the changes implemented at each stage so if an overrun seems likely some aspects of the change can be deferred to a later release. Thus late delivery of a version of the software need never occur. Fourthly, the
risk of budget overrun is reduced because the stages are
relatively small and consequently easier to analyse and
cost. Fifthly, the risk of environmental changes
invalidating the system changes is reduced since the changes are scheduled relatively frequently so that environmental changes can be detected and responded to relatively quickly.
On completing a business analysis through SSM the problem is then to decide which changes to include in each delivered phase. The hypothesis tested in this study is that the priority of evolutionary steps can be determined using the following criteria:
• The estimated cost of the development necessary to
implement the change;
• The estimated benefits arising from implementing
the change;
• The risks and/or problems abated by delivering the
change;
• The risks that may be introduced by implementing a
change; and
• The risks in the process of implementing a change.
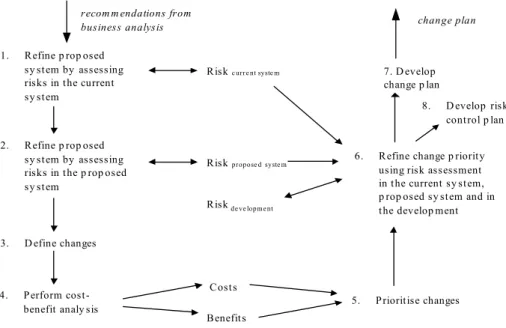
The approach is based on a combined cost-benefit and risk analysis of the current system, the proposed system and the change process. It is summarised in Figure 4.
1. Refine p rop osed sy stem by assessing risks in the current sy stem
2. Refine p rop osed sy stem by assessing risks in the p rop osed sy stem
3. D efine changes
4. Perform
cost-benefit analy sis 5. Prioritise changes
6. Refine change p riority using risk assessment in the current sy stem, p rop osed sy stem and in the develop ment
7. D evelop change p lan Riskc urre nt syste m
Riskpropose d syste m
Riskde ve lopme nt
Costs Benefits
8. D evelop risk control p lan
recom m endations from
business analysis change plan
Figure 4: Overview of SERUM
Its input is a proposed new system and its output is a
change plan, with associated risk control plan. The basis of the SERUM method is that the order in which a proposed system should be delivered may, initially, be considered as a function of five variables. Implementation Priority
= f ( cost, benefit, riskcurrent system , riskproposedsystem , riskdevelopment ) In order to consider which system changes are the most
effective in reducing risk, it is necessary to establish some measurement for comparing their risk reducing efficacy. Risk Reduction Efficacy (RRE) which is a metric for defining the effectiveness of a system change for reducing risk, was established as a result of this
experiment. RRE for a given system change may defined as
(
)
∑
×
=
Risks Technical Allon
contributi
RE
RRE
where• RE is risk exposure for a risk identified in the current or proposed system,
• contribution is a factor for the increase or decrease
in risk exposure due to the change, being positive or negative respectively, and
• All Technical Risks refers to each instance of a risk defined in the current and proposed system.
Relative Risk Reduction Efficacy (RRRE) for a system change may then be defined as follows:
(
)
∑
∑
×
=
isks TechnicalR Current All C Risks Technical AllRE
on
contributi
RE
RRRE
Using RRRE, it is then possible to compare system changes for efficacy in risk reduction and to use this data in prioritising system changes for an evolutionary delivery plan.
Figure 5 illustrates the type of relationship that can exist between system changes, activities in the current system, and the risks associated with those activities. In each case, risk exposure may be reduced or increased. Change C1 affects activities A1 and A2; change C2 affects A2 and A3. Activity A1 has associated risks R1 and R2; A2 has risk R3; and A3 has risks R4 and R5. To find how much a given system change reduces risk, it is necessary to assess its contribution to each individual risk exposure for each of the activities affected. For change C2, there is a contribution from R3, R4 and R5, with R4 and R5 reduced and R3 increased. RRE will then be the sum of the three products combining exposure and contribution. If, say, C2 reduces risk exposure R4 by 50% and R5 by
40% and that C2 increases the risk exposure R3 by 20%, the RRE would be (R4*0.5) +(R5*0.4) + (R3*-(0.2))
C2 C1 A1 A2 A3 R1 (reduced by C1) R2 (reduced by C1)
R3 (reduced by C1 and increased by C2) R4(reduced by C2)
R5(reduced by C2)
Figure 5. Illustration of the relationship between changes, activities and risks.
Specific development risks must also be identified and assessed. A risk reduction in introducing a system change may well be negated by a high risk in the development process. Established risk identification techniques such as the SEI’s taxonomy approach may be used. The SEI taxonomy in some cases requires detailed knowledge about the development tools and techniques. Since the SERUM approach is at a higher level and at the planning stage, some of the SEI items are not applicable and so a checklist derived from the SEI taxonomy was used instead.
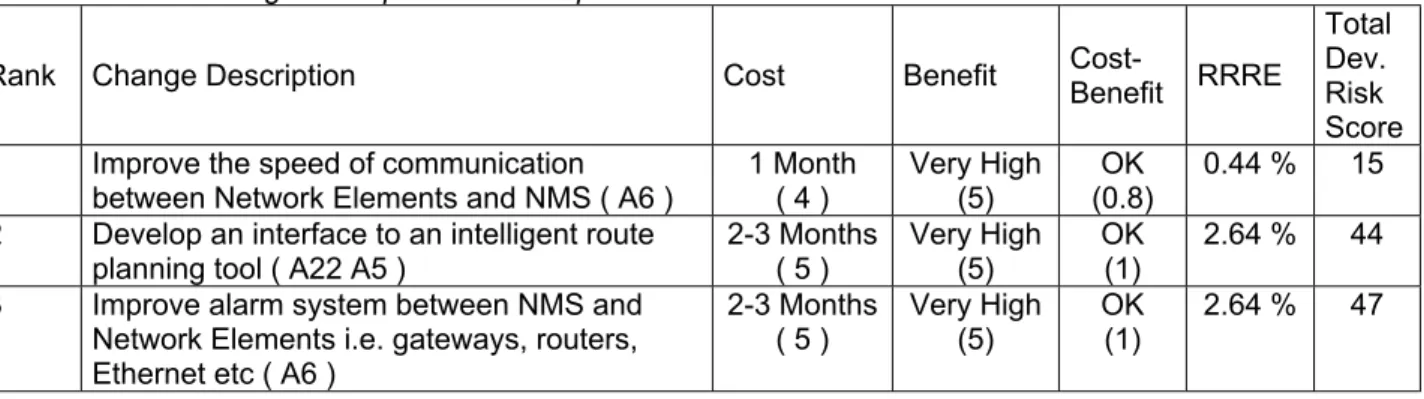
Figure 6 shows a ranking of evolutionary changes (only the top three are shown here) as derived in this case study. The ranking in this case is primarily by most beneficial changes first. As can be seen, where two changes are ranked the same a further sort on a different parameter may be used. For example, the changes ranked 2 and 3 are distinguished only by the measure of development risk involved. Similarly, the analyst may choose to take the information in a column not the primary sort column, to make adjustments to the ranking.
Nms - Change Plan
29/7/1998
Last Sort: 1. Descending Benefit 2. Ascending Cost 3. Descending Change’s Risk Reduction Efficacy 4. Ascending Development Risk Exposure
Rank Change Description Cost Benefit Cost-Benefit RRRE
Total Dev. Risk Score
1 Improve the speed of communication
between Network Elements and NMS ( A6 ) 1 Month ( 4 ) Very High (5) (0.8) OK 0.44 % 15
2 Develop an interface to an intelligent route
planning tool ( A22 A5 ) 2-3 Months ( 5 ) Very High (5) OK (1) 2.64 % 44
3 Improve alarm system between NMS and
Network Elements i.e. gateways, routers, Ethernet etc ( A6 ) 2-3 Months ( 5 ) Very High (5) OK (1) 2.64 % 47
Figure 6: Ranked changes
5. Lessons Learned
In this paper we have used action research to investigate the application of the SERUM method. SERUM combines the use of business analysis and evolutionary delivery and complements these implicitly risk-reducing techniques with explicit risk management techniques. The SERUM method considers system changes in terms of their costs and benefits and also their effects on overall risk exposure due to their implementation. To
achieve this, risks are explicitly identified and measured for the current system, the proposed system and the development effort.
The method has found to be a useful means for introducing risk management to the software development process. A number of developments have arisen, as a direct result of the trial. Firstly, it was found much easier to assess risk probability and impact in terms of words rather than numbers. In previous descriptions of SERUM we have used abstract phrases
such as “Very High” to describe a loss associated with a risk. However in practice, it was found much more convenient to use terms such as “1 day loss” which actually meant something to the project manager. The same is true of assessing probability. Secondly, a metric has been defined: Risks Reduction Efficacy, which aids the decision- maker in prioritising system changes. This was necessary so that changes could be assessed in terms of their risk reducing ability and allows information gathered from the Soft System Methodology to be used in a consistent manner. Thirdly, the main criterion for prioritisation in this study was found to be cost, whereas cost-benefit ratio might have been expected. This indicates that the ranking criteria may change from project to project. Fourthly, evidence for the usefulness of the method was obtained from informal discussions with the company participants. This was further reinforced by the fact that the final ranked list matched a ranking produced by one of the key members of the team based on his experience. Fifthly, tool support for the SERUM method has been refined based on user feedback.
Future research will concentrate on improving the evolutionary planning part of the methodology. At present the method uses a sort followed by the analysts manual adjustments to obtain the required ranking of system changes. The intention is to automate this process further, by ranking the criteria used for the plan.
ACKNOWLEDGEMENTS
NEC Corp. are gratefully acknowledged for their support in carrying out the trial of the SERUM method at their plants in Tokyo. Funding and support in respect of travel and subsistence by The Great Britain Sasakawa Foundation and The British Council are also acknowledged.
REFERENCES
1. Boehm, B.W., Software Risk Management, IEEE
Computer Society Press Washington D.C, 1989. 2. Brooks, F. The Mythical Man-Month, Addison-Wesley,
MA, 1975.
3. Checkland P.B. and Scholes, J: Soft Systems
Methodology in Action, Wiley, 1990.
4. Chittister, C. and Haimes, Y.Y., Assessment and
Management of Software Technical Risk, IEEE
Transaction on Systems, Man, and Cybernetics, vol. 24, no. 2, Feb., 1994.
5. Down, A., Coleman, M., Absalon, P., Risk
Management for Software Projects, McGraw-Hill,
London, 1994.
6. Gilb, T., Principles of Software Engineering
Management, Addison-Wesley, 1988.
7. Greer, D. and Bustard, D.W., Risk Management:
Implicit and Explicit, Proceedings of the 5th SEI
conference on Risk Management, April, 1997(1).
8. Greer, D. and Bustard, D.W., SERUM - Software
Engineering Risk: Understanding and Management,
The International Journal of Project & Business Risk, vol. 1, Issue 4, winter, pp. 373-388, Project Manager Today Publications, 1997(2).
9. Greer, D., Report on SERUM trial at NEC Corp.,
University of Ulster, 1998.
10. Hammer, M and Champy, J., Reengineering the
Corporation - A Manifesto for Business Revolution,
Nicholas Brealey Publishing, 1993.
11. Rowe, W.D., An Anatomy of Risk, Robert E. Krieger
Pub Co, FL, 1988.
12. Susman, G.I., and Evered, R.D, An Assessment of the
Scientific Merits of Action Research, Administrative
Science Quarterly, vol. 23, pp 582-603, Dec. 1978.
13. Wilson B: Systems: Concepts, Methodologies and
Applications, 2nd Edition, Wiley, 1990.
* * * * * * * * * * * * * * *
Des GREER is a lecturer in the School of Information and Software Engineering at the University of Ulster in Northern Ireland. He has been lecturing in Software Engineering related topics for the past 7 years. Prior to this he was an analyst/programmer at Short Bros., a Belfast aerostructures company. His research area is in Software Engineering with a particular interests in Software Risk Analysis and Requirements Engineering.
* * *
David BUSTARD is a Professor of Computing Science and Head of the School of Information and Software Engineering at the University of Ulster in Northern Ireland. His research area is software engineering, with particular emphasis on requirements engineering at the business analysis level. This work involves the integration of various techniques including Soft Systems Methodology, Object-Oriented Development, Risk Management and Formal Methods.
Prof. Bustard is a Chartered Engineer, a member of the British Computer Society and a member of the IEEE.
* * *
Toshihiko SUNAZUKA received his B.E. and M.S. degrees in industrial engineering from Waseda University in 1980 and 1982, respectively. He joined NEC Corporation in 1982, and is now Manager of SPEED Technology Lab., Software Design Labs. He is engaged in the research and development of software engineering. His research interests include software process assessment and improvement (SPA/I), software metrics and software quality assurance.
Mr. Sunazuka is a member of the Information Processing Society of Japan and the Japanese Society for Quality Control.