90-Day Cycle: Exploration of Math Intensives as a Strategy to Move More Community College Students Out of Developmental Math Courses
Jennifer Zoltners Sherer Alicia Grunow
Acknowledgements
This work was made possible by the support of The Carnegie Foundation for the
Advancement of Teaching. Founded by Andrew Carnegie in 1905 and chartered in 1906 by an act of Congress, The Carnegie Foundation for the Advancement of Teaching is an independent policy and research center. Its current mission is to support needed
transformations in American education through tighter connections between teaching practice, evidence of student learning, the communication and use of this evidence, and structured opportunities to build knowledge.
We would like to acknowledge the contributions of The Carnegie Foundation for the Advancement of Teaching advisory group: Rose Asera, Bernadine Fong, Uri Treisman, Cathy Casserly, Gay Clyburn, John Dehlin, Magdalene Lampert, Nisha Patel, Myra Snell, Jim Stigler and Guadalupe Valdes. The project was directed by Carnegie President Anthony Bryk, Senior Scholar Louis Gomez and Associate Partner Alicia Grunow. In addition, we would like to thank the individuals who shared, via phone conversations and email, information and resources about developmental math programs, strategies and data: Paul Arcario, Elaine Baker, Elisabeth Barnett, Michael Basileo, Trudy Bers, Irma Camacho, Jay Cho, Robert Cipolla, William Coe, Nancy Cure, Ann Davis, Fena Garza, Kamal Hajallie, Deborah Harmon, Deborah Harrington, Kathy Hoover, Rob Johnstone, Brock Klein, Ed Madonna, Margaretta Mathis, Lisa Mallozzi, Susan Millar, Julie Miller, Alicia Morse, Rachel Mudge, Peter Murray, Kathy Perino, Julie Phelps, Irene Porcarello, Karen Saenz, Ronald Schertz, Mahmoud Shagroni, Mary Spangler, Melissa Spurlock, Cynthia Wilson and Wes Yuu.
Copyright Information
This work is licensed under the Creative Commons Attribution-Noncommercial-Share Alike 3.0 Unported license.
Community colleges serve a critical role in the education of our nation’s
workforce; they fulfill the democratic creed of accepting all students who arrive on their campuses, regardless of educational background, qualification or credential. Students who enroll in community college are initially assessed in the academic areas of mathematics and English Language Arts (and in some cases English Language proficiency), typically with a standardized placement test.i Many students who go through this placement process are identified as in need of developmental courses, non-credit bearing courses that are below college-level and do not count toward a degree, certificate or transfer. Higher numbers of students have developmental needs in math than English Language Arts. Estimates of the number of students that place into a developmental math course range from 60 to 90 percent of entering community college students, with significant portions of students referred to courses as many as four levels below a credit-bearing course. Failure rates for these students are staggering, with less than 10percent of those that place into the lowest level actually finishing the
developmental math sequence and continuing on to credit bearing math courses (Bailey, Jeong & Choo, 2008). Many spend long periods of time repeating courses or they simply leave college. Either way, they are not able to progress towards their education or career goals.
Community colleges have responded to these high failure rates with a variety of interventions aimed at improving the developmental math sequence (i.e. supplementary instruction, tutoring, learning communities, use of technology, etc.).In this document we set out to examine a domain of intervention activity—boot camps. Boot camps are aimed at decreasing the number of students that would initially place into the developmental sequence by providing students with short, intensive math experiences prior to
placement. We chose boot camps as a high priority to investigate because their short intensive design aimed at a critical juncture when many students get lost creates a potential to move high numbers of students along (or out) of the developmental
continuum in a replicable and cost effective manner. In our attempt to scan the field for innovative programs, we encountered many interventions with similar goals that went by names other than boot camps—such as summer bridge programs and accelerated math courses. Thus, we broadened our domain of interest to include a larger range of
interventions, all with short-term intensive math experiences aimed (at least in part) at shortening the time students spend in developmental math. We call this class of activity math intensive programs.
The goal of our scan is to explore the potential of these interventions as high-leverage activities; that is, if done correctly, the activity might have significant positive effects for large numbers of students. To understand the potential of math intensive programs to significantly improve the extraordinary high failure rates of students
interventions and their potential to scale. When interventions take form in the field, many variants with different specific services and theories of action may emerge, even while sharing a common label. Moreover, when these locally defined interventions emerge, the full details of their actual operation may be underspecified, leading interested others to replicate the form but not necessarily the substance of the innovation. Thus we seek to “get under the hood” of these boot camps and other intensive math interventions. In particular, we aim to scrutinize this domain in order to identify program specifics, synthesize evidence regarding their efficacy and costs and elicit deeper understanding of the cause-effect logic of their design.
We explored the intensive math interventions using a 90-day cycle process we borrowed from the Institute for Healthcare Improvement (IHI). The IHI 90-day cycle scans activity in the field as a “quick way to research innovative ideas and assess their potential for advancing quality improvement” (IHI documentation, 2009). We were interested in the utility of a similar 90-day cycle process for investigating promising educational innovations that have not yet been adequately explored in the educational literature, without tying up significant resources or encountering unnecessary delays. In particular, we sought to learn how to design a 90-day cycle methodology that captures intervention activity in a way that allows for an initial assessment of their potential to produce improvement at scale.
Overall, the programs we describe have employed a variety of innovative
strategies to improve student outcomes in developmental math. Although these intensive programs are targeted at students with developmental math needs, they often support more than just math. They help students learn about college support systems, teach study skills and serve as opportunities for students to build relationships with peers, mentors and faculty. One of the most intriguing elements common to many of these programs was their use as an onramp; carefully designing transitions between high school and college. The attention paid to the problem of transition across many programs and contexts suggests further exploration into how these transitions can be effectively executed.
As a group, the interventions are characterized more by variation than similarity. Even within interventions that went by the same name, we encountered differences both in how they were structured and in the elements of their design. In other words, our scan produced evidence that these programs are more a set of local solutions than a class of intervention that is currently well enough understood to be leveraged at scale. Assessing the potential of any one of these localized programs to scale to other contexts will require instrumentation of key elements, implementation in multiple contexts, and common measures of effectiveness.
The remainder of this report is organized into five sections. We begin in Section II by describing our methodology, which includes our definition of math intensive programs and our framework for how we approached our data collection efforts. In Section III we detail 14 math intensive programs and identify similarities and variations
Section IV, followed by a closer look at three colleges with multiple strategies for supporting developmental math students with intensive programs in Section V. Section VI concludes.
Section II: Methodology
The IHI 90-day cycle consists of three phases: (1) a scan of the field, (2) a focus on particular front-line theories to refine understandings about what works, and (3) dissemination of the findings to appropriate parties. At IHI, small teams work on each 90-day cycle, completing each phase in roughly 30 90-days. In our first adaptation of the 90-90-day cycle, we focused our more modest resources on the scan phase, attempting to produce a useful description of a wide array of intensive math programs using only one researcher and 90 discontinuous days.ii
We employed a snowball methodology to explore math intensive programs (Coleman, 1959; Spillane, 2000). We spoke to people familiar with community colleges and/or developmental math programs. Each individual pointed us to areas of interest: community colleges doing innovative math work, specific programs, individuals,
websites, conferences and articles. We read papers, combed conference proceedings and engaged in many phone and email conversations with various faculty members, math department heads, college administrators, community college researchers and other experts. We discovered a wide range of programs, of which we discuss a subset in this report. In the beginning of our study, we thought we were only focused on boot camp programs. We explain our initial assumptions and definitions about boot camp programs, how that definition expanded, the selection of the programs we detail in this report, and the framework that drove the descriptions of the math intensive programs.
Background and Definitions
Historically, boot camp programs go back to the 1960s and 1970s and support a wide range of learners (not just recent high school graduates). For example, the Cal Poly Pomona boot camp was organized for returning soldiers. Boot camps began by helping students prepare for college. They supported students in developing motivational goals, focused intensive time on a subject matter, and were based on a cohort model which involved students working together as a unit, building relationships and a shared experience that would help carry them through their college career. In the 1970s there was a large community building boot camps, some of whom were using the (then) military connotation with regard to building unit cohesion (Treisman, 2009).
Boot camp programs also link to the tradition of summer bridge programs and learning centers. Developmental summer bridge programs are four to six-week intensive programs for students who just completed high school. They include instruction in math,
reading and/or writing, a “college knowledge” component, and offer multiple types of academic support (Barnett & Pretlow, 2009).
We began our work with the assumption that boot camps were a clearly defined and distinctly understood concept in the field. We set out to identify boot camp programs that included the following elements:
1. Non-STEMiii focused students who do not score high enough on a placement test to place into college level math (or for the students who have not yet taken the placement test, but are at risk to not place into college level math).
2. Two to eight week time frame (less than a semester).
3. Intensive (could be all day for two weeks, several hours each day, etc.). 4. Extended time commitment.
5. At the transition between high school and college. In some cases, these programs happen during high school; in other cases, these programs support returning students who have been out of high school for years.
6. Located on campus.
Refining the Definition and Selecting Programs
As we spoke with more experts, we were pointed to a wide variety of programs that have similar goals. We quickly learned that many of these programs are about more than simply reviewing and/or teaching mathematics. We also discovered that boot camps are not widely enacted, nor is the term commonly used for the kind of program we were researching. In many cases, colleges had programs with similar goals that were referred to as summer bridges or intensives. Summer bridge programs tend to focus on a smaller number of students and recruit a more targeted population (typically high risk high school graduates), but they often have math intensive components that respond to the critical need for math support.
As the lines between boot camps, summer bridges and multi-course programs blurred, we broadened the domain of activity we were interested in to include any program that, through an intense, relatively short intervention, focused on mathematics and aimed to move students higher up the developmental math sequence than they originally placed, if not out of developmental math altogether. We revised the timeframe to include any programs one semester or less.
Many programs have other goals, as well as foci beyond math, but these two elements—math focused and intensive—serve as the core of our definition. The programs vary in structure, incentives and target audience. They all focus, to some degree, on math instruction, and many have integrated services (counseling, tutoring, etc.) that wrap around the math instruction. Other models, such as boot camps for middle school students, dual enrollment programs and creative methods to support and enhance developmental math courses, are not included in our analysis but nonetheless serve students with similar academic challenges and demographic backgrounds, and often address the same problems effectively. We have changed the name of our programs from
the developmental math sequence or to by-pass it entirely.
We selected programs for our sample that satisfied our definition and shared some promise of success. In many cases, evidence of “success” is empirically thin, which we discuss in more detail section IV. In some cases we removed certain programs from our sample before we broadened our definition. For this reason, and because of our
(intentionally) short time frame (we identified programs in a 30 day period in June-July, 2009 when many people are on vacation, etc.), we acknowledge that the programs we examine in our report represent a sample of a larger domain of activity.
Even though these programs often shared the same name (i.e. summer bridge) or were identified as having the same goals, their design features vary for a variety of reasons: the diversity in student population, differences in institutional resources, differences in levels of support, problem identification, improvement strategy, and local context. Some colleges offer a range of programs to address the diversity of student needs (e.g., Community College of Denver, El Paso Community College, and Pasadena City College) while other colleges focus programmatic resources on one strategy (e.g., Foothill College). The programs we consider fall into three categories:
1. Boot Camp Programs: Short (1-3) week summer program with a primary or exclusive focus on math skills.
2. Summer Bridge Programs: Longer (5-10) week summer program with intensive math and support for other skills.
3. Accelerated Programs: Intensive semester course that covers more than one developmental math course.
Framework for Program Investigation
This report details 14 programs from 10 colleges across seven states. These programs all share the six elements of our definition. We conducted 45-90 minute phone interviews with representatives from each programiv (faculty, department chairs, program
coordinators, etc.). We introduced our 90-day cycle focus, shared our definition of math intensive (boot camp at the time), and determined if they had a program that fit our scope.
The interview protocol used to explore these programs was driven by four main sources. First, we used our definition as a starting place to identify programs that included all our elements, outlining a beginning understanding of each program.
Second, in order to explore the potential of these interventions to be used beyond their current context, we designed probes intended to surface descriptions that would enable us to evaluate the program’s ability to scale. These probes included questions about design/theory of action, component work processes, local context, efficacy and costs. These areas were framed by the Carnegie Foundation’s core evaluative questions, which organized our thinking about the potential of an intervention to leverage significant improvement at scale (see Appendix B).
Third, we considered a range of elements for each program in order to understand the complexity of instructional support these programs offer. To make sense of the
complexities of developmental math, we use several existing frameworks for developmental education (both in general as well as math specific) and community college success. For more information on the frameworks, see Appendix C and D.
From these existing frameworks we established an initial list of program elements to investigate, including instructional leadership, curriculum and materials, appropriate assignment of students (in this case, recruitment), social support of achievement, community building (cohort), qualities of faculty and other support staff, instructional quality (which we term more broadly as pedagogy & instructional formats, and teaching), and student engagement.
Finally, we generated a list of five overarching program goals. We based our goal definition on our initial scan of community college programs for developmental math students. We used our program goals to probe for a deeper understanding of how each program enacted their work. All programs achieved one or several of these goals.
• Goal 1: Learning the math necessary to score well on the placement test and place into college level math courses (or at least place higher up the developmental math sequence).
• Goal 2: Developing math understanding needed for subsequent success. • Goal 3: Forming dispositions to succeed in college (study skills).
• Goal 4: Forming relationships to success in college (peers, faculty, tutors). • Goal 5: Informing students with specific knowledge that they need/access to
information to progress toward their goals (financial aid, college services, etc.). Taken together, these five sources framed the interview protocol used to conduct the scan of the intensive math interventions.
In the next section we describe the characteristics and variations of the intensive programs, identifying various key instructional elements of each program. We also discuss similarities, differences and key patterns across elements that are important to the design of math intensive programs.
Section III: Descriptions of Programs that Show Promise
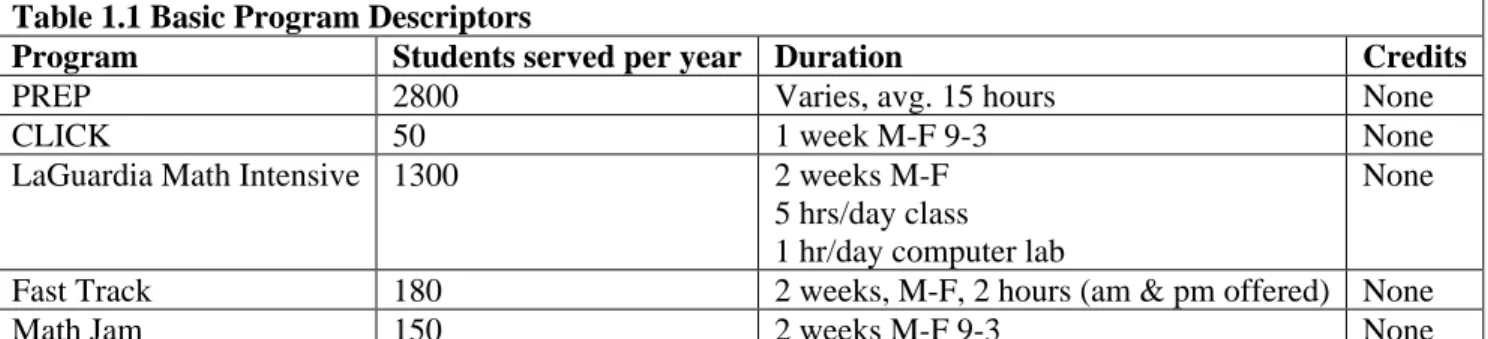
vIn this section we describe the programs in their own terms. We attempt to capture both the variation in what they are trying to accomplish and how they are going about it. To do this, we divided the intensive programs into three categories: Boot Camps, Summer Bridges and Accelerated Programs. We describe each program type using a wide range of characteristics. In Table 1 (of each category, so Tables 1.1, 2.1, and 3.1) we include the basic descriptors for each program: number of students, duration and frequency of classes. In Table 2 we include faculty resources, student incentives for participation, whether students get course credit, costs to the institution and to the student, and funding. In Table 3 we identify student population, program recruitment, and the test used to determine course placement in math at that college. In Table 4 we specify instructional
(social, psychological, etc.). These characteristics allow us to describe the common elements and variations in how each strand of program is designed. We then characterize what the programs were trying to accomplish with these elements using our five goals as a frame.
Program Specifics Boot Camp Programs
Boot Camp Examples (For specifics, see Tables 1.1-1.5) • PREP (El Paso Community College)
• CLICK (Houston Community College Southeast) • Math Intensive (LaGuardia Community College) • Fast Track (Montgomery Community College) • Math Jam (Pasadena City College)
Common Elements of Boot Camps. Boot camp programs are short, target a wide range of students, accommodate large numbers, and support improved math performance on the math placement test. The students who would most benefit from these courses are more than likely students who need to review math concepts rather than learn
developmental math content.
All boot camp programs occur in the summer for a period of one to three weeks.vi Students who attend boot camps have made a connection with the college prior to classes starting, which leaves out the segment of the population who arrive at campus just before classes begin (a relatively large part of the developmental education population). The majority of the programs (Math Jam, CLICK and LaGuardia Intensive) require students to be in school all day for one or several weeks, which creates an obstacle for students who work or who are not committed to giving up part of their summer to be in a non-credit bearing course.
The short duration of these programs affords a shorter opportunity to learn math, build relationships with peers and faculty, and utilize extended resources. One faculty member noted this difference as she compared her college’s shorter and longer programs, “[The shorter program is] a lot of fun, very energizing… but no bonding experience [like in the longer program]; just fun with math for two weeks… If we could design it so that you can stay with that faculty into the next class, that would work better.”
All of the programs offer incentives for the students to participate, ranging from material rewards (free iPods, free textbooks) to more intrinsic rewards (a chance to retake the test and place out of developmental math).
Variation within Boot Camps. The boot camp programs differ in how they recruit students for participation. CLICK recruits at the local high schools and serves high school students, while the other programs use less organized recruiting (word of mouth), and pull from a wider population of students (including older and returning students).
While some boot camp programs focus exclusively on teaching/reviewing math, some do more. Many programs support the students’ transition into college by giving new students a taste of college, helping them identify a career path, and connecting students with college support resources. In these cases, math faculty teach the courses and other staff (e.g., counselors) play a support role.
The instructional staff also varies in boot camp programs. In some cases, math faculty are solely responsible for teaching the program. In other cases, the colleges depend on tutors to be available to students, primarily in the computer lab or to support with homework.
The core math curriculum is presented in different ways across the programs studied. In two cases the math component is largely dependent on a computer program, while faculty are responsible for instruction in the other three programs. In two of the colleges, math faculty developed the curricular materials they use in the boot camp programs while the other programs use a textbook.
Table 1. Boot Camp Program Details Table 1.1 Basic Program Descriptors
Program Students served per year Duration Credits
PREP 2800 Varies, avg. 15 hours None
CLICK 50 1 week M-F 9-3 None
LaGuardia Math Intensive 1300 2 weeks M-F
5 hrs/day class 1 hr/day computer lab
None
Fast Track 180 2 weeks, M-F, 2 hours (am & pm offered) None
Math Jam 150 2 weeks M-F 9-3 None
*Continuing Education ($120 + book)
Table 1.2 Faculty Resources, Incentives, and Funding
Program Faculty (Resource commitments) Incentives Cost Cost to Student
Funding
PREP Full time manager, 7 specialists, 1 lab
specialist, peer tutors
Opportunity to retake placement test and place into a higher math course
None Started as a Title V
grant. Institution support
CLICK Dept. chair, math instructor, counselor,
recruiter
iPod and chance to win computer for completers
None Chancellor’s Innovation
Grant Cost approx $14,200
LaGuardia Math Intensive
10-20 faculty with 60 hours each (enough to cover 20-22 sections)
Free course, free software, free books.
$300,000 Book (free tuition)
Institution supported
Fast Track Five math faculty with part time
responsibility. 1/2 credit hour for each course; about 10-12 per year so it totals to about 1.5 full time position.
Complete two
developmental math courses in two weeks.
Tuition* Students pay $120 +
cost of book ($30.65-43); no financial aid.
Math Jam 5 instructors, 10 peer tutors, director of TLC,
counselor
Free program & textbook for fall
Fall support: Tutoring, counseling, conferencing
None Institution and grant
Table 1.3 Student Population, Recruitment, and Placement
Program Target Population Recruitment Placement
PREP All incoming new students Accuplacer
CLICK Recent HS graduates Recruits at local high schools. Has a
recruiter on staff.
Compass Test LaGuardia Math
Intensive
Recent HS graduates (“Generation 1.5”: some HS in their country, some in US, have huge math needs)
Compass Test
Fast Track Recent HS graduates and adult students returning to school after a
long absence
Accuplacer
Table 1.4: Instructional Formats and Curriculum
Program Content Taught Practices & Pedagogy Curriculum
PREP Instruction about test. Work
on individualized, computer based plan.
Case managementvii
Diagnostic evaluation in A+dvancer Assessments Computer tutorial exercises in Plato (on-line)
Plato
CLICK Math (My Math Test,
Pearson)
Study and Life Skills: What Employers Want Recent College Graduates to Know
Math component: Computer based program, individualized. Math teacher in lab for support.)
My Math Test LaGuardia Math Intensive Introduction to Algebra (MAT095) or Elementary Algebra (MAT096)
Six hours a week with instructor (5 hours each day in class + one hour each day in computer lab). The lab sheets are used by the instructors as teaching tool. 1-2 hours per week are used for on-line system for quizzes and tutorial. Also have homework on line and online departmental exams. Focus on problems solving; intensives are skills based.
EducoSoft software and textbook (College has
collaborated with company for >20 years; customize to college/student needs)
Fast Track Basic Fast Track:
Pre-Algebra + Elementary Algebra; Advanced Fast Track: Elementary & Intermediate Algebra
Traditional lecture in beginning of class with time to work on problems. Extra help available before/after class + math learning lab
Department designed curriculum
Math Jam 3 courses offered:
Pre-Algebra, Beginning Algebra, Intermediate Algebra.
Includes study skills, college orientation, counseling and tutoring
Constructivist
Math is Fun: Hands on, games, real world problems; projects, competitions.
Tutor and instructor taught. Guest speakers.
Department designed math curriculum.
Table 1.5 Social Support for Achievement Program Social Support for Achievement
PREP Case management to identify academic goals, degree plan, intervention plan, information on financial aid, counseling, daycare, etc.
CLICK Provides a head start on college. Explore career options, learn what employers want you to know, become better prepared for the
college placement exam, learn about financial aid and scholarships, interact with faculty and peer mentors, meet peers that can share the do's and don'ts of college.
LaGuardia Math Intensive
Walk-in tutoring support from the math learning center tutors.
Fast Track 2 hours of individual counseling. Accommodations made for placement into appropriate course following semester. Course runs
June, August, and January.
Math Jam Study skills. Where to find resources on campus. Where to get help, financial aid, counseling, tutors. Student signs summer
contract, and upon completion signs fall contract which includes supports (meet with counselor, faculty and tutors, use TLC lab). Develop network of support between teachers, mentors, and students.
Summer Bridge Programs
Examples of Summer Bridge Programs. (For specifics, see Tables 2.1-2.5) • College Connection (Community College of Denver)
• Project Dream (El Paso Community College)
• Math Boot Camp-3 modelsviii (Houston Community College Southwest) • Summer Bridge (Moraine Valley Community College)
• Summer Bridge (Pasadena City College)
Common Elements of Summer Bridge Programs. Summer bridge programs also happen in the summer, but they run for longer periods of time (between 5-10 weeks). They are all math intensive and they all focus support on transition to college and explicit instruction of study skills. Unlike the boot camp programs, these programs tend to recruit from a more targeted population—typically recent high school graduates (but in one case those with a GED) in high-risk populations—and students are typically identified and contacted while still in high school.
Due to the long and intensive program support, these programs tend to touch far fewer students than the boot camp programs. In some cases, these programs may not necessarily reach the target population: only a student who can afford not to work can attend summer school, and/or who is disciplined to give up his summer to attend courses that do not count toward a diploma. In addition, many of the high need developmental students do not find out about this program or do not sign up for college until the end of the summer, when the programs are well under way or over. Some colleges have solved this problem by testing students when they are still in high school. Building relationships with the local high schools is a pattern in some of these institutions and one
recommended in the research (Karp & Hughes, 2008).
All of the programs have faculty that extend beyond the math faculty. In the high school course (Houston), tutors support the instructional goals. In the other four
programs, a variety of people (e.g., program coordinators, counselors, mentors, case managers) support the program goals.
The longer period of time affords a cohort bonding experience. The four college transition programs (Denver, El Paso, Moraine and Pasadena) identify this as a critical component to the success of both the course and the future success of the students. The extended duration also allows new students to bond with faculty and become aware of the university resources (intentionally built into coursework at Denver, El Paso and
Pasadena).
These summer bridge programs offer a higher likelihood for students to learn math than boot camp programs. In addition, the four college transition programs focus on college transition skills, cohort building, and building relationships with faculty. As one faculty member from Pasadena points out, it “takes time to unlearn unproductive high school behavior. Six weeks doesn’t do it, one semester doesn’t do it. So it takes about a
year.” For this reason, the support services introduced in the summer bridge program at Pasadena continue throughout the students’ first year of college.
Variations within Summer Bridge Programs. Two of the programs offer an incentive, which are both currently grant-supported. The high school program is subsidized by the high school, and two other programs (Pasadena and El Paso) require the students to pay tuition, for which students get course credit.
The academic focus is different in summer bridge programs. Two of the programs have math as the only academic content, while the other three programs offer math, reading and writing coursework. Moraine and Houston offer different levels of math; the other three programs offer one math course. These programs include more faculty-designed curricular materials than the boot camp programs. Project Dream, College Connection and Pasadena SB all use textbooks infused with faculty developed math materials. Moraine Valley has a customized edition of a traditional textbook. Four of the programs use a computer program as part of their in-class work and/or homework practice.
There is a wide range of faculty and support staff in the summer bridge programs. Two of the programs depend heavily on tutors. The other programs are staffed by various people, depending in their model. In Denver, math and English faculty work with a part-time case manager to support the students. In El Paso and Pasadena, in addition to the math and/or ELA faculty, a counselor works with the students.
The support for achievement varies program to program. The four college prep programs support learning beyond mathematics to include coursework in study skills, life skills and college information/resource skills. On the other end of the support spectrum, the high school program primarily supports math learning with a study skills component.
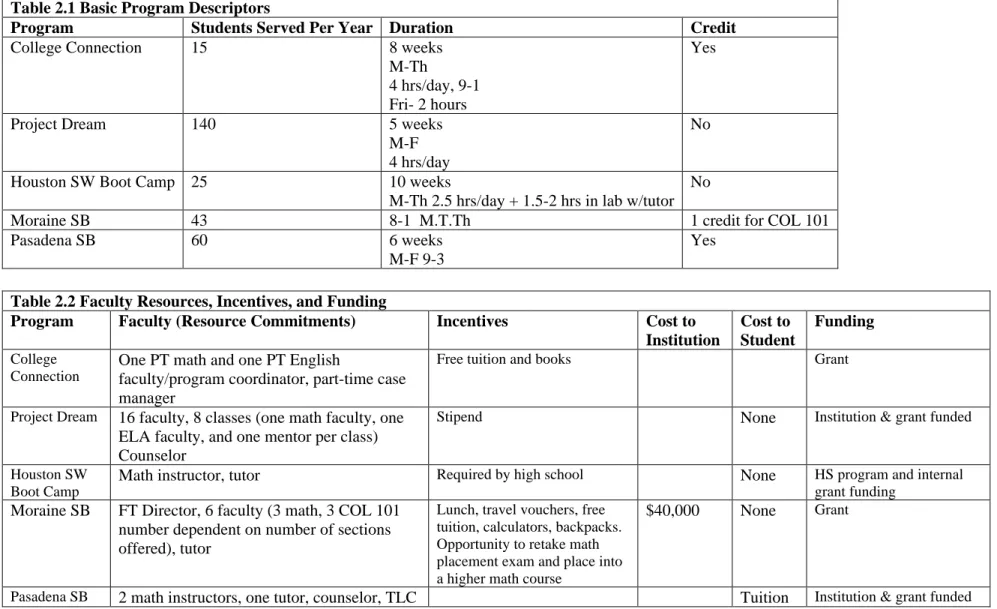
Table 2. Summer Bridge Program Details Table 2.1 Basic Program Descriptors
Program Students Served Per Year Duration Credit
College Connection 15 8 weeks
M-Th
4 hrs/day, 9-1 Fri- 2 hours
Yes
Project Dream 140 5 weeks
M-F 4 hrs/day
No
Houston SW Boot Camp 25 10 weeks
M-Th 2.5 hrs/day + 1.5-2 hrs in lab w/tutor No
Moraine SB 43 8-1 M.T.Th 1 credit for COL 101
Pasadena SB 60 6 weeks
M-F 9-3
Yes
Table 2.2 Faculty Resources, Incentives, and Funding
Program Faculty (Resource Commitments) Incentives Cost to Institution Cost to Student Funding College Connection
One PT math and one PT English
faculty/program coordinator, part-time case manager
Free tuition and books Grant
Project Dream 16 faculty, 8 classes (one math faculty, one ELA faculty, and one mentor per class) Counselor
Stipend None Institution & grant funded
Houston SW Boot Camp
Math instructor, tutor Required by high school None HS program and internal
grant funding
Moraine SB FT Director, 6 faculty (3 math, 3 COL 101
number dependent on number of sections offered), tutor
Lunch, travel vouchers, free tuition, calculators, backpacks. Opportunity to retake math placement exam and place into a higher math course
$40,000 None Grant
Table 2.3 Student Population, Recruitment, and Placement
Program Student Population Recruitment Placement
College Connection
Specialized program for GED and high school students who are planning to enroll in fall college classes and who place into multiple levels of developmental math, reading or English.
Accuplacer—mandatory testing and placement.
Project Dream Most students are Hispanic (reflects the
population)
Recruit HS graduates with at least one developmental need.
College gives Accuplacer to HS students.
Houston SW Boot Camp
11th grade HS students who did not pass
TAKS to move on to 12th grade
Recruit at the high schools. TAKS exam
Moraine SB Target students with ACT scores between
16-19.
Test HS students (Compass). Send home letters with trajectory information.
Compass Test
Pasadena SB Target incoming students who are most at
risk; Latino, mostly first generation, enter with a low Academic Performance IndexAPIsix.
Table 2.4 Instructional Formats and Curriculum
Program Content Practices & pedagogy Curriculum
College Connection
Math (2 hours) integrated
reading/English (2 hours), college experience course (one credit), technology; multi-level classroom
College developmental education faculty understand what knowledge and competencies students must master and how they will be measured; instructors are sensitive to the instructional and social characteristics of the students; professional development for faculty is a component of the program.
Follows developmental math curriculum, with MyMath lab computer program and instructor developed materials
Project Dream
Math (2 hrs), reading (1 hr), writing (1 hr).
Covers whole developmental series from basic skills to Algebra.
Hybrid approach: Computer work and small group work. Faculty developed math
materials (student and faculty handbook) based on McGraw Hill and ALEKS.
Houston SW Boot Camp
Math 306 (Pre-Algebra) and Math 308 (Algebra I)
Small group, faculty and tutor support. Work on My Math Lab after class with tutor. Discipline, hard work, holds them to college standards of behavior, attendance, work
completion, and work ethic.
Bettiger Addison Wesley Textbook and My Math Lab computer program
Moraine SB Math: Offer three levels: Basic
Math (Math 090), Beginning Algebra (Math 095), Intermediate Algebra (Math 098)
Study Skills College 101
Traditional, face-to-fact instruction. Department syllabi and test.
College Skills: Tailored for math; tutoring component. College 101 course (overview course to transition to college. Required of all new students. Assess study strategies, set goals, values, decision-making skills, appreciation for diversity. Complete education plan; work with advisor.)
Customized Pearson editions of textbooks. Some texts are changing this fall and spring.
Pasadena SB Math Content: Pre-Algebra
On Course (College and Life Skills)
Traditional lecture. Some materials developed by
faculty; real life based project in each chapter.
Math Excel: On-line program for homework.
Table 2.5 Social Supports for Achievement
Program Social Supports for Achievement
College Connection Emphasis on critical thinking skills. Study groups. Study skills. College atmosphere. Interventions to support
student affect: group activities/cohort approach; integration into college life. Logistic/systemic support: financial aid, admissions, and registration paperwork.
Project Dream Learn about college resources, develop college-going attitude and success strategies, receive support to enroll in
college in the fall, use Titon and Ashton scholarship to build cohort, sense of belonging. Faculty believe integration, acclimation, acceptance, and belonging goes a long way; sense of belonging is a key component of student
engagement. Bond with peer group. Meet other faculty, use tutoring center at least once, become familiar with campus and services available, counselor.
Houston SW Boot Camp School bus drops them off and picks them up.
Moraine SB Study skills and tutoring. Cohort approach. Build sense of community. Focus on transitioning to college through the
COL 101 course.
Pasadena SB Counselor. Ropes course at start: cohort building. Class tutor an hour before class starts to work on homework.
• Cool at School (Daytona State College) • FastStart (Community College of Denver) • Math My Way (Foothill College)
• Math Path (Pasadena City College)
As opposed to the summer programs aimed at students who want to finish or skip some developmental math credits before they enroll in the fall, these accelerated programs are math courses that exist during fall and spring term. They differ, however, from regular developmental education courses in that they provide students with the opportunity to complete more than one developmental course in a single term. For most of these colleges, these courses reflect a redefinition of developmental math instruction, and while they do not fit into our original definition of boot camp (a course that spanned less than a semester), the intensity of their design and the speed-up goal caused us to redefine our focus.
Common Elements of Accelerated Programs. As we have seen in some of the other programs, all of these accelerated programs do more than teach mathematics. In the case of Foothill and Daytona, students are required to sign up for a study skills course that runs in tandem with the developmental math course. These students not only have heavy support for math learning (they are required to achieve 87% or better in order to move to the next module), but they also are explicitly taught study skills. Math My Way is required for all developmental math students, regardless of placement, and they have the opportunity to move through all ten modules and test out of developmental math in one quarter (although very few actually do). In the other three programs, students are provided with additional supports in the form of tutoring labs. Fast Start also builds in case management, academic support, career exploration and financial aid counseling. All of these courses are very well supported by a range of college resources. Either the faculty work together on a daily basis (Math My Way and Math Path), or the
programs have extensive webs of support from other college staff (e.g., tutors, Academic Support Center, case manager, student services, etc.). Because these accelerated
programs happen during the regular term, staffing them is not difficult.
In all of the accelerated programs the teachers use a combination of traditional textbook materials and their own designed materials. Working together as a learning community, building a cohort, and active learning are other strategies used in these programs.
Variations of Accelerated Programs. One main difference between these programs is the instructional tools used in the coursework. In two cases computer-based software is used as part of classroom instruction. Some programs have study skills built into the design (required class to complement math course) while other courses have social supports for achievement built into the programs in other ways (computer lab with tutor support; extended services students can access during and after class).
Pasadena and Denver’s programs serve a very targeted population: those students interested in spending extra time on math to finish more quickly. The intensity of these programs can translate into little, if any, other coursework undertaken at the same time. On the other hand, to finish two courses in a single term cuts down on the lapsed time students have to spend getting into college level coursework, although technically they may spend as many hours in math courses. Fast Start is an exception to this; full-time students typically take an additional six credits.
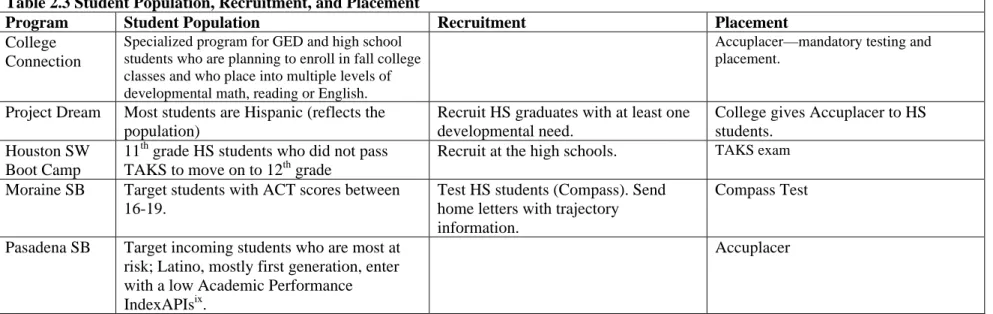
Table 3. Accelerated Program Details Table 3.1 Basic Program Descriptors
Program Numbers Duration Credit
Cool at School 13,000 8 weeks,
4 days/week, 1.5 hrs/day
Yes
FastStart 150 per semester 3 hours,
2 days a week for semester
Yes
Math My Way 150-165 Quarter
5 days/week, 2 hours per day
Yes^
Math Path 30-35 students per class; 4-6 sections per semester 16 wk semester
M-F: 2 hour class; .5-1 hr support class MTThF
Yes ^Developmental credits do not count toward graduation, but do count toward financial aid.
Table 3.2 Faculty Resources, Incentives, and Funding
Program Staff Incentives Cost to
Institution Cost to Student Funding Cool at School
1 faculty per course, class size of 30
Peer tutors, tutors who are graduate students in engineering from a neighboring school. Faculty serve as tutors in Academic Support Center.
Complete 2 math courses in 1 sem
Tuition Students
pay tuition
FastStart 1 faculty per course; .4 release position to coordinate program; case
manager; collaboration with math and English dept chairs, deans,
divisions of student services (testing center, recruitment, career services).
Complete 2 math courses in 1 sem Tuition Students pay tuition. Math My Way
Five classrooms, 5 math faculty. Study skills support (adaptive learning division faculty)
Required course Tuition Students
pay tuition.
Math Path One full time math faculty (equivalent) for Algebra; 2/3 of a full time load
for other courses (unique teachers; meet together daily to collaborate.)
Complete 2 math courses in 1 sem
Tuition Students
Table 3.3 Student Population, Recruitment, and Placement
Program Student Population Recruitment Placement
Cool at School
Developmental education students Students who place in take
these courses.
Accuplacer
FastStart Students who can handle intensive requirements of acceleration with regard to
work and family obligations.
Advisors and testing center personnel refer, word of mouth, posters. Accuplacer, mandatory testing and placement Math My Way
Required for all students who place into developmental math courses. None. Accuplacer
Math Path Counseled for entry; high stakes in that only take this course for a semester so
if student doesn’t pass, they get no credits for the entire semester. Only take this and a PE credit. Need to work 20 hours week max and have the emotional maturity to persist.
Table 3.4 Instructional Formats and Curriculum
Program Content Practices & pedagogy Curriculum
Cool at School Basic Math Pre-Algebra Beginning Algebra Intermediate Algebra College Algebra
20 min lecture: Minimize passive part of learning. Mandatory assignments in class: group work. Textbook has day-by-day format with daily worksheets that are due at the end of class or the beginning of the next class.
Textbook custom made for their course by McGraw Hill.
Numerics (computer program for Basic
Math/Prealgebra). Mandatory lab for Prealgebra (Numerics) or pencil-paper labs for Beginning Algebra.
FastStart Dev math 1 and 2
Dev math 2 and 3 Dev math 3 & college Algebra
Work as a learning community where students are encouraged to ask questions and think critically. Develop habits, attitudes and skills of successful learners. Interactive teaching.
Accelerated courses use teacher created materials and a mastery approach (supported by Pearson’s My Math Lab). Students co-enroll in first year student experience course.
Math My Way
Textbook, review worksheets, ALEKS software
Self-paced with high amounts of structure. Mini-lectures, small group work, students working independently and reorganized based on improvement. Mastery learning.
Textbook custom made for their course by McGraw Hill.
ALEKS
Study skills curriculum designed by department
Math Path Pre Algebra/Elementary
Algebra
Elementary + Intermediate Algebra
Trig/Pre Calculus First two semesters of single variable calculus Multivariable
calculus/linear algebra
Course opening: respond to questions, homework assessment, explain and demonstrate new material, group work
Students help each other. Depth over breath. Support class: Study skills that respond to student needs
Addison Wesley Pearson textbook: Introductory and Intermediate Algebra by Lial Hornsby McGuinnis
Paul D. Nolting Math Study Skills Workbook Other teacher created materials
Table 3.5 Social Support for Achievement Program Social Support for Achievement
Cool at School Academic Support Center with faculty and peer tutors.
FastStart Case management, academic support, career exploration, tutoring in college learning lab, financial aid counseling.
Math My Way Study skills twice a week.
In addition to employing different elements the boot camp, summer bridge and acceleration programs also varied in their intended goals. After a quick initial scan of programs at various colleges, we identified a set of five program goals. We then used these goals to identify patterns in each program we studied. Some programs address one of these goals, while most attend to several.
• Goal 1: Learning the math necessary to score well on the placement test and place into college level math courses (or at least place higher up the developmental math chain).
• Goal 2: Developing math understanding needed for subsequent success. • Goal 3: Forming dispositions to succeed in college (study skills).
• Goal 4: Forming relationships to success in college (peers, faculty, tutors). • Goal 5: Informing students with specific knowledge they need/access to
information to progress toward their goals (financial aid, college services, etc.). We identified which goals each program had, and subsequently followed up with program personnel to verify our goal identification.x
Table 4. Program Goals.
Math Intensive Program Goal
1 Goal 2 Goal 3 Goal 4 Goal 5 Boot Camp Programs
PREP: El Paso Community College X X X
CLICK: Houston Community College Southeast X X
First Year Institute: LaGuardia Community College X X
Fast Track: Montgomery College X X
Math Jam: Pasadena City College X X X X
Summer Bridge Programs
College Connection: Community College of Denver X X X X X
Project Dream: El Paso Community College X X X X X
Math Boot Camp for High School Students:
Houston Community College Southwest X X
Summer Bridge: Moraine Valley Community College X X X X
Summer Bridge: Pasadena City College X X X X
Accelerated Programs
Cool at School: Daytona State College X X
FastStart: Community College of Denver X X X X X
Math My Way: Foothill College X X X X
In general, boot camps focused more on reviewing math (Goal 1) than on an in-depth study of mathematics (Goal 2). The short duration of the boot camp programs offers less of a chance to build relationships (Goal 4, only a goal in one program), but in several cases boot camp programs offer students support in learning specific knowledge to progress toward their goals (Goal 5). Two boot camp programs begin to form
dispositions in students to succeed in college (Goal 3), but the short duration hinders a deep investment in this goal while this is a main goal in all five of the summer bridge programs. Even though these boot camps have similarities that range from when they happen to students they serve, only two of the boot camps share exactly the same goals— LaGuardia and FastTrack—and these programs are the only ones of our scan that only focus on mathematics review and learning.
Like boot camp programs, summer bridge programs all focus on a review of math (Goal 1). Because they tend to serve as a transition program for high school graduates, they offer other supports that include building relationships with peers and faculty (Goal 4) and learning about other college resources available to them (Goal 5).
The accelerated programs tend to do less review of mathematics (Goal 1) and focus more on teaching new mathematical concepts to students (Goal 2). In addition, the longer time students spend together allows for stronger relationship building than the other two program types (Goal 4), and also allows them to learn about the other college resources to help them succeed (Goal 5). Learning “college” behavior is also a goal in two of the three programs.
As with boot camps, the summer bridge and accelerated programs share some similar goals, but never exactly the same goals. While structurally the program types have many similarities, and there are many similarities across program types, goals of the programs are not always the same. Within the same program type we see different goals, and even a different emphasis on particular goals. Three of the programs have all five goals (one accelerated and two summer bridges), while two accelerated programs have Goals 2-5. With these few exceptions, and the two math only boot camps, none of the programs have exactly the same goals. The structures and strategies used to achieve these goals varied as well, as we reported in the beginning of this section.
Section IV. Efficacy and Costs of these Programs: What Do We Know?
Costs, Institutional Support and FundingBecause boot camps are not credit bearing, and usually students do not pay tuition, boot camp programs cost the university money. For that reason, most of these programs began as grant funded programs and still rely on some grant funding to keep them going. In addition, three of the programs offer material incentives, which can be costly. Summer bridge programs are even more resource intensive for colleges. They require more resources in that they last longer and typically have more faculty/staff
pay with financial aid dollars. In all of the accelerated programs, students pay tuition, and get credit. This allows students to use financial aid to pay for courses.
College personnel identified financial support as critical to the effectiveness and longevity of a math intensive program. Funding patterns varied in the programs we studied. Some community colleges directly support the work, allocating funds for
developmental math programs. In these cases, math intensives are in the math department or part of a developmental education support program. In other cases, programs began with grant funding.
Five programs (Denver, El Paso, Houston, Moraine Valley and Pasadena) began as grant projects, where faculty built the programs, designed curriculum, bought
incentives for students, and/or built infrastructure to support the program. Two of these programs are still externally funded. A couple of them have managed to build
institutional support to continue the programs. In the case of the college that was able to transfer a grant-funded math intensive to college funding, a couple of supportive
administrators and showing positive results helped garner support. In three cases, the college supports developmental education programs by allocating a certain amount of monies to be spent as desired by each department. In the Houston Community College system this money came in the form of a Chancellor’s Grant, and two campuses designed innovative developmental math programs from those monies.xi At LaGuardia, the college gives the math department a certain amount of money that they decide how to spend; their math intensive is an aspect of that spending. In several instances, colleges have built the programs to give students credit (although not credit toward a degree, but in most cases credit that will count for financial aid) and therefore charge tuition.
Two recent programs utilize a return-on-investment model for colleges to estimate the cost of running developmental education programs based on incremental costs and revenue from increased retention. With data from six states, Rob Johnson found costs for developmental programs were offset by the income generated from successful students who went on to progress through the system (Johnson, 2009. FastStart@CCD calculates that the breakeven point for program costs is reached in the semester after intervention, with additional revenue accruing with additional semesters, based on higher rates of retention (Corash & Baker, 2009).
More data needs to be collected around costs of each program. We have some information (overall cost information for two programs; incentives; materials), but ideally we would have the institutions’ share cost estimates for each program and/or complete Johnstone’s or Corash and Baker’s template for calculating ROI. [See Tables 1.2, 2.2, and 3.2 for available cost data on select programs.] In addition, we have calculated a very crude student/faculty ratio for each program to gain a sense of “cost” with regard to human resources (see Table 5). In all cases this is a rough measure, and does not take into
account all of the other necessary resources to run each program. However, it offers a sense of scale across the programs.
Table 5. Approximated student/faculty ratio.xii
Program # students per one full time
faculty position PREP 175 CLICK 71.4 LaGuardia 86.7 FastTrack 120 Math Jam 88.2 College Connection 25 Project Dream 29.2 Houston 83.3 Pasadena SB 85.7 Cool at School 100 FastStart 93.8 Math My Way 137.5 Math Path 52.2
Using this calculation, the boot camp programs and the accelerated programs tend to use less faculty resources than the summer bridge programs. Future analysis would examine the benefits of summer bridge relative to such differences.
!
What Do We Know About the Efficacy of the Programs?!
While there is some evidence of the success of each of the programs we discuss in this report, that evidence is at times sparse and anecdotal. Each college collects some information about efficacy, dependent on particular goals and institutional capacity. Ideally, a successful intervention program would increase student retention in math courses, course success rates, persistence to a degree, progression to college level work, and overall units attempted and earned. Most colleges do not collect these data, and in many cases data systems are not yet built to easily track these numbers. In fact,
examining transcript data by hand is still a common practice in some colleges seeking to determine the success of their programs.
We now outline the types of data that the colleges track for the programs we examined. In some cases the data are reported for students from the intensive program; in other cases the data are comparisons between program students and a group of non-program (but similar) students. In all cases these data were what we were given by the colleges in our short data collection window (about 45 days in the summer of 2009).
data from external reviews, indicating that in many cases these data are not systematically collected and analyzed as a matter of course in the colleges, but are when additional funding, resources, or external scrutiny come into play.
We set out to organize the available data around our five goals. Extant outcomes primarily address Goals 1 and 2 (the math focused goals). Only one program assessed Goal 3 (forming college dispositions). Collecting and analyzing data around Goals 3, 4 (forming relationships), and 5 (specific “college” knowledge) would be a meaningful next step in terms of understanding overall success of math intensive programs. Many institutions also reported course completion rates and overall persistence and
performance in community college as other measures of efficacy. While it is possible that aspects of the programs had an impact on persistence rates, grades, graduation rates, etc., the data we have is not specific enough to point in any such direction. We add specific data points in Appendix E and summarize below.
Data To Support Goal 1
Learning the math necessary to score well on the placement test and place into college level math courses (or at least place higher up the developmental math chain)
The data colleges reported for Goal 1 were percentages of students who
completed an intensive program and increased at least one developmental math level. xiii None of the colleges reported data with regard to how these numbers stack up to a comparison group. In the six programs who reported data for students, between 38-67% of students completed the program and increased at least one level.
Data to Support Goal 2
Developing math understanding needed for subsequent success
Institutions reported data on college level math course completion, percentages of students who passed the next course (with comparison group numbers), and grades in the next course. The most impressive report was Foothill’s, who compared program
completers to non-program participants and found a 30% increase in success rate. Data to Support Goal 3
Forming dispositions to succeed in college (study skills)
Almost no one provided evidence of this goal, but Daytona State reported on greatly improved attendance, which serves an indicator of dispositions to succeed in college.
Beyond improved performance, getting students to register and continue to take math classes is still a common challenge. In one study, three to four students out of ten who are referred to remediation actually complete the entire sequence to which they are referred, and more students exit their sequence because they did not enroll rather than because they failed a course (Bailey, Jeong, Cho, 2008, Appendix E). For this reason, we identify data
that hints at how students who complete intensive programs faired in subsequent courses, how they perform in other courses, and if they to persist to a degree.
Data on Math Course Completion
Some colleges collect data on the percent of students who pass the developmental math courses. In most cases they collect percentages of students but do not provide comparison groups. Some colleges reported as high as 89 percent passage rates.
However, in many cases there is no comparative data to show how program completion compares with similar populations that did not complete the program. Three colleges reported comparison groups, and found the programs to have a pass rate between 10-20 percent higher.
Data on Performance and Persistence
Colleges collect a range of data that shows evidence of college performance, in general, and persistence to a degree. Performance data include GPA and success and retention in college courses. These sites all had comparison group data included. Denver’s FastStart students had higher GPAs than comparison groups in their first semester after program completion. Persistence data include number of students who go on to enroll in college after program completion, success in basic skills sequences,
persistence to a degree percentages, graduation rates, and college credits earned. Many of these sites include comparison groups. Most striking are the high numbers in El Paso (87 percent) and Denver (78 percent) who go on to enroll in college after program
completion. One challenge colleges face in collecting graduation data is the difficulty in tracking students who leave the college. Graduation rates may be higher than reported, but most colleges do not collect graduation data on students who transfer to other colleges and universities.
Other Measures
Some colleges measured other important data that doesn’t fit cleanly into one of our categories above but is important to mention. Pasadena shared data on behavior measures from students in their Math Jam program. Almost all students reported they feel better about math and have less anxiety after program completion. At several other colleges, faculty reported student surveys; these anecdotal results indicate positive responses to the programs, even in cases where students did not pass the course but still enjoyed and recommended the experience. In addition, Daytona State reported that program completers finished their college math sequence in a shorter duration than a comparison group.
Overall, the evidence we collected came in two main forms: descriptive data with no comparison group or descriptive data with plausible comparison group (either baseline or a different cohort of students). In Table 6 we give an overview of the levels of
evidence we were able to gather in our 90-day cycle based on the reported goals each program had and showed evidence for (Goals 1-3), math course completion, and evidence
could be because the colleges do not collect the data or because they did not have it readily available to share in the timeframe in which we conducted our review.
Table 6. Levels of Evidencexiv
Math Intensive Program Goal 1: Learn math to place higher Goal 2: Learn math for subsequent success Goal 3: Dispositions to succeed in college Math Course Completion Performance and Persistence Boot Camp Programs
PREP: El Paso Community College 1 *
CLICK: Houston Community College SE * 1
First Year Institute: LaGuardia Community College 1 * 1
Fast Track: Montgomery College 1 2 (+)
Math Jam: Pasadena City College * * 2 (+) 2 (+)
Summer Bridge Programs
College Connection: Community College of Denver
1 * * 1 1
Project Dream: El Paso Community College 1 * * 1 1
Math Boot Camp for High School Students: Houston Community College Southwest
* * 1
Summer Bridge: Moraine Valley Community College
* * 2 (+)
Summer Bridge: Pasadena City College * * 2 (+) 2 (+)
Accelerated Programs
Cool at School: Daytona State College * 1 1
FastStart: Community College of Denver * 2 (+) * 2 (+) 2 (+)
Math My Way: Foothill College 2 (+) *
Math Path: Pasadena City College * * 2 (+) 2 (+)
The levels of evidence are coded as follows. 1= reported a measure of the goal for students involved in the programs 2= reported data that compared the performance of students in the program with a plausible comparison group. For 2’s the + or – in parentheses indicates whether students in the intensive program had higher or lower performance relative to the comparison group. * = identified the outcome as a goal of their program but had no data readily available to report.
in developmental math courses. According to Achieving the Dream dataxv 59 percent of students were referred to developmental math: 24 percent to one level below entry-level college, 16 percent to two levels below, and 19 percent to three or more levels below. (See Appendix G for a graph of how Achieving the Dream students fall into
developmental math courses by race/ethnicity.) For this reason, colleges must support the wide range of student needs presented in this diverse student population. Some are right out of high school; others have been out of school for many years. Most community college students also work, and many have family and other obligations. Many speak English as a second language. Community colleges face the challenge of serving non-traditional populations, the principle being that they accept all students. Thus, one challenge of data collection becomes using data to understand what programs are working for which students. In addition, better data needs to be collected in order to understand how to place students. More research needs to be done to identify exactly what population is being served best by different elements of the boot camp programs. In addition, a refined way to identify student needs could improve placement. As the debate continues over appropriate placement and cut scores (Collins, 2008), developing better placement mechanisms may be useful. One teacher remarked that a mechanism to figure out which students fit best into each type of program would be useful, particularly in situations like enrolling students in on-line, self-paced courses versus more traditional lecture sections.
In the next section, we look at how one community college designed a program for all incoming students that identifies student needs, via one-on-one case management, and develops customized support for proper course placement. Additionally, the college designed a second program to serve needs of a specific population.
Section V: A Closer Look at One College with Multiple Strategies
In addition to understanding the specifics of what these programs were doing, we also attempted to understand why these programs employed the structures they did and how they came to be. Undergirding the various program elements are perceived relationships between program elements and the students, resources, problems and constraints of the context where they are implemented. While our protocol for this scan did not surface all of these perceived relationships, we did get a sense of the logics behind some of the design elements in colleges where multiple programs were
implemented, each aimed at a different population of students. We offer as an example below an account of one college that solved the diversity of student needs problem by designing an array of programs to support developmental math students.
The Case of El Paso Community College
The town of El Paso, Texas, is 80 percent Hispanic with a median household income $16,000 below the median household income in the United States. Of people 25 years old and older, 32 percent do not have a high school diploma, 23 percent are high school graduates and 18 percent have an associate’s or bachelor’s degree. El Paso Community College’s (EPCC) students are 85 percent Hispanic and 59 percent female. Most students are first generation college students and most speak Spanish as their first language. In the fall of 2006, 21 percent of the students (both full time and part time) were 21 years old or younger. Enrollment rates have risen in the last five years (8.6 percent) while graduation rates have also increased dramatically (69 percent since 2003).
In 2007 only 5percent of first-time college students at EPCC placed into college level math.xvi The remainder placed into developmental math and cluster around one or three levels below college level math (see Table 7).
Table 7. Three-Year Comparison of Math Placement by Level, post PREP
Note: The EPCC developmental education sequence in mathematics is 0300, 0301, 0303, and 0305. Students who place above 0305 are determined “college ready” and can take a college level math course for college credit.
The number of students in the lowest two levels has decreased between 2005-2007, while the number placing two levels below college math has stayed the same. The director of student success believes this decline is attributable, at least in part, to specific services EPCC has put in place to better serve their students. Eight years ago El Paso Community College identified the need to have a variety of services available to their students. They
68 3% 578 28% 255 12% 520 25% 639 31% 72 4% 578 30% 209 11% 421 22% 640 33% 100 5% 738 41% 234 13% 344 19% 406 22% 0% 10% 20% 30% 40% 50%
College Ready MATH0305 MATH0303 MATH0301 MATH0300