1
Managing Extreme Volatility for
Long-run Growth
1Doug Addison
1.1
Introduction
This chapter identifies macroeconomic policy options for long-run growth and
poverty reduction that are compatible with the challenging realities facing Ni-gerian leaders and the high degree of macroeconomic volatility in particular. As such, it includes lessons drawn from recent research on growth, investment and volatility. Some of the policy proposals included here are standard, others are tailored to Nigerian circumstances. In this context, in the concluding section of the chapter, recent policy changes adopted in 2003, 2004 and 2005 are evaluated for their impact.
The Nigerian economy is not merely volatile, it is one of the most volatile economies in the world. There is evidence that this volatility is adversely affect-ing the real growth rate of Nigeria’s gross domestic product (GDP) by inhibitaffect-ing investment and reducing the productivity of investment, both public and pri-vate. Economic theory and empirical evidence suggest that sustained high fu-ture growth and poverty reduction are unlikely without a significant reduction in volatility. Oil price fluctuations drive only part of Nigeria’s volatility; policy choices have also contributed to the problem. Yet policy choices are available that can help accelerate growth and thus help reduce the percentage of people living in poverty, despite the severity of Nigeria’s problems.
Two caveats are in order: first, although this chapter focuses mainly on the is-sues and policy options associated with volatility, it is certainly the case that other policy choices in other realms matter just as much. The quality of governance, infrastructure and public services are among these. Put another way, this chapter argues that employing a strategy to reduce volatility will help reduce the drag on the Nigerian economy to a significant degree but only if other sustaining ele-ments are also in place. Many of the relevant policy choices are discussed in other chapters of this book. Second, the analysis is confined to the nation as a whole. If data quality continue to improve, it should be possible in the near future to go deeper, looking at state-level or industrial-level issues.
Section 1.2 describes the breadth and depth of volatility in the economy. Sec-tion 1.3 describes the impact this volatility has had on investment and growth.
Section 1.4 explores the sources of volatility and how it was transmitted through the economy up until 2000–01. In so doing, the justification for several changes in macroeconomic policy begins to emerge. Section 1.5 ties these clues together into a coherent strategy and offers some thoughts about the feasibility of im-plementation. Some elements of this strategy have already been implemented in 2003, 2004 and 2005. Section 1.6 therefore provides a brief assessment of the short-run impact of what has been achieved so far and proposes next steps.
1.2
Breadth and depth of volatility
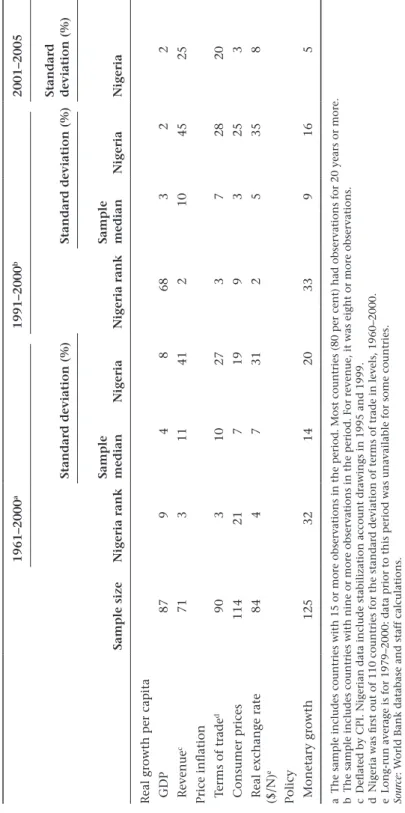
Table 1 below shows how Nigeria compares to other nations in the volatility of several key economic indicators. Volatility is defined here as the standard
devia-tion of growth rates in real variables, prices and monetary growth.2 The number
of countries sampled is quite large and is limited only by data availability.
Examination of Table 1 leads to a striking conclusion. Nigeria ranked among
the top ten most volatile countries for the period 1961–2000 for all indicators except monetary growth and consumer price inflation. Moreover, Nigeria was in the top five countries for the volatility of real government revenues per capita, terms-of-trade (TOT) volatility and real exchange rate (RER) volatility. When the time period is shortened to 1991–2000, Nigeria remains in the top ten most vola-tile countries for all measures except real GDP growth and monetary growth. In addition, Nigeria’s consumer price volatility, which was ranked twenty-first out of 114 for the longer period, was ranked ninth out of 114 for the shorter period 1991–2000.
More recently, the degree of volatility in the TOT for the period 2000–2005 remains almost three times larger than the sample mean for 1991–2000 and the volatility for revenues over 2000–2005 is two and a half times as volatile as the
1991–2000 sample mean. (See column for 2001–2005 in Table 1.) This suggests
that there has not been any abatement in the nature of the problem in recent years.
1.3
Impact of volatility on growth and investment
Nigerian policy-makers seeking economic growth have faced strong challenges over the course of Nigerian history. Among these have been deep losses from a civil war (1967–70), drought, disease and pests, and extremely volatile TOT due to oil price shocks. The war appears to have caused the deepest losses, both in terms of lives lost and in terms of economic losses. Yet the economy rebounded quickly when the war ended. By contrast, there is strong evidence that macr-oeconomic volatility may have substantially penalized growth and the quality of
public spending on an ongoing basis.3
Recent empirical and theoretical research has established that macroeconomic volatility can have an adverse impact on growth through at least two channels.
Table 1 Measures of macroeconomic volatility , 1960–2005 Sample size 1961–2000 a 1991–2000 b 2001–2005 Nigeria rank Standard deviation (%) Nigeria rank Standard deviation (%) Standard deviation (%) Sample median Nigeria Sample median Nigeria Nigeria Real growth per capita GDP 87 9 4 8 68 3 2 2 Revenue c 71 3 11 41 2 10 45 25 Price inflation T erms of trade d 90 3 10 27 3 7 28 20 Consumer prices 114 21 7 19 9 3 25 3 Real exchange rate ($/N) e 84 4 7 31 2 5 35 8 Policy Monetar y growth 125 32 14 20 33 9 16 5 a The sample includes countries with 15 or more obser vations in the period. Most countries (80 per cent) had obser vations for 20 years or more. b The sample includes countries with nine or more obser vations in the period. For revenue, it was eight or more obser vations. c Deflated by CPI. Nigerian data include stabilization account drawings in 199 5 and 1999. d Nigeria was first out of 110 countries for the standard deviation of terms of t rade in levels, 1960–2000. e Long-run average is for 1979–2000: data prior to this period was unavailable fo r some countries. Sour ce : W orld Bank database and staff calculations.
Volatility can affect growth by inducing less investment or by reducing productiv-ity – for example, by making installed capital less efficient.
Easterly et al. (1993) find that country characteristics alone are not sufficient
to explain cross-country growth patterns; external shocks are an important part of the story. Similarly, Bleaney and Greenaway (2001) find that real growth is negatively affected by TOT volatility. Hnatkovska and Loayza (2003) find that macroeconomic volatility and long-run economic growth are negatively related with causality flowing from volatility to reduced growth. They find this nega-tive link is exacerbated in countries that are poor, institutionally underdeveloped, undergoing intermediate stages of financial development, or unable to conduct counter-cyclical fiscal policies.
Empirical research has established that private sector investment can be de-pressed by extreme levels of risk and uncertainty. Bleaney and Greenaway (2001), for example, conclude that RER uncertainty depresses investment. Servén (2002) finds that the private investment rate is a function of RER uncertainty. He finds that the impact of RER uncertainty is more potent at high levels, possibly imply-ing a threshold effect, and that the direction of impact depends upon the degree of openness to trade and the strength of the financial system. Private investment is reduced by RER uncertainty in nations with low trade openness and/or weak fi-nancial systems. Conversely, RER uncertainty appears to encourage private invest-ment in nations with a high degree of openness and strong financial systems.
One explanation for the ability of a strong financial system to reduce the nega-tive impact of volatility is provided by Acemoglu and Zilibotti (1997). They pro-pose that there is a virtuous circle whereby risk is reduced by wealth and portfolio diversification while the investment needed for diversification is encouraged by
falling risk and rising wealth. In a related paper, Denizer et al. (2002) find
empiri-cal support for the positive effect that financial systems have in reducing macr-oeconomic volatility.
Nigerian firm managers have complained about inadequate access to finance more often than any other problem except uncertainty and poor infrastructure
(Marchat et al., 2001). Lack of credit forces enterprises to rely on internally
gener-ated funds both for working capital and for investment. This hampers firms’ abil-ity to manage their working capital, making it difficult for them to increase sales and operate at full capacity. The shortage of finance also limits investments to improve technology, to lower costs and to expand output. The high cost and lim-ited availability of credit is thus one of several factors that raise the cost of doing business and lower competitiveness in Nigeria. Other important factors include high energy and infrastructure costs.
In Nigeria’s case, the available evidence suggests that growth was reduced through both investment and productivity. Nigeria’s private sector invested an average of 7 per cent of GDP per annum between 1980 and 1994, well below the
average of 20 per cent invested by the world’s fastest growing economies.4
Cal-culations in World Bank (2003) suggest this reduced growth by an average of of 0.6 per cent per annum. Productivity losses were much larger, estimated at 2.8 per cent per annum, for a total of 3.4 per cent per annum. Analysis of the data also
Managing Extreme Volatility for Long-run Growth shows that government investment is more productive when the rate of
govern-ment investgovern-ment is stable – and that general productivity growth is adversely
affected by TOT volatility. Similar conclusions can be drawn for the projects that make up government investment. In particular, there is empirical evidence at the microeconomic level that volatility has negatively affected the performance of
World Bank projects in Nigeria.5
1.4
Sources of economic volatility
In Section 1.3, it was established that macroeconomic volatility has had a high cost for Nigeria. We now explore this volatility in depth. Sections 1.4.1 to 1.4.3 examine the causes and consequences of volatility in the TOT, fiscal outcomes, inflation and the RER. This analysis makes it clear that, while Nigeria is subject to quite large external shocks, policy choices have added to the level of volatility of the economy. This is illustrated in Section 1.4.4. By the same logic, alternative policy choices could help reduce the level of volatility and thus help stimulate growth and more productive investments.
1.4.1 Terms-of-trade shocks
The TOT index is defined as the index of export prices divided by an index of im-port prices. Nigeria was ranked first out of 110 countries for the standard deviation of TOT in levels, 1960–2000. If one looks at the volatility of the annual change in the TOT index, then Nigeria is ranked third out of a sample of 90 countries for the period 1961–2000. The standard deviation in the annual change in Nigeria’s TOT index over that period was 27 per cent, compared to the sample median of only 10 per cent. Nigeria remains ranked in third place even when one looks at
a shorter, more recent period, such as 1991–2000. (See Table 1 above.) Other
na-tions with a strong export concentration in oil display similarly high standard deviations in TOT growth rates: 23 per cent for Iran, 20 per cent for Venezuela and 20 per cent for Trinidad and Tobago.
The costs of TOT volatility
TOT volatility has negative affects at the macroeconomic level, on productivity growth and the rate of private sector investment, and at the microeconomic level on the performance of investment projects. The uncertainty created by volatile TOT growth makes it difficult for Nigerian firm managers and project managers to decide how much to produce and what production techniques to use. For exam-ple, machines installed for carpet making that are dependent upon imported arti-ficial fibres can be very productive when the TOT favour imports but very hard to adapt to local inputs (and hence unproductive) when the TOT are less favourable. Moreover, once a decision has been made and equipment installed, productivity will be reduced because of the fluctuating availability, quality and cost of inputs.
Sources of TOT volatility
Part of the reason for Nigeria’s extreme TOT volatility is the very concentrated nature of its exports relative to its well diversified imports. Roughly 95 per cent of Nigeria’s exports come from oil and this has not changed much since 1974. The other problem is that oil prices are extraordinarily volatile relative to most other commodity prices. A sample of world prices for 37 key export commodities shows that only the free market price of sugar was more volatile than crude oil prices when volatility is defined as the standard deviation of annual percentage price
changes for the period 1960–2001.6
Policy implications
Diversification of exports per se is not guaranteed to reduce TOT volatility for the
nation. Instead, the best outcome for Nigeria would be diversification into activi-ties with output and price trends that are uncorrelated with oil prices. For exam-ple, expansion into natural gas exports is a useful form of diversification – but only because Nigeria’s long-term contracts mandate minimal price adjustments
over time.7 The alternative, linking prices to the spot market, would not help
reduce TOT volatility much because spot prices for gas are positively correlated with oil prices.
It is also important to distinguish between the TOT faced by the nation and the TOT faced by individuals and firms. Expanding the output of traditional non-oil exports such as cocoa will help reduce national TOT volatility but it should be acknowledged that these commodities also face volatile world prices, even if they are uncorrelated with the price of oil. Thus, the individuals marketing cocoa and other commodities will continue to face considerable uncertainty. World prices
for manufactured goods, however, are generally less volatile.8
1.4.2 Revenues and expenditures
Roughly 86 per cent of federally collected revenues in Nigeria are based on oil receipts, up from 77 per cent in 2001. This high dependency upon oil, combined with its volatile price, made Nigeria the third most volatile country with respect to real per capita revenue performance in a sample of 71 countries over the period 1961–2000 and the second most volatile for the period 1991–2000. The standard deviation in the growth rate of real revenues per capita in Nigeria for the period 1961–2000 was 41 per cent compared to the sample median of 11 per cent. Other oil exporters with a heavy dependence upon oil exports for revenues display simi-larly high standard deviations in real revenue per capita growth over 1961–2000: 45 per cent for Kuwait, 37 per cent for Iran, 28 per cent for Saudi Arabia, 26 per cent for Venezuela and 20 per cent for Trinidad and Tobago.
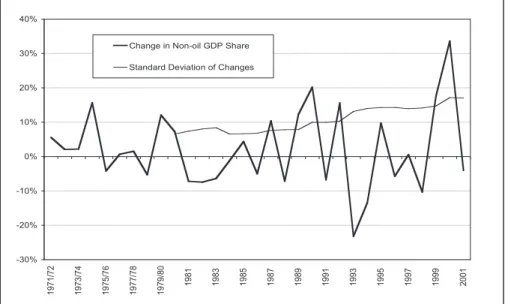
This volatility can also be measured as changes in GDP shares.9Figure 1 shows
that the volatility of federally collected revenues plus state internal revenues as a share of non-oil GDP had been increasing through 2001.
Managing Extreme Volatility for Long-run Growth -30% -20% -10% 0% 10% 20% 30% 40% 1 9 7 1 /7 2 1 9 7 3 /7 4 1 9 7 5 /7 6 1 9 7 7 /7 8 1 9 7 9 /8 0 1 9 8 1 1 9 8 3 1 9 8 5 1 9 8 7 1 9 8 9 1 9 9 1 1 9 9 3 1 9 9 5 1 9 9 7 1 9 9 9 2 0 0 1
Change in Non-oil GDP Share Standard Deviation of Changes
Figure 1 Revenue volatility, 1971–2001.a
a Includes federally collected revenues and state internal revenues. Standard deviations are calculated using 10-year periods.
The costs of revenue volatility
One concern regarding revenue volatility is its impact on private sector spend-ing. According to classic multiplier theory, in order to stimulate growth, the tax
burden on the private sector should be made to fall when GDP growth slows.10 In
Nigeria, this is less of a concern because an average of 75 per cent of all revenues between 1974 and 2001 came from taxes levied on the enclave oil industry rather than the private sector. Instead, the larger macroeconomic issues are the impact of revenue volatility on government expenditures and the RER.
Revenue volatility is frequently cited as a source of difficulty in the delivery of high quality public services – mainly because of the havoc uncertainty plays
with budgetary planning and implementation.11 Part of the problem is that
min-istries do not know whether an upturn or downturn is temporary or permanent.
Predicting the direction, magnitude and duration of revenue shocks is extremely
difficult.12
Booms in project spending may lead to less careful screening of new projects and programmes. Many new spending items will end up being poorly conceived or wasteful – and more than a few will be based on the assumption that high revenues will continue indefinitely. When revenues fall, many projects cannot be sustained. Many projects must be abandoned while those that survive either are poorly executed or are well funded only through borrowing.
The results are visible to any traveller in Nigeria: abandoned government projects can be seen in almost every region and state. Less anecdotally, the 1992 Presidential Monitoring Task Force identified 3907 federal projects which had
been started prior to 1992. Of these, only 808 had been completed by 1992. Project managers were able to identify future completion dates for only 1068 projects out of the remaining 3099 uncompleted projects. Many people have also argued that this outcome is the result of inappropriate incentives for project of-ficers and their superiors: rent seeking is easier with a large portfolio of projects while project completion is poorly rewarded if at all.
Revenue volatility complicates monetary and exchange rate policy as well. If the government chooses to maintain its spending targets, regardless of revenue outcomes, then it must save and borrow. If the borrowing comes from domestic sources, then the government must accept higher inflation, higher interest rates or both – depending upon the mix of bank and non-bank financing. If the gov-ernment is able to borrow from abroad, as it did heavily in the early 1980s, then it may eventually face higher debt service obligations that will force a choice between less spending and exchange rate depreciation – unless the shock quickly reverses itself or there are plenty of foreign assets to draw upon.
The impact of inflationary spending on the private sector can be especially perverse in an economy like Nigeria. Nigeria’s underdeveloped financial markets limit the ability of the government to switch into non-bank financing and the Central Bank has little power to rein in government spending. When fiscal disci-pline is lacking, the only option available to the Central Bank (CBN) for fighting inflation is to try to hold down inflation by sharply reducing credit to the private sector. The effect of such a policy is clearly recessionary.
There are issues of political economy as well. During boom times, the best policy would be to assume the shock is temporary and so save the excess revenues and sterilize the impact on the money supply through an increase in foreign as-sets. Yet, during booms, ministries feel pressure from their constituencies to accel-erate spending. The spending pressure often comes from demands for higher civil service wages and more projects. The former is extremely pernicious because the wage increases are not easy to reverse if revenues subsequently fall – thus forcing government to rely on borrowing. The ironic effect of these spending pressures is
that fiscal deficits tend to emerge during or just after revenue booms.13
Sources of revenue volatility
Most of Nigeria’s revenue volatility can be traced directly to Nigeria’s dependence upon oil exports for the bulk of its fiscal revenues. Between 1974 and 2001, oil
accounted for an average of 75 per cent of federally collected revenues.14 As oil
prices climbed in recent years, this share has risen to 86 per cent in 2005. An ex-amination of oil prices over time reveals that there has been a consistent upward trend in oil prices over time. Yet there is considerable short-term volatility su-perimposed on this trend even after the boom and bust cycles from OPEC in the 1970s and 1980s and the wars in the Middle East. In fact, in the 15 years between 1987 and 2001, there were seven upturns and eight downturns and only five years had changes of less than 10 per cent. Recent years have been especially volatile with the price crashing by 37 per cent in 1998 to $12/barrel, then rising 46 per
Managing Extreme Volatility for Long-run Growth recent data at the time this chapter was written suggest that the degree of volatil-ity continues unabated: after reaching a peak of $75/barrel in August 2006, oil prices then fell by $16/barrel in September 2006.
The next largest revenue source is import duties which contributed an average of 13 per cent of federally collected revenue between 1974 and 2001 and 4 per cent in 2005. This revenue source sometimes mirrors the volatility in oil prices. This is because, in Nigeria, long-term import trends closely follow export trends, subject to fluctuations in external financing and reserve movements. The statisti-cal correlation between oil revenues and customs revenues, expressed as shares of non-oil GDP, thus becomes fairly tight (0.62) for the period 1984–2001, the years after external loan drawings began to decline.
Expenditures
In theory, there is no reason why revenue volatility should affect expenditures as long as governments have recourse to borrowing. In practice, however, most governments in developing nations have rather limited access to flexible levels of international borrowing, domestic bond markets are inadequate and there is a limited tolerance for inflationary domestic financing. Fielding (1995) shows em-pirically that the consequence of these practical constraints is that expenditure trends in many countries tend to be strongly correlated with revenue trends. This is the case in Nigeria as well.
In most years between 1971 and 2001, it appears that Nigerian expenditures
are well explained by the revenue performance of the previous year. In other
words, despite revenue projections, despite intentions to save oil windfalls and despite budgeted expenditure allocations, Nigerian policy-makers authorized ac-tual expenditures as if revenues collected in one year would be roughly the same
as in the previous year.16 This behaviour is the result of weak fiscal discipline and
difficulties in making reliable oil price forecasts. As a result, the data do not reject the simple hypothesis that combined federal and state expenditures are a simple function of federal and state revenues collected from the previous year – with both
measured as non-oil GDP shares.17 (See Figure 2.) This result holds up even when
one looks at the data in first differences – for example, the change in expenditure
shares is a function of changes in lagged revenue shares. (See Table 2 below.)
The data also indicate that spending rose and fell more than
proportional-ly with respect to revenues – but onproportional-ly through 1986. This can be seen in
Fig-ure 2 where expenditures accelerated much more rapidly than revenues through
1977/78 and then fell more than proportionally when revenues fell in 1978/79. When revenues picked up again in the following year, so too did spending. Before 1986 and on average, a 1 per cent change in the lagged revenue share of GDP was met by a 1.3 per cent change in expenditures. After 1986, expenditures contin-ue to follow lagged revencontin-ues though the relationship is much weaker, especially
when measured in first differences.18
Why would expenditures expand and contract faster than revenues over 1970– 86? A partial explanation is presented here, though more exploration is warrant-ed. Part of the answer comes from the voracity effect postulated by Tornell and
Table 2 Elasticity of expenditures to revenuesa
GDP shares Changes in GDP shares
Elasticity p-valuesb Elasticity p-valuesb
1970–2001 0.4 0.00 0.4 0.03
1970–1986 1.3 0.00 1.2 0.01
1987–2001 0.3 0.02 0.2 0.19
a Federal and state only.
b Values above 10 per cent indicate the estimated elasticity is not significantly different from zero.
Source: Staff calculations based on regressions of expenditure shares on lagged revenue shares.
Lane (1998). They suggest that spending becomes more than proportional to rev-enue windfalls when the political and legal institutions within a nation are weak
and contested by strong interest groups.19 This seems to be a good description of
the Nigerian situation. As shown in Chapter 1 of World Bank (2003), the histori-cal quality of governance in Nigeria has been inadequate measured against many standards. It is also well known that Nigerian society is strongly factionalized
along ethnic lines. Bevan et al. (1999) note that ethnic concerns have informed
many fiscal decisions, notably with regard to revenue sharing, the creation of new states and the distribution of development projects. Talvi and Vegh (2000) build on this, suggesting that more volatile economies have a harder time resisting spending pressures during booms because the revenue booms are so much larger.
Figure 2 Revenues and expenditures, 1971–2001.a
a Includes federal and state governments. Revenues are federally collected plus state internal revenues.
Source: CBN and World Bank staff calculations.
0.0% 10.0% 20.0% 30.0% 40.0% 50.0% 60.0% 70.0% 80.0% 90.0% 1 9 7 1 /7 2 1 9 7 2 /7 3 1 9 7 3 /7 4 1 9 7 4 /7 5 1 9 7 5 /7 6 1 9 7 6 /7 7 1 9 7 7 /7 8 1 9 7 8 /7 9 1 9 7 9 /8 0 1 9 8 0 1 9 8 1 1 9 8 2 1 9 8 3 1 9 8 4 1 9 8 5 1 9 8 6 1 9 8 7 1 9 8 8 1 9 8 9 1 9 9 0 1 9 9 1 1 9 9 2 1 9 9 3 1 9 9 4 1 9 9 5 1 9 9 6 1 9 9 7 1 9 9 8 1 9 9 9 2 0 0 0 2 0 0 1 Share of Non-oil GDP Lagged Revenue/GDP Expenditures/GDP
Managing Extreme Volatility for Long-run Growth 11 They back this up by demonstrating an empirical link between revenue volatility and expenditure elasticities.
Why has the elasticity of spending to revenues decreased over time? Part of the explanation for this weakened link is that the external creditors had a tendency to lend on a pro-cyclical basis, lending more during boom years, thus amplifying the sensitivity of spending to oil revenues. This behaviour ended when it became apparent that Nigeria would not be able to meet all of its debt service obligations, particularly after the oil price crash of 1986.
Fiscal balance
If expenditures are well described by lagged revenue, then it must also be true that the fiscal deficit is well described by revenue less lagged revenue. This supposition
is supported by the data. (See Figure 3 below.) The correlation between the change
in federal and state collected revenue and the combined federal and state fiscal balance is 0.51 over the period 1970–2001 when the data are measured as shares of non-oil GDP. In fact, 61 per cent of the trend between 1971 and 2001 can be explained by the data for lagged revenues combined with data for net external
flows from commercial lenders and the lagged balance.20
Policy implications
The fiscal behaviour described above has adverse consequences for macroeco-nomic stability. The volatility in the overall fiscal balance could be reduced by a smoother expenditure path. This change in fiscal behaviour would also do much
Figure Revenue and the fiscal balance, 1971–2001.a
a Revenues include federally collected revenue plus states’ own revenues. Expenditures include federal and state levels. Spending by local governments and special funds is excluded for lack of data.
-30% -20% -10% 0% 10% 20% 30% 40% 1 9 7 1 /7 2 1 9 7 3 /7 4 1 9 7 5 /7 6 1 9 7 7 /7 8 1 9 7 9 /8 0 1 9 8 1 1 9 8 3 1 9 8 5 1 9 8 7 1 9 8 9 1 9 9 1 1 9 9 3 1 9 9 5 1 9 9 7 1 9 9 9 2 0 0 1 Change in Revenue (% Non-oil GDP) -40% -30% -20% -10% 0% 10% 20% 30% 40% Balance (% Non-oil GDP) Change in Revenue Fiscal Balance
Figure Volatility of growth rate for the real exchange rate index.a
a Real exchange rate data are from IMF and are based on the exchange rate used by Government. This diverged from the official rate applied to private sector transactions during 1995–98. Standard deviations are calculated using 10-year periods.
to improve the efficacy of public service delivery and, thus, increase growth. Sec-tion 1.3 above cited evidence that productivity growth and project performance are both encouraged by stability in government spending.
The impact of a smoother expenditure path on the overall fiscal balance is il-lustrated below. Suppose revenues alternate between 20 per cent of non-oil GDP in one year and 50 per cent of non-oil GDP in the next year. Suppose that spend-ing follows the pro-cyclical behaviour described above in which spendspend-ing follows lagged revenues. In this case, the fiscal balance would alternate between positive and negative 30 per cent of GDP. Contrast this outcome to an alternative where expenditures are held constant at 35 per cent of GDP. The resulting alternative fis-cal balance will alternate between positive and negative 15 per cent of GDP. The lagged revenue spending rule in this example is twice as volatile as the constant spending rule.
The goal of a constant expenditure share does presume access to foreign ex-change during revenue shortfalls, whether from borrowing or from drawing down foreign assets. It is important, in this regard, to be very realistic about access to foreign exchange. If foreign assets are too low to sustain spending, or if there is lit-tle access to concessional borrowing, then the expenditure share of non-oil GDP must be reduced and held to the new, lower level until circumstances improve.
1.4.3 The real exchange rate
As indicated in Table 1, Nigeria has one of the most volatile RERs in the world.
Moreover, RER volatility had been rising almost continuously through 2001. This
Managing Extreme Volatility for Long-run Growth 1 TOT volatility tend to also display high RER volatility. Within a sample of 87 countries, 31 displayed high TOT volatility over the period 1980–94. Of these, 25 had high RER volatility. As will be shown below, the outcome depends upon whether fiscal expenditures are pro-cyclical or counter-cyclical with regard to rev-enues. Expenditures may either dampen or amplify revenue fluctuations driven by TOT volatility.
The costs of RER volatility
RER uncertainty (proxied by volatility) is important because it inhibits private
sec-tor investment.21 RER uncertainty affects the profitability of investments through
price channels and through the cost of borrowing. Risk averse investors in agri-culture, manufacturing or services will hesitate to invest until they can be assured of strong profits. Once they have invested, they may also hesitate to abandon a project for something better because they cannot be certain the economic climate has permanently turned against them. Yet the new investments required to make an enterprise grow may not materialize because a bright future is not in clear view. Second, volatility affects the ranking of investments: if the exchange rate is likely to depreciate, then a low ranked project in cocoa exports might become
more profitable than a high ranked manufacturing enterprise that relies heavily
on imported materials. Risk averse investors thus tend to defer their decisions until more information is available, the uncertainty is reduced or they gain ac-cess to some form of insurance (risk diversification). Acac-cess to financial markets, both domestic and international, is crucial for the latter. Hence, as documented in Servén (2002), the adverse impact of RER uncertainty is stronger for economies with less developed financial systems.
Determinants of RER volatility
The RER is defined in this chapter as the exchange rate in dollars per naira, ad-justed by the ratio of Nigerian to trading partner inflation. The economic deter-minants of RER movements are changes in real aggregate supply and demand. In particular, fiscal outcomes, with their impact on money and inflation, have
been the main source of RER volatility in Nigeria.22 This is traced out below:
infla-tion is shown to be a funcinfla-tion mainly of monetary growth and real GDP growth while monetary growth in Nigeria has been mainly the result of domestic credit extended to the government.
Domestic inflation
Economic theory and research are very clear: monetary growth, relative to real
output growth is the main cause of inflation in all countries.23 International
infla-tion, transmitted through imported goods and exchange rate movements, is
an-other source.24 For many countries, however, international inflation is altogether
secondary to monetary policy because the international prices of manufactured
high rate of inflation in a preceding period tends to push up subsequent inflation
rates.25 This inertial element can add to volatility.
Fiscal outcomes
It is straightforward to establish that monetary growth in most years has been
driven mainly by fiscal outcomes.26 Growth in monetary assets (M2) must be
matched by growth in monetary liabilities which are composed of domestic credit extended by the banking system, net foreign currency holdings (reserves) and net other assets. In Nigeria, the stock of net domestic credit contributes the lion’s share of the stock of M2: domestic credit accounted for at least 80 per cent of the total in 25 of the 32 years between 1970 and 2001. It is not surprising, then, that monetary growth is also driven mainly by changes in domestic credit. In turn, net domestic credit is strongly influenced by fiscal outcomes. In most years, changes in net credit to the government outweigh changes in net credit to the private sec-tor. The correlation between flows of total net credit and flows of net credit to the government is extremely tight (0.81 when measured in millions of naira and 0.97 when measured as share of non-oil GDP).
A further examination of the historical record shows that most, though not all, fiscal balances have been financed by changes in domestic credit. This is the straightforward consequence of the underdeveloped nature of the bond market and Nigeria’s lack of access to international commercial credit since the mid-1980s. There is a very strong correlation (0.75) between the combined fiscal bal-ance of the federal and state governments and the change in net domestic credit to the government over the period 1970–2001 when both are measured as shares of non-oil GDP. Thus, one can reasonably conclude that, for most years, fiscal outcomes have been the main force behind changes in total net credit in Nigeria. In fact, the correlation between the two (again measured as non-oil GDP shares) is also 0.75.
1.4.4 An example of how volatility is created
Understanding the interplay between fiscal outcomes, inflationary inertia and exchange rate policies is crucial to understanding volatility. The period 1994–96 displayed a strong increase in volatility and serves to illustrate several aspects of this interplay. The initial trigger for three years of instability was the fiscal deficit
of 1993 worth 26 per cent of non-oil GDP. (See Table 3 below.) Spending
behav-iour in that year reflected the expectation that the 1992 oil price of $20/barrel would be maintained when, in fact, it fell to $17.50/barrel. Moreover, spending in 1993 was under pressure from the cost of financing presidential elections and from a sharp increase in the civil service wage scale. This led to an inflation rate of 57 per cent. The inflationary inertia created in 1993 ensured that the inflation rate remained at 57 per cent in 1994 even though the fiscal deficit fell to 11 per cent of non-oil GDP. In 1994, the full impact of domestic inflation fell on the RER because the authorities held the exchange rate fixed, by fiat. Thus, when fall-ing world prices were combined with domestic inflation, the RER appreciated by 86 per cent.
Managing Extreme Volatility for Long-run Growth 1
Table Volatility in inflation and RER, 1993–97
1993 1994 1995 1996 1997
Revenue as percentage of non-oil GDPa 27 21 27 30 30
Expenditure as percentage of non-oil GDP 53 32 28 27 30 Fiscal Balance as percentage of non-oil GDP –26 –11 –1 2 0
CPI inflation rate (%) 57 57 73 29 9
Parallel exchange rate premium (%)b 157 228 –3 1 4
Exchange rate growth (%) + devaluation 28 –1 270 0 0
Real exchange rate growth (%) 10 86 –15 24 15
a Federal and state governments.
b Based on official rate used by private sector.
Source: CBN and World Bank staff calculations.
By 1995, the authorities realized that something had to change. The high infla-tion rate had put pressure on the parallel exchange rate, boosting the premium to 226 per cent in 1994, up from an already high 157 per cent in 1993. This, in turn, undermined the official exchange rate, prompting the authorities to introduce
the autonomous foreign exchange market (AFEM) for private sector use in 1995.27
The private sector thus saw an effective devaluation of 268 per cent, far in excess of the accelerating inflation rate. Thus, the RER fell by 15 per cent.
The fiscal authorities, reacting to inflationary pressures, managed to balance the budget in 1995. Yet inflation continued to rise in 1995 mainly because of the large devaluation in that year and the inertia from the preceding year. Inflation did not fall to 29 per cent until 1996 after a second year of balanced budgets. This
inflation rate was passed on directly to the RER because of an almost stable
ex-change rate and a low international inflation rate. The inflation rate and RER sta-bilized further in 1997 thanks to a third year of balanced budgets. (This outcome was made much easier by higher oil prices over the period 1995–97.)
Policy implications
The root causes of RER volatility in Nigeria are TOT volatility and the conduct of fiscal policy. This suggests the need for a two-pronged approach. In the long
run, building a less volatile revenue base would help generate the stable fiscal
outcomes needed to reduce RER instability. This is a long-run process. Yet, even if revenues cannot be quickly smoothed, the analysis above indicates there are still gains to be had from smoothing expenditures with deficits and surpluses absorbed by changes in net foreign assets. During boom times, the best policy would be to assume the shock is temporary and so save the excess revenues and sterilize the impact on the money supply through an increase in foreign assets or faster repayment of external debt obligations. During severe oil price declines, the government could either draw down its own foreign assets or coordinate with
the CBN so that reserve drawings could balance increased domestic credit to the government. This approach is challenging, mainly because of current political and institutional issues but also because past political decisions have constrained Nigeria’s access to external borrowing and reduced the stock of reserves below what they could have been. More recently, however, there has been a substantial accumulation of reserves.
1.5
Establishing a conducive macroeconomic environment
The analysis above provides useful guidance in creating a strategy for a more con-ducive macroeconomic environment for growth and diversification. Stabilization is the necessary foundation, given the high losses in growth caused by Nigeria’s extreme levels of macroeconomic volatility. The objectives of the strategy are to increase the private sector investment rate and raise the productivity of both pub-lic and private investment. The private sector investment rate can be increased through a combination of macroeconomic stabilization, financial sector deepen-ing, improved governance and more openness to trade. More stability in gov-ernment spending could help to raise productivity of govgov-ernment investments, especially if complemented by efforts to improve the capacity for public financial management. The use of an expenditure smoothing fiscal rule and/or revenue smoothing will lead to the necessary fiscal stabilization and to less RER volatility. This macroeconomic stability will encourage the private investment needed for growth and economic diversification.
A more diversified economy, in turn, will lead to less volatility in the TOT and a broader, less volatile tax base. Less TOT volatility will increase productivity growth while revenue smoothing will help ensure the sustainability and effective-ness of public expenditures for much needed public services. Additional support-ing reforms may also be needed, especially with regard to institutional roles and institutional capacity. Among these are an improved capacity for project selec-tion, preparaselec-tion, execution and monitoring.
The sequence of policy reforms is important to the strategy. The main sources of RER volatility in Nigeria for the foreseeable future will be oil price shocks and instability in government spending. These issues are intertwined and can be ad-dressed together in the medium term through the adoption of an appropriate expenditure smoothing fiscal rule. Yet this kind of rule cannot operate without a sufficiently large stock of foreign assets and, ideally, access to external credit. Thus, building foreign assets and working towards credit-worthiness must be-come short-run imperatives.
Private investment can still be encouraged during this first phase, even without stabilization, through reforms aimed at strengthening the financial system, mov-ing towards greater trade openness and by improvmov-ing the quality of governance. Fiscal adjustment may also be required in the form of less spending, if revenue growth is not sufficient; first to build external assets and then later to eliminate the crowding out of credit to the private sector by the government.
Managing Extreme Volatility for Long-run Growth 1
1.5.1 Preparing for stabilization
In this section, several policy options to reduce volatility and encourage growth are described. These are described in sequence with short-term foundation build-ing precedbuild-ing the stabilization effort – and with investment encouraged by stabil-ity preceding long-run diversification.
The government will need to put two key cornerstones into place in order to achieve successful stabilization in the medium term. The first is to gradually build a sufficiently large stock of foreign assets to draw upon in the face of oil price downturns. The second is to put in place a number of financial sector reforms that will later facilitate the intermediation of a larger volume of domestic credit to the private sector by the banking system.
Building foreign assets2
Suppose that Nigeria chose to build the stock of foreign assets to the point where almost any negative oil shock could be fully absorbed and still leave a balance worth four months of imports. Between 1970 and 2005, according to Govern-ment of Nigeria (GoN) data, the average annual level of imports was $8.3 bil-lion. Four months of imports is therefore worth $2.8 bilbil-lion. Between 1970 and 2005, for all years with price declines, the average annual change in the price of Nigerian oil (Bonny Light) was $3.40 per barrel with 95 per cent of all
histori-cal declines falling between zero and $10.88 per barrel.29 Suppose Nigeria were
to eventually reach an export volume of 2.75 million barrels per day, up from 2.52 million barrels per day in 2005. At this volume, an average price decline of $3.40/barrel would be worth $3.4 billion annually while a catastrophic decline of $10.88 would be worth $10.9 billion annually. Thus, the total stock of foreign assets required to compensate for two years of falling prices, including the mini-mum balance of $2.8 billion, is $9.6 billion for average declines and $24.6 billion for historical catastrophic declines. Using a more sophisticated approach, Bartsch (2006) shows that a stabilization fund of about $16–18 billion would be adequate if accompanied by a fiscal policy based on moving average oil prices over three to five years. Using a moving average is necessary because oil prices do not revert to a stable mean.
Operational issues
Real investment is equal to the sum of private savings, government savings and foreign savings. Foreign savings will fall temporarily as foreign assets are built up. Thus, if investment is to increase in the short run, the necessary financing must come from higher savings by the government and by the private sector. Govern-ment savings can be increased only through higher revenues or less recurrent spending. Higher revenues are certainly possible, especially in the long run as the economy grows and diversifies, but the immediate adjustment must come from reduced recurrent spending. In other words, until foreign assets reach an adequate level, all oil revenue windfalls must be saved while shortfalls must be met by expenditure reductions.
More generally, it is important to acknowledge that building foreign assets will temporarily divert resources that could otherwise be used for consumption and investment. Growth could therefore temporarily slow if assets are built too quickly. Deeper work with macroeconomic models will be required to assess the needed changes in spending and credit targets more precisely.
Finally, the need for such a high stock of foreign assets could be moderately reduced if Nigeria had good access to the international financial markets – some short-term oil price fluctuations could be covered by external borrowing, although this could prove to be expensive.
Financial sector reforms
Section 1.3 above explained that strong financial systems can reduce the negative impact of macroeconomic volatility. The system has not been working as needed. One measure of the strength of a nation’s financial sector is the volume of domes-tic credit to the private sector. The average flow of credit to the private sector in the fast growing nations for the 15-year period 1980–94 was 6.6 per cent of GDP versus only 4 per cent of non-oil GDP in Nigeria for the 15 years between 1989 and 2003. In terms of stocks, rather than flows, the Nigerian average is 19 per cent of non-oil GDP versus 44 per cent of GDP for the fastest-growing nations.
How can this situation be improved? Part of the answer is that the government has historically consumed so much credit that little room is left for the private sector without risking high inflation rates. In fact, the government absorbed the majority of all net domestic credit flows in 11 of the 15 years between 1989 and 2003. The obvious solution is for government to make the overall fiscal balance more positive. If this is achieved by reducing non-essential recurrent spending, then Nigeria could continue to make needed productive investments in infra-structure. Moreover, such an adjustment is already necessary for the build-up of external assets. Thus, the sequencing of this part of the reform could follow the successful attainment of the foreign asset target.
In the short run, while assets are being built up, the government must be sat-isfied that the financial system is well regulated and free from distortions. Large parallel exchange rate premiums, such as those found in the mid-1990s, can in-duce banks to focus on exchange rate arbitrage rather than domestic portfolios. Financial repression in the form of interest rate ceilings, if any, excessively high liquidity ratios and directed credit programmes can constrain the flow of credit to the private sector. There are also strong correlations between poor financial devel-opment, weak accounting standards, weak contract enforcement by the judicial system and corruption, according to cross-country empirical work by Demirguc-Kunt and Levine (1995). Property rights are important too. Holden and Proko-penko (2001) cite the case of Peru where the value of slum dwellings doubled after the government provided secure, registered titles. This, in turn, allowed people greater access to credit from the banks.
Managing Extreme Volatility for Long-run Growth 1
1.5.2 Fiscal rules
The use of fiscal rules remains limited across developing countries and few focus on the macroeconomic volatility created by heavy dependence upon a volatile export commodity. Instead, most fiscal rules are meant to support broad goals related to debt reduction and/or low inflation. Examples include targets for pri-mary expenditures, the pripri-mary budget balance (the so-called ‘golden rule’), the overall budget balance or the stock of debt. Additional rules may constrain cer-tain categories of spending such as the wage and pension bill or may earmark some types of revenue for specific categories of spending. These rules are usually enshrined in the constitution, or in national legislation, and are often backed by legal sanctions.
These rules are often flexible enough to be modified to allow for the impact of unforeseen shocks. In some countries, for example, if GDP falls sufficiently below an expected trend, then governments may be allowed to borrow (up to prescribed limits) while the same rule mandates fiscal savings if actual GDP exceeds the pro-jected trend by a sufficient amount. Variations on this theme include the use of contingency funds linked to GDP trends and stabilization funds linked to revenue performance.
The main selection criteria for the rules listed above must include the ability to stabilize expenditures and the RER. These criteria are motivated by the analysis presented in Section 1.3 that suggests that there are high costs to growth from volatility in these variables. The analysis in Section 1.4 reinforces the conclusion that expenditures should be stabilized: it was noted that pro-cyclical expenditure behaviour tends to amplify the degree of macroeconomic volatility in the Nige-rian economy.
Inappropriate rules
In this light, any rule that sets a target for the primary balance or the overall bal-ance is not appropriate for Nigeria. Under the golden rule, for example, revenue fluctuations would have to be met by equivalent adjustments in recurrent spend-ing – somethspend-ing that most governments find difficult to achieve – while all capital spending is financed by borrowing. This rule fails to insulate recurrent expendi-tures. If the overall budget is to be balanced instead, then revenue fluctuations are met by changes in total spending. This rule also fails to insulate expenditures even though it can sometimes help the monetary authorities maintain targets for domestic credit and the money supply by eliminating the need for government borrowing. Debt target rules are also inappropriate: revenue contractions would still require expenditure cuts in order to avoid new borrowing.
Expenditure smoothing rules
If stability in expenditures is desired, then it is best to set such a target directly
GDP could be thought of, in this context, as a sort of cyclically adjusted measure of GDP in which the direct impact of oil price and volume fluctuations have been filtered out.
By way of example, a stable target for primary expenditures could be set in
terms of non-oil GDP shares. Such a rule will require a departure from current fiscal behaviour, in which spending tends to follow lagged total revenue. Alter-natively, one could set a target for the non-oil primary fiscal balance (meaning that oil revenues are excluded) as a share of non-oil GDP. The two approaches
are almost equivalent: expenditures under the second option will be stable to the
extent that non-oil revenues are stable.
Table 4 provides an illustration of how recent fiscal performance would look if
either of the expenditure smoothing rules above had been used. The table shows
the consolidated performance of all levels of government for the period 1993– 2001. Non-oil revenues varied around an average of 12 per cent of non-oil GDP. Primary expenditures fluctuated around an average of 41 per cent of non-oil GDP with a standard deviation of 15 per cent of non-oil GDP. This left an average defi-cit of 29 per cent of oil GDP with a standard deviation of 13 per cent of non-oil GDP. This deficit was financed by a primary non-oil balance worth 27 per cent of GDP. When debt service is subtracted, the overall fiscal balance displays a deficit equal to 7 per cent of non-oil GDP. The overall deficit had a standard deviation of 9 per cent of non-oil GDP.
Suppose instead that primary expenditures were not allowed to deviate from a
target of 41 per cent of non-oil GDP.30 Define this as fiscal rule number 1. In this
case, the standard deviation in spending drops to zero from 15 per cent of non-oil GDP while the standard deviation in the overall balance is increased to 15 per cent of GDP. Alternatively, suppose that fiscal rule number 2 mandates a primary non-oil deficit of 29 per cent of non-oil GDP. In this case, the standard deviation in primary expenditures drops to 4 per cent of non-oil GDP rather than 15 per cent. The standard deviation in the overall balance increases to 12 per cent of non-oil GDP. The outcome for both rules is a reduction in spending volatility and an increase in the volatility of the overall balance.
The increased volatility in the overall balance can be put to good use. The fact that oil revenues are based upon foreign exchange receipts allows Nigerian policy-makers an important opportunity to stabilize the RER – provided that the fluctuations in the overall balance are matched by changes in net foreign assets – through either changes in net external borrowing or changes in foreign assets.
If oil revenues suddenly rise, for example, spending can be kept on target by
using the windfall to pay down external debts.31 By using the windfall fully in this
manner, the authorities will avoid a RER shock (appreciation). Alternatively, the windfall denominated in foreign exchange could be deposited in a government account denominated in foreign exchange. It could also deposit the windfall with the CBN in a naira denominated account, thus reducing domestic credit. The CBN would then preserve its annual targets for the money supply and for domestic credit to the private sector by building up external reserves. Each of these options has the effect of increasing the stock of net foreign assets, allowing the authorities
Table Fiscal outcomes, 1993–2001 As percentage of non-oil GDP A verage S.D. 1993 1994 1995 1996 1997 1998 1999 2000 2001 Actual outcomes non-oil revenues 12 4 8 8 13 9 12 9 12 14 19 less primar y expenditures 41 15 50 29 33 28 31 27 42 64 64 equals primar y non-oil balance –29 13 –41 –21 –20 –19 –19 –18 –30 –50 –45 less primar y oil balance a 27 12 27 17 24 24 21 14 24 51 42 less debt ser vice 5 3 11 7 4 3 3 3 6 4 5 equals overall balance –7 9 –26 –11 0 2 0 –7 –12 –4 –8 Fiscal r ule 1 Primar y expenditures 41 0 41 41 41 41 41 41 41 41 41 Primar y non-oil balance –29 4 –33 –33 –28 –32 –29 –32 –29 –27 –22 Overall balance –7 15 –17 –23 –8 –11 –10 –21 –12 19 15 Fiscal r ule 2 Primar y expenditures 41 4 38 37 42 38 41 38 41 43 48 Primar y non-oil balance –29 0 –29 –29 –29 –29 –29 –29 –29 –29 –29 Overall balance –7 12 –13 –19 –10 –8 –10 –18 –12 17 8 a Defined as oil revenues less government obligations to joint venture companies . Sour ces: Central Bank of Nigeria and W orld Bank staff calculations.
to avoid an appreciation of the RER. If oil revenues fall under these rules, exces-sive expenditure reductions can be avoided by drawing down the stock of previ-ously saved oil surpluses. In this regard, it is fundamentally important that the resulting deficits be limited by the surpluses saved from previous booms.
A third fiscal rule, with effects similar to fiscal rule 2 above, relies on a reference
price for oil for ease of administration.32 Under this type of rule, the budget would
be balanced at the reference price. Oil revenues received at prices in excess of the reference price would be saved and invested either in external debt reductions or in external assets. Such a choice would be justified if one could be confident
that oil export volumes will be stable in the future. This would require a peaceful
resolution of the conflicts in the oil producing areas and a commitment not to increase or decrease exports too sharply.
Operational issues
In the short run, in order to gradually build up external assets, an asymmetric approach is required in which all oil windfalls will need to be saved while tempo-rary price troughs will need to be met by reductions in consolidated government
primary expenditures.33 Later, if the stock of assets reaches an adequate level, the
fiscal rule can be made fully symmetric: expenditure reductions can be avoided entirely by drawing down the stock of previously saved oil surpluses.
There will be a need to periodically reassess the appropriate level of spending in light of oil and non-oil revenue trends. Oil prices are notoriously difficult to predict and even the best projections of external asset requirements will not guar-antee a prudent opening stock (Baunsgaard, forthcoming). Expenditures will need to be reduced if oil price downturns are steeper or longer lasting than expected.
On the political economy side, there is a need to acknowledge that a fiscal rule is meaningless without political consensus and legal backing. Any rule can be evaded given the will to do so. Issues of Nigerian federalism must also be acknowl-edged. The 2002 Supreme Court ruling that all federation account revenues must be distributed creates needed transparency but it also implies that each state and local government has the potential to either confound or contribute to stabiliza-tion. These issues are taken up in a preliminary way in Chapter 4 of World Bank
(2003) but much more work will need to be done.34
1.5.3 Revenue smoothing
It would be beneficial if revenue volatility could be reduced whether or not an expenditure smoothing fiscal rule is put into place. If a fiscal rule is in place, smoother revenues will reduce the need for a large stock of foreign assets and/or reduce the need for heavy borrowing during oil price busts. If a fiscal rule is not
in place, smoother revenues will make it easier to plan for, and maintain, a stable
path for expenditures.
Nigeria already took an important first step towards less revenue volatility by implementing the VAT in 1994. This created a new revenue source with a relatively stable base. A second step might include the use of various financial instruments
Managing Extreme Volatility for Long-run Growth 2 to soften oil revenue volatility. Third, state governments could also increase their capacity to administer income taxes, as per their constitutional rights, on a wider basis. Between 1995 and 2000, Nigeria collected no more than 2 per cent of GDP from income taxes whereas other low income countries collect an average of 6 per cent of GDP. This is not a call to increase tax rates but rather to find ways to ap-ply existing laws more equitably across a larger number of citizens. Fourth, in the
long run, the revenue base itself will become more diversified and stable through
future non-oil growth and diversification. These topics are explored more below.
Oil revenues
The World Bank (1994, 1996) proposed that oil and gas price shocks could be avoided by transferring risk abroad through the use of hedging instruments such as futures contracts, options contracts, forward contracts and swaps. Mexico pro-vides a well-known example of what can be done. In 1990–91 Mexico bought put options, sold oil futures and used oil swaps to hedge price risk, as well as establishing a special contingency fund against oil price declines. The objective of the strategy was to ensure that it received at least $17 per barrel, the basis for its 1991 budget. Mexico’s experience shows that such strategies can be successful, but they are rarely used by exporting governments. One reason is asymmetric political risk: government leaders will be blamed for losses of potential revenue if oil prices rise but will receive little credit for hedging if prices fall. This suggests that any hedging strategy should be integrally built into the budget and clearly presented with the budget, more as a forward purchase of revenues than as a for-ward sale of oil. The feasibility of this risk transfer strategy for Nigeria would need careful study, however, because of its OPEC status: the political consequences for any OPEC member betting against positions taken by OPEC as a whole could be problematic.
Another way to avoid oil price shocks is to gradually exchange some or all of Nigeria’s oil reserves for financial assets. The money earned from the sale of oil and gas reserves could be invested in a diversified financial portfolio that will
generate income over time.35 This would generate a revenue stream for the
gov-ernment that is considerably less volatile than oil revenues. Such an idea is not as radical as it may seem. In 1989, the government sold a partial share of its equity in one of its oil joint venture companies for $2 billion. In 1993, the GoN sold another portion of its equity for $500 million (World Bank, 1996). There is no reason why more could not be sold, if there is enough political power supporting such a move.
Income taxation
State governments have the constitutional authority to collect state income taxes. Making a greater tax effort would have a large pay-off because the state govern-ments have such an important constitutional role in public service delivery for
health and education. It is important to be clear that the proposal is not about
existing (or lower) rates to a broader segment of society. (The maximum rate for personal income tax is 25 per cent, and for corporate income tax 30 per cent.) In
fact, if the tax rate had to be changed, then it should be revised downward while
maintaining its current progressive structure: a slight reduction in rates might help encourage taxpayer compliance.
In order to increase their ability to collect these taxes, state governments will need to spend some time identifying their tax bases. It is an advantage, in this context, that taxpayer identification numbers are being introduced and that tax administrations now exist in most states. This is a far more feasible task now than it would have been 15 years ago when the nation was more rural. Nigeria’s heavy urban concentrations are ideal for a greater income tax effort. There will be a need for close collaboration between the state governments and the national assembly in this effort because the constitution grants the power to set income tax rates to the Assembly. Tighter coordination between state and federal tax administrations would also be helpful.
This strategy might be made more palatable through a reduction in import
tariff rates. Lower tariff rates would help offset the welfare reduction created by higher income tax collection. Less expensive imports would help facilitate non-oil sector job and income growth, especially for non-non-oil exporters. In addition, because oil revenues and import duties are correlated, a reduction in tariff rates would also help reduce the volatility of the tax base to the extent that the share of trade taxes in total revenues is reduced.
Diversification
In the long run, revenue volatility could be substantially reduced through high non-oil growth and diversification. By way of example, suppose that Nigeria does achieve a real per capita growth rate of 4 per cent per annum in the non-oil sec-tors while oil output increases by 2 per cent per annum. An oil price drop worth $5 per barrel in 2015 would cause revenues to fall by 13 per cent of non-oil GDP. By contrast, that same shock in 2002 would have caused revenues to fall by 20 per
cent of non-oil GDP.36
1.5.4 Export diversification and terms-of-trade volatility
Export diversification will help stabilize the TOT. This will be beneficial because productivity growth may be accelerated by lower TOT volatility even when public investment rates are stabilized. Nigeria, like most countries, is usually not in a position to control the prices of its exports and imports. It can, however, reduce aggregate TOT volatility by changing the composition of either imports or ex-ports or both.
In Nigerian’s case, imports are already well diversified across a wide range of manufactured goods and a lesser number of primary commodities. Thus, the vola-tility of Nigeria’s index of import prices is fairly low, with a standard deviation in growth rates of less than 8 per cent. This puts the focus on exports. Nigeria will require diversification of exports into activities with output and price trends that
Managing Extreme Volatility for Long-run Growth 2
are uncorrelated with oil prices.In this context, it is noteworthy to observe that
export concentration, by itself, explains 68 per cent of the cross-country variation in TOT volatility for the period 1970–86.
Is rapid diversification a feasible goal? One way to judge is to look at what oth-er countries have achieved. Many countries have successfully divoth-ersified output and exports, some of them quite rapidly. Indonesia provides an example relevant to Nigeria because of its status as a major oil exporter. It was able to reduce its oil
share of exports and cut TOT volatility by half within a single decade.37
Effective diversification leading to less TOT volatility is likely to be difficult in Nigeria because the GoN does not intend to hold oil exports constant. On the contrary, the GoN is hoping to increase oil production and exports. Nigeria is also set for a rapid expansion of natural gas exports. This could also be a problem if significant volumes of gas are sold on the spot market, because gas prices are partially correlated with oil prices. Thus far, however, Nigerian LNG prices have been governed by long-term contracts.
Supportive policy is required if any effort at export diversification is to succeed, particularly in the face of continued growth in the volumes of oil and gas exports. Nigeria’s large internal market of over 130 million confers an advantage to those who might invest in manufactures that depend upon economy of scale for profit-ability. Trade theory and empirical observation shows that such situations allow
an easier penetration of exports38 – and, better still, most manufactures have fairly
stable world prices. This natural advantage, however, cannot be exploited without a conducive environment. In particular, it will be important not to allow the RER to appreciate to the point where Nigerian exports are not competitive on world
markets.39
1.6
Recent developments
The Government of Nigeria has implemented several elements of the strategy outlined above. We therefore review the progress made and its short-term impact. Next steps are proposed.
1.6.1 Fiscal rule
Until 2003, the government had not effectively implemented a fiscal rule that ensured saved excess revenues were used only when the actual price of oil fell
be-low the reference price from the budget.40 In 2003, the actual price was $29/barrel
versus a reference price of $22/barrel. That year, 2.4 per cent of non-oil GDP was
effectively saved. (See Table 5 below.) This rule, however, did not have legal
back-ing nor did it have a political mandate.
In 2004, GoN provided the mandate as part of its poverty reduction strategy entitled the National Economic Empowerment and Development Strategy or NEEDS. Among other things, NEEDS committed GoN to the adoption of ‘an oil price-based fiscal rule and a fund for excess revenues from crude oil sales’. That year, the government deposited in the Central Bank the oil revenue it received
Table Selected indicators, 1993–2005 A verage Standard deviation 1993 1994 1995 1996 1997 1998 1999 2000 2001 2002 2003 2004 2005 1993– 2002 2003– 2005 1993– 2002 2003– 2005 Oil price (US$/bar rel Bonny Light) Actual 16 16 17 22 20 12 18 26 26 25 29 38 55 Reference n/a n/a n/a n/a n/a n/a n/a 20 22 18 22 25 30 Effective fiscal rule? n/a n/a n/a n/a n/a n/a n/a no no no yes yes yes Non-oil GDP shares (%) Excess revenues a Saved 1.5 0.0 2.8 6.6 3.6 0.2 2.4 11.3 21.9 W ithdrawn 0.0 0.0 0.0 –2.4 –2.6 –1.5 0.0 0.0 0.0 T otal revenue collected 31 22 28 24 24 17 30 57 52 36 47 57 64 32 56 13 9 T otal expenditures b 32 19 18 18 20 22 31 32 37 34 37 37 37 26 37 8 0 Growth rates (%) Real exchange rate (+ appreciation) c 10 85 –15 23 14 14 –50 1 11 0 –5 3 15 9 4 34 10 Consumer price inflation 57.2 57.0 72.9 29.3 8.5 10.0 6.6 6.9 18.9 12.9 14.0 15.0 17.9 28.0 15.6 25.0 2.0 Real non-oil GDP 3.0 1.9 2.1 2.9 3.4 3.4 4.2 3.0 4.5 8.3 5.2 7.8 8.2 3.7 7.0 1.8 1.6 a Includes stabilization account transactions, excess crude proceeds and excess petroleum profits and royalties. b Federal, state and local. Excludes interest payments. Excludes Federal Capital T erritor y, Petroleum Special T rust Fund and a variety of other special funds. c Real exchange rate data are from IMF and are based on the exchange rate used by Government. This diverged from the official rate applied to private sector transactions during 1995–98.