Network Monitoring As a Layer of Security Page 1
August 4, 2009 CS 691 – Advanced System Security Design Security Project Documentation
Network Monitoring
As a Layer of Security
Jeff MillerNetwork Monitoring As a Layer of Security Page 2
Table of Contents
Table of Figures ... 2
1 Introduction ... 3
1.1 What networking monitoring in not ... 3
1.2 What to Monitor ... 5
1.3 Practical Application ... 6
2 Monitoring Concepts ... 7
2.1 SNMP ... 8
2.2 Other Passive Techniques ... 12
3 Monitoring Solutions ... 13 4 Nagios ... 14 4.1 Preparation ... 15 4.2 Installation ... 16 4.3 Configuration ... 22 4.3.1 Windows XP Clients... 22 4.3.2 Linksys WRT54GS Router ... 26 4.3.3 HP LaserJet 4 ... 28 4.4 Monitoring ... 30 4.5 Recommendations ... 33 5 Conclusion ... 33 6 References ... 34
Table of Figures
Figure 1 – Items to Monitor ... 5Figure 2 - Smart Grid Monitoring ... 6
Figure 3 - Military Monitoring ... 7
Figure 4 - MIB Storage Structure ... 9
Figure 5 - Oracle DB MIB Hierarchy ... 10
Figure 6 - SNMP Overview ... 11
Figure 7 - NSClient++ ... 14
Figure 8 - Test Bed Lab ... 15
Figure 9 - Nagios Portal ... 22
Figure 10 - Synaptic Package Manager ... 28
Figure 11 - Tactical Overview ... 30
Figure 12 - Current Status by Group ... 31
Figure 13 – Service Status ... 32
Network Monitoring As a Layer of Security Page 3
1
Introduction
The concept of network monitoring is not new nor is it as simplistic as the name might imply. Today’s networks are astoundingly large and complex. As a company grows, so does its reliance on the network for communication and collaboration. Some companies such as e-businesses could not exist without technology. So what then is network monitoring? In its most basic form network monitoring is a vital activity where one or more systems constantly monitor network status information from network devices, services, servers and various applications. When a problem exists the administrator is alerted to the nature and source of the problem. Typical networking management/monitoring systems can send alert messages in various forms such as text message (SMS), email, cell phone, pager, etc.
CIO Magazine recently published an article that provides an excellent high level definition of network monitoring. The article describes monitoring as follows: “Your doctor is watching for danger signs as blood flows through vessels, valves and chambers of the heart, while your network monitoring systems are tracking data moving along cables and through servers, switches, connections and routers.” The comparison of a physician monitoring the health of a human body to that of a network administrator monitoring his or her network paints a much more realistic picture of the goals of network monitoring. Just like the human body, enterprise networks and data centers are comprised of many subsystems each with a differening degree of criticality and separate thresholds that indicate the health of the organization [1].
With the increasing threat of cyber attack, network monitoring takes on a whole new challenge. Some of the security challenges facing networking administrators include hackers, Denial of Service (DoS) attacks, viruses, and information theft. The remainder of this document provides and overview of networking monitoring, common techniques, potential application, a list of common monitoring products, and a walk through of the implementation and configuration of a free open source monitoring system called Nagios.
1.1
What networking monitoring in not
In addition to discussing the general concepts of networking monitoring, it is also important to understand what networking monitoring isn’t. Network monitoring is not an
Network Monitoring As a Layer of Security Page 4
intrusion prevention (IPS) or intrusion detection system (IDS) nor is it a substitute for these kinds of systems even though it provides valuable information about the activity on the network. As with any security design a layered approach is best. With respect to security, the monitoring system should be considered as another layer of security used to augment an existing security design rather than a fix all for security issues.
No IDS, IPS, or Firewall can guarantee 100 percent prevention or detection of attacks; however, historic and real-time data from the monitor can help identify troubled areas. That being said, how can a monitoring system help increase system security?
General benefits include:
Spot overloaded equipment before it can bring down a network
Help determine employee productivity
Identify weak wide-area-network links and other bottlenecks
Measure latency or the delayed transfer of data
Provides executives the ammo they need to justify network upgrades
Prove SLA are being met Security specific benefits include:
Increased overall awareness of the enterprise
Detect anomalous or heuristic internal traffic that might indicate a security threat such as a DDOS attack – historical data compared to real-time actual data
Detect compromised computers being used as part of a bot-net in a DDOS attack by increased CPU cycles when no user is logged in
Detect overloaded systems, crashed servers, lost network connections, virus or malware infections, and power outages
Detect remote systems that are unavailable that may have been compromised or vandalized
Network Monitoring As a Layer of Security Page 5
1.2
What to Monitor
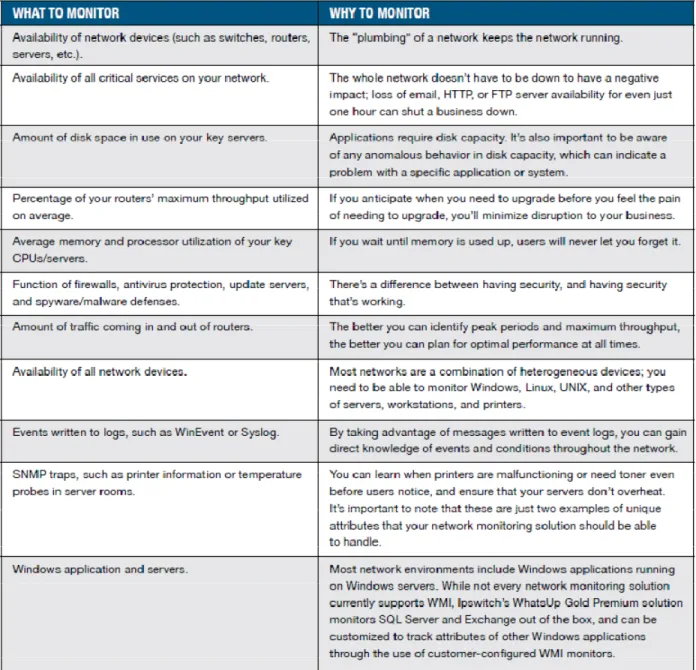
Monitoring tools are customizable and can monitoring a range of items. Most systems come with a predefined set of devices but also support custom devices through updates. Figure 1 – Items to Monitor is a list provided by IPSwitch, Inc. as a list of potential items and justification for why they should be monitored [2].
Network Monitoring As a Layer of Security Page 6
1.3
Practical Application
Business domains or deployment locations for network monitoring systems can be as diverse as the individual devices they monitor. Organizations or domains that would most likely benefit from real-time monitoring include but not limited to the following: internet service providers, utility companies, hospitals, military networks, and large corporations the rely heavily on networked computer systems.
Figure 2 - Smart Grid Monitoringrepresents a Landis+Gyr Advanced Metering Infrastructure (AMI) smart grid deployment [3]. By utilizing network monitoring the utilities company network administrator would be more likely to detect potential threats such as vandalism, tampering, denial or service (DoS), and compromised systems that are controlled by rouge process.
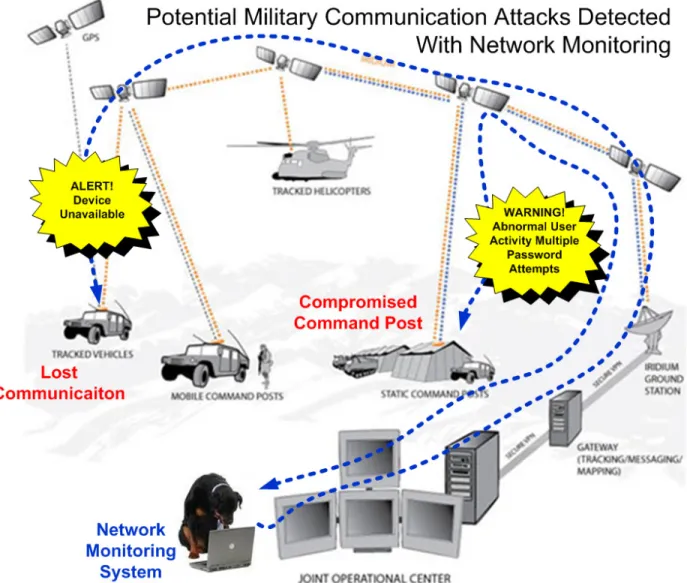
Figure 3 represents how a monitoring system could be applied to the infrastructure devices of a military communication system [4]. In this example the administrator would receive an
Network Monitoring As a Layer of Security Page 7
alert that a tracked “blue force” vehicle becomes unavailable. This would be a signal to other troops that something bad may have happened to this unit. The other scenario displayed below is a compromised command post. If the networking monitoring system determined that anomalous activity had occurred or that multiple incorrect password attempts were tried on the system this could indicate that further investigation be conducted.
2
Monitoring Concepts
Monitoring methodologies can be categorized into the two major sub sets of active and passive. Passive monitoring is the most basic and most common. Passive monitoring devices
Network Monitoring As a Layer of Security Page 8
watch and record real time traffic as it passes by. Passive techniques include traffic sniffers such as Wireshark or agents that are built into network devices and operating systems. Examples of passive technologies that are built into devices are Simple Network Monitoring Protocol (SNMP), Remote Monitoring (RMON), and Netflow/JFlow. It is important to note that passive monitoring does not create additional traffic besides the minimal amount required to collect information and send alerts [5].
Passive Techniques
SNMP
RMON
NetFlow/JFlow – Flow analysis
Packet Sniffer (Wireshark)
Active networking monitoring involves the generation and injection of test packets into the network. This generated test data is send to devices, servers, and or applications. Measurements are taken to ensure that the data reached its intended destination. Another name or active monitoring is end-to-end as test data is generated and tracked from creation to consumption. Although the volume of active monitoring traffic is much higher than passive it is fully adjustable because it is controlled by the monitoring system. Stanford University points out that active monitoring is best for the emulation of scenarios used to ensure Quality of Service (QoS) or Service Level Agreements (SLAs) [5].
2.1
SNMP
Simple Network Management Protocol is the easiest passive monitoring technique to use because most devices support it out of the box. SNMP follows defined standards that are controlled by the Internet Engineering Taskforce (IETF) and the IEEE. SNMP uses a manager/agent architecture. The monitoring system would host the manager while all SNMP enabled devices would run a background agent to gather information.
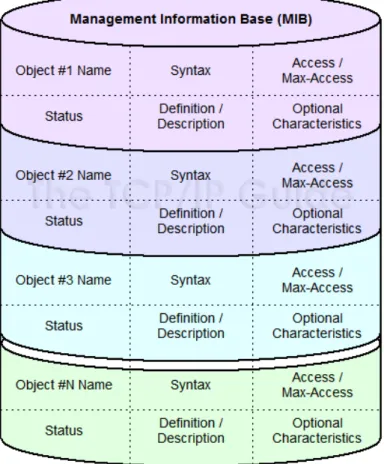
At the core SNMP is a set of commands and a hierarchal collection of enabled devices called the Management Information Base (MIB). The MIB contains unique object identifiers
Network Monitoring As a Layer of Security Page 9
(OIDs) used to identify and store and retrieve information about the devices. Figure 4 represents the MIB structure and shows how data about each object is stored [6].
Network Monitoring As a Layer of Security Page 10
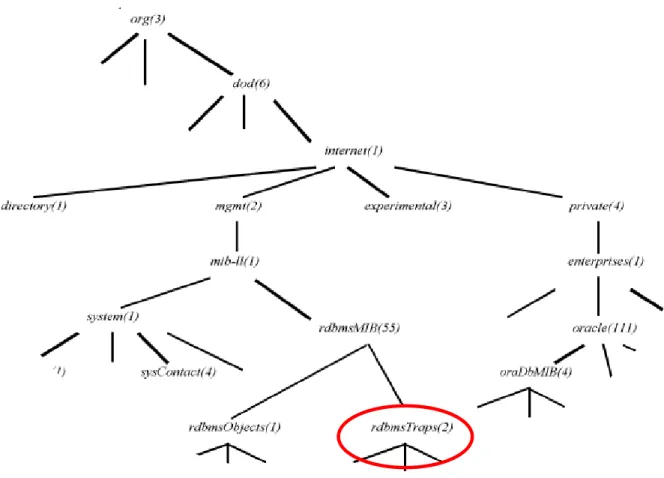
Figure 5 represents the MIB – Object hierarchy of the Oracle Relational Database Management System (RDBMS). Objects that support the trapping of events would be located under 3.6.1.2.1.55.2 (rdbmsTraps).
Network Monitoring As a Layer of Security
The manager polls each agent using
SNMP also supports setting traps. Traps allow the agents to report unexpected events and error conditions to the monitor. Traps could include memory/cp
from an operating system or printer
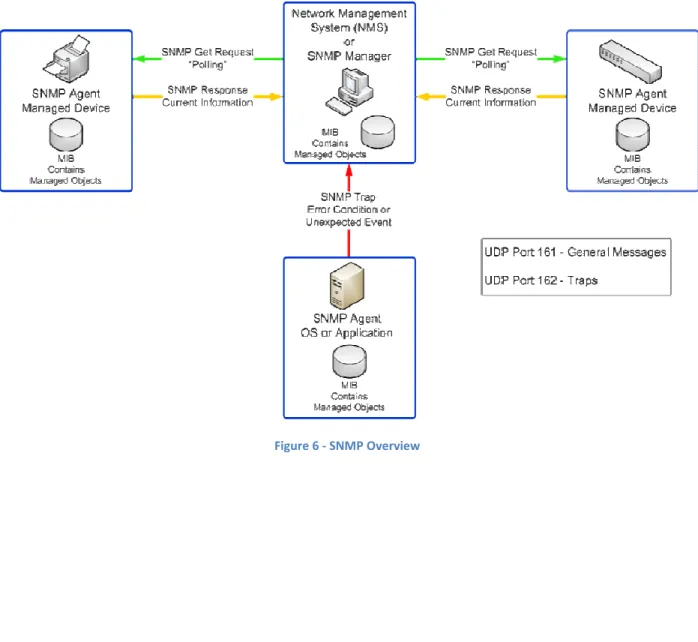
Figure 6 show the flow of SNMP polling requests from the SNMP Manager to various SNMP enabled devices. Polling request
devices can also be configured to send SNMP Traps to the Manager. Trap messages are sen UDP port 162. In the figure below the Server OS or server application is configured to send trap messages.
oring As a Layer of Security
The manager polls each agent using an SNMP request to retrieve current information. setting traps. Traps allow the agents to report unexpected events and error conditions to the monitor. Traps could include memory/cpu thresholds or even notification
printer [7].
show the flow of SNMP polling requests from the SNMP Manager to various SNMP enabled devices. Polling requests are send on UDP port 161. As noted early
devices can also be configured to send SNMP Traps to the Manager. Trap messages are sen In the figure below the Server OS or server application is configured to send trap
Figure 6 - SNMP Overview
Page 11
SNMP request to retrieve current information. setting traps. Traps allow the agents to report unexpected events and error u thresholds or even notifications
show the flow of SNMP polling requests from the SNMP Manager to various noted early, some devices can also be configured to send SNMP Traps to the Manager. Trap messages are sent on In the figure below the Server OS or server application is configured to send trap
Network Monitoring As a Layer of Security Page 12
2.2
Other Passive Techniques
Other common passive monitoring techniques include RMON, NetFlow/JFlow, and the use of traffic sniffers. RMON is a special form of SNMP that uses a specific MIB. RMON is not supported by every SNMP enabled device because it requires more expensive hardware. More expensive hardware provides more CPU cycles and more memory compared to standard SNMP enabled devices. The RMON architecture consists of a monitor console and probes.
NetFlow is another effective way to monitor the network. NetFlow was developed by CISCO Systems and uses collector/probe architecture to monitoring traffic flow. Juniper networks created a similar version called JFlow. Although very useful, these flow based monitoring techniques are proprietary and not supported by all devices.
Network traffics sniffers are the last technique that will be discussed in this paper. Traffic sniffers like Wireshark record real-time network packets and display results for analysis. By using a traffic sniffer one can determine exactly what network traffic is being sent, what ports are being used, who the intended destination is, and what is in the payload.
Network Monitoring As a Layer of Security Page 13
3
Monitoring Solutions
When selecting a monitoring system for your network infrastructure there are many solutions available. Commercial solutions come in a variety of forms: hardware appliances, software solutions, and even outsourced service solutions. Commercial products range from thousands of dollars to hundreds of thousands of dollars. The following are some of the most common commercial monitoring solutions with dollar signs to represent very high level price comparisons: HP OpenView - $$$ CISCOWorks - $$$ SolarWinds Orion $$ OpManager - $ WhatsUpGold - $ PRTG - $
Besides commercial products there are many open source products available as well. Open source products are innovative, inexpensive, and numerous. Because open source products are free, support is limited or non-existent. They are often much more difficult to install and configure. Open source provides greater flexibility at the cost of easy configuration. The more customization required the more coding and configuration must be done. Two common open source monitoring products are Nagios and MRTG. Nagios was chosen for the lab portion of this project and is demonstrated in Section 4. Wikipedia has a good side by side comparison of common networking monitoring systems [8].
Network Monitoring As a Layer of Security Page 14
4
Nagios
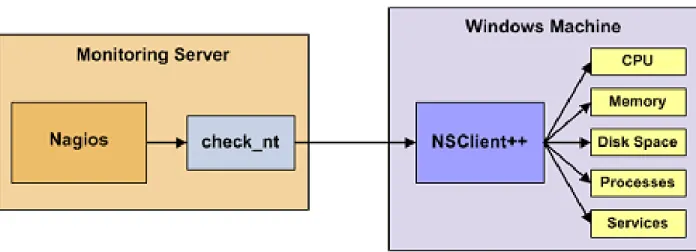
Nagios was chosen as the monitoring system to demonstrate in this paper for two reasons: first Nagios is free under the GPL license and second Nagios came highly recommended from co-workers and other network security professionals. The current release is version 3.1.2 and will be deployed on the latest Ubuntu Linux Desktop operating system. Network services like smtp, http, dns, and ftp can be easily monitored without the use of client add-ons; however, additional information can be retrieve from Windows client devices with the use and the Nagios client NSClient++.
The Nagios program consists of three elements or parts: first the core application or the monitor system, second the plug-ins that support the gathering of information (Figure 7 represents how the NSClient++ hooks into a windows client to retrieve more detailed information), and third add-ons which include things like Perl scripts and MIB object information for monitoring specific devices [9].
Nagios Elements
Core
Plug-ins – NSClient++ [10]
Add-ons – Perl Scripts/MIB Objects
Network Monitoring As a Layer of Security Page 15
4.1
Preparation
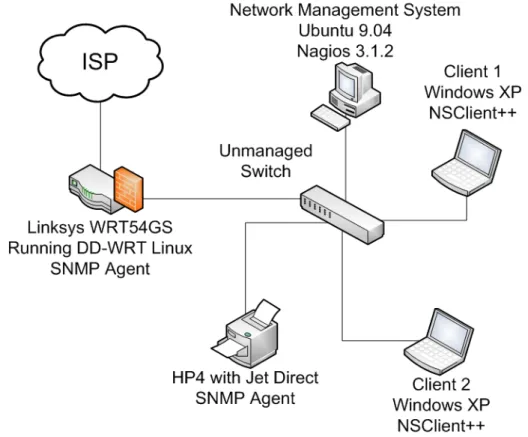
In preparation for the Nagios 3.1.2 demonstration a sample test bed environment was created that would allow for the monitoring of four client devices. Figure 8 shows the actual environment with the planned software for each device.
The Test Bed Lab Environment for Nagios consisted of the following devices:
1 Pentium 4 Ubuntu Linux Desktop for hosting the Nagios Network Management/Monitoring System
2 Pentium 4 Windows XP Laptops for testing the NSClient++ Plug-in
1 Networked Printer (with HP Jet direct Card) for testing SNMP traps
1 Linksys WRT54GS Router (with modified DD-WRT Linux Firmware allowing SNMP) for testing general SNMP polling
1 Unmanaged Network Switch for extra connectivity
The preparation phase ended once Ubuntu Desktop 9.04 was successful installed on the desktop machine.
Network Monitoring As a Layer of Security Page 16
4.2
Installation
The installation of Nagios required the following steps on Ubuntu:
Install Apache 2
Install PHP 5
Install GCC Compiler and development libraries
Install GD graphics library v2 for drawing
Create of Nagios User/Groups/Permissions
Download Nagios 3.1.2 source code and Plug-in Source code
Compile and Install Nagios
Basic server configuration
Compile and install plug-in source code
The Nagios/Ubuntu quick start guide was followed for most of this installation; however, the guide was written for Ubuntu 6.10 so some changes are reflected below. For more information on the Nagios Quick Start installation guide visit http://nagios.sourceforge.net [11].
Apache 2 Install
jeff@jeff-desktop:~$ sudo apt-get install apache2 Reading package lists... Done
Building dependency tree Reading state information... Done
The following packages were automatically installed and are no longer required: linux-headers-2.6.28-11 linux-headers-2.6.28-11-generic
Use 'apt-get autoremove' to remove them. The following extra packages will be installed:
apache2-mpm-worker apache2-utils apache2.2-common libapr1 libaprutil1 libmysqlclient15off libpq5 mysql-common
Suggested packages:
apache2-doc apache2-suexec apache2-suexec-custom The following NEW packages will be installed:
apache2 apache2-mpm-worker apache2-utils apache2.2-common libapr1 libaprutil1 libmysqlclient15off libpq5 mysql-common
0 upgraded, 9 newly installed, 0 to remove and 0 not upgraded. Need to get 3607kB of archives.
After this operation, 10.3MB of additional disk space will be used. Do you want to continue [Y/n]? y
PHP 5 Install
jeff@jeff-desktop:~$ sudo apt-get install libapache2-mod-php5 Reading package lists... Done
Network Monitoring As a Layer of Security Page 17 Reading state information... Done
The following packages were automatically installed and are no longer required: linux-headers-2.6.28-11 linux-headers-2.6.28-11-generic
Use 'apt-get autoremove' to remove them. The following extra packages will be installed: apache2-mpm-prefork php5-common Suggested packages:
php-pear
The following packages will be REMOVED: apache2-mpm-worker
The following NEW packages will be installed:
apache2-mpm-prefork libapache2-mod-php5 php5-common 0 upgraded, 3 newly installed, 1 to remove and 0 not upgraded. Need to get 3091kB of archives.
After this operation, 6287kB of additional disk space will be used. Do you want to continue [Y/n]? y
G++ Compiler and Dependencies Install jeff@jeff-desktop:~$ sudo apt-get install build-essential Reading package lists... Done
Building dependency tree Reading state information... Done
The following packages were automatically installed and are no longer required: linux-headers-2.6.28-11 linux-headers-2.6.28-11-generic
Use 'apt-get autoremove' to remove them. The following extra packages will be installed: dpkg-dev g++ g++-4.3 libstdc++6-4.3-dev patch Suggested packages:
debian-keyring g++-multilib g++-4.3-multilib gcc-4.3-doc libstdc++6-4.3-dbg libstdc++6-4.3-doc diff-doc
The following NEW packages will be installed:
build-essential dpkg-dev g++ g++-4.3 libstdc++6-4.3-dev patch 0 upgraded, 6 newly installed, 0 to remove and 0 not upgraded. Need to get 6270kB of archives.
After this operation, 21.4MB of additional disk space will be used. Do you want to continue [Y/n]? y
GD Graphics Library ver. 2 Package
jeff@jeff-desktop:~$ sudo apt-get install libgd2-xpm-dev Reading package lists... Done
Building dependency tree Reading state information... Done
The following packages were automatically installed and are no longer required: linux-headers-2.6.28-11 linux-headers-2.6.28-11-generic
Use 'apt-get autoremove' to remove them. The following extra packages will be installed:
Network Monitoring As a Layer of Security Page 18 libpng12-dev libpthread-stubs0 libpthread-stubs0-dev libx11-dev libxau-dev
libxcb1-dev libxdmcp-dev libxpm-dev x11proto-core-dev x11proto-input-dev x11proto-kb-dev xtrans-dev zlib1g-dev
Suggested packages: libgd-tools
The following packages will be REMOVED: libgd2-noxpm
The following NEW packages will be installed:
libexpat1-dev libfontconfig1-dev libfreetype6-dev libgd2-xpm libgd2-xpm-dev libjpeg62-dev libpng12-dev libpthread-stubs0 libpthread-stubs0-dev
libx11-dev libxau-dev libxcb1-dev libxdmcp-dev libxpm-dev x11proto-core-dev x11proto-input-dev x11proto-kb-dev xtrans-dev zlib1g-dev
0 upgraded, 19 newly installed, 1 to remove and 0 not upgraded. Need to get 4567kB of archives.
After this operation, 14.6MB of additional disk space will be used. Do you want to continue [Y/n]? y
Create User/Groups/Permissions jeff@jeff-desktop:~$ sudo -s
root@jeff-desktop:~# /usr/sbin/useradd -m -s /bin/bash nagios root@jeff-desktop:~# passwd nagios
Enter new UNIX password: Retype new UNIX password:
passwd: password updated successfully root@jeff-desktop:~#
<<Note I entered cs691 as the password>> root@jeff-desktop:~# /usr/sbin/groupadd nagcmd
root@jeff-desktop:~# /usr/sbin/usermod -a -G nagcmd nagios root@jeff-desktop:~# /usr/sbin/usermod -a -G nagcmd www-data
Download Nagios Source Code root@jeff-desktop:~# mkdir ~/downloads
root@jeff-desktop:~/downloads# wget http://prdownloads.sourceforge.net/sourceforge/nagios/nagios-3.1.2.tar.gz
--2009-07-21 21:27:18-- http://prdownloads.sourceforge.net/sourceforge/nagios/nagios-3.1.2.tar.gz Resolving prdownloads.sourceforge.net... 216.34.181.59
Connecting to prdownloads.sourceforge.net|216.34.181.59|:80... connected. HTTP request sent, awaiting response... 302 Found
Location: http://softlayer.dl.sourceforge.net/sourceforge/nagios/nagios-3.1.2.tar.gz [following] --2009-07-21 21:27:18-- http://softlayer.dl.sourceforge.net/sourceforge/nagios/nagios-3.1.2.tar.gz Resolving softlayer.dl.sourceforge.net... 74.86.229.28
Connecting to softlayer.dl.sourceforge.net|74.86.229.28|:80... connected. HTTP request sent, awaiting response... 200 OK
Length: 3172982 (3.0M) [application/x-gzip] Saving to: `nagios-3.1.2.tar.gz'
Network Monitoring As a Layer of Security Page 19 2009-07-21 21:27:39 (152 KB/s) - `nagios-3.1.2.tar.gz' saved [3172982/3172982]
root@jeff-desktop:~/downloads# wget http://prdownloads.sourceforge.net/sourceforge/nagiosplug/nagios-plugins-1.4.13.tar.gz
--2009-07-21 21:32:33-- http://prdownloads.sourceforge.net/sourceforge/nagiosplug/nagios-plugins-1.4.13.tar.gz Resolving prdownloads.sourceforge.net... 216.34.181.59
Connecting to prdownloads.sourceforge.net|216.34.181.59|:80... connected. HTTP request sent, awaiting response... 302 Found
Location: http://softlayer.dl.sourceforge.net/sourceforge/nagiosplug/nagios-plugins-1.4.13.tar.gz [following] --2009-07-21 21:32:33-- http://softlayer.dl.sourceforge.net/sourceforge/nagiosplug/nagios-plugins-1.4.13.tar.gz Resolving softlayer.dl.sourceforge.net... 74.86.229.28
Connecting to softlayer.dl.sourceforge.net|74.86.229.28|:80... connected. HTTP request sent, awaiting response... 200 OK
Length: 2279556 (2.2M) [application/x-gzip] Saving to: `nagios-plugins-1.4.13.tar.gz'
100%[======================================>] 2,279,556 131K/s in 15s 2009-07-21 21:32:48 (150 KB/s) - `nagios-plugins-1.4.13.tar.gz' saved [2279556/2279556] root@jeff-desktop:~/downloads#
root@jeff-desktop:~/downloads# tar xzf nagios-3.1.2.tar.gz
Compile and Install
root@jeff-desktop:~/downloads# cd nagios-3.1.2/ root@jeff-desktop:~/downloads/nagios-3.1.2# ls base configure.in install-sh nagios.spec t cgi contrib LEGAL OutputTrap.pm tap Changelog daemon-init.in LICENSE p1.pl THANKS common functions Makefile.in pkginfo.in t-tap
config.guess html make-tarball README update-version config.sub include mkpackage sample-config UPGRADING configure INSTALLING module subst.in xdata
root@jeff-desktop:~/downloads/nagios-3.1.2# ./configure --with-command-group=nagcmd …
** Configuration summary for nagios 3.1.2 06-23-2009 ***: General Options:
---
Nagios executable: nagios Nagios user/group: nagios,nagios Command user/group: nagios,nagcmd Embedded Perl: no
Network Monitoring As a Layer of Security Page 20
Install ${prefix}: /usr/local/nagios Lock file: ${prefix}/var/nagios.lock
Check result directory: ${prefix}/var/spool/checkresults Init directory: /etc/init.d
Apache conf.d directory: /etc/apache2/conf.d Mail program: /bin/mail
Host OS: linux-gnu Web Interface Options: ---
HTML URL: http://localhost/nagios/ CGI URL: http://localhost/nagios/cgi-bin/ Traceroute (used by WAP):
Review the options above for accuracy. If they look okay, type 'make all' to compile the main program and CGIs.
…
<<Compile the Nagios source code. make all
…
<<Install binaries, init script, sample config files and set permissions on the external command directory.>> make install
make install-init make install-config
make install-commandmode
The Nagios installation guide suggests a few configuration changes before starting the server.
<<Edit the /usr/local/nagios/etc/objects/contacts.cfg config file and change the email address associated with the nagiosadmin contact definition to the address you'd like to use for receiving alerts. >>
vi /usr/local/nagios/etc/objects/contacts.cfg
<<Install the Nagios web config file in the Apache conf.d directory. >> make install-webconf
<<Create a nagiosadmin account for logging into the Nagios web interface. This will be password you will use to log into the nagiosadmin webpage.>>
htpasswd -c /usr/local/nagios/etc/htpasswd.users cs691password <<Restart Apache to make the new settings take effect. >> /etc/init.d/apache2 reload
Compile and Install Plugin-Source Code
cd ~/downloads
tar xzf nagios-plugins-1.4.13.tar.gz cd nagios-plugins-1.4.13
Network Monitoring As a Layer of Security Page 21 ./configure --with-nagios-user=nagios --with-nagios-group=nagios
… make … make install … Start Nagios
<<Configure Nagios to automatically start when the system boots>> ln -s /etc/init.d/nagios /etc/rcS.d/S99nagios
<<Verify the sample Nagios configuration files>>
/usr/local/nagios/bin/nagios -v /usr/local/nagios/etc/nagios.cfg <<If there are no errors, start Nagios>>
/etc/init.d/nagios start
Other Very Helpful Commands
Before starting the server verify that the devices that are being monitoring are configured properly by running the following:
/usr/local/nagios/bin/nagios -v /usr/local/nagios/etc/nagios.cfg
This command restarts the server after you make changes to configuration files:
sudo /etc/init.d/nagios restart
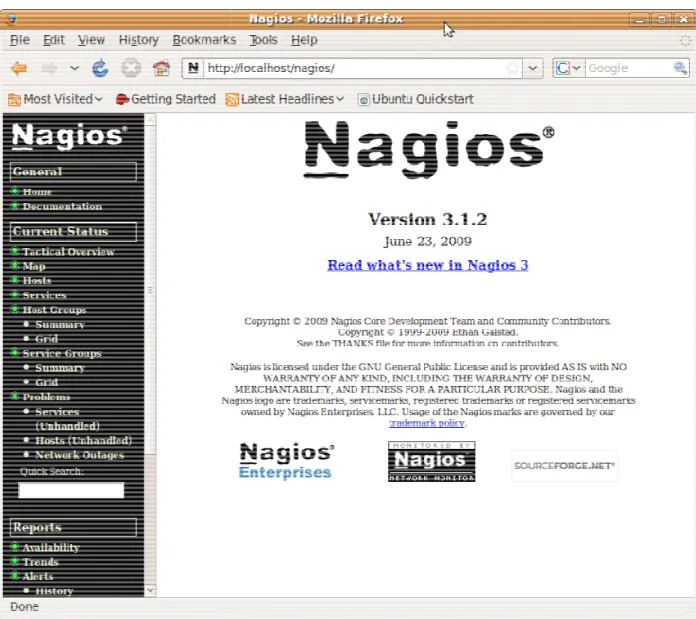
Open Web Browser and go to http://localhost/nagios/ Username: nagiosadmin
Password: cs691 <<or whatever password you used earlier>> Figure 9 shows the Nagios portal as viewed upon login.
Network Monitoring As a Layer of Security
4.3
Configuration
Section 4.3 describes how to add devices for Nagios to monitor. file resides in /usr/local/nagios/etc/nagios.cfg. The main nag
object configuration files within the objects directory.
4.3.1 Windows XP Clients
Download and install NSClient++ runs the app in the system tray
(Note: I experienced problems with running commands:
oring As a Layer of Security
Figure 9 - Nagios Portal
Section 4.3 describes how to add devices for Nagios to monitor. The main configuration file resides in /usr/local/nagios/etc/nagios.cfg. The main nagios.cfg file points to several other object configuration files within the objects directory.
NSClient++ on workstations [11]. There is an install option that app in the system tray. Ignore this option and run the regular “/install
problems with running in the system tray). The following are basic
Page 22
The main configuration ios.cfg file points to several other
here is an install option that /install” command The following are basic
Network Monitoring As a Layer of Security Page 23 NSClient++ /install NSClient++ /uninstall NSClient++ /start NSClient++ /stop NSClient++ /test
Note: Firewall port 12489 must be open – Refer to the NSClient++ users manual for setting up client authentication. For the sake of simplicity this step was not included [11].
On Nagios server add the clients to the config files - edit the /usr/local/nagios/etc/objects/windows.cfg ############################################################################## ############################################################################### # # HOST DEFINITIONS # ############################################################################### ############################################################################### # Define a host for the Windows machine we'll be monitoring
# Change the host_name, alias, and address to fit your situation
define host{
use windows-server;
host_name client1;
alias Dell Laptop;
address 10.0.0.103; } define host{ use windows-server; host_name client2; alias HP Laptop; address 10.0.0.102; } ############################################################################### ############################################################################### #
# HOST GROUP DEFINITIONS #
############################################################################### ############################################################################### # Define a hostgroup for Windows machines
# All hosts that use the windows-server template will automatically be a member of this group
define hostgroup{
hostgroup_name windows-servers ; The name of the hostgroup alias Windows Servers ; Long name of the group
Network Monitoring As a Layer of Security Page 24 } ############################################################################### ############################################################################### # # SERVICE DEFINITIONS # ############################################################################### ############################################################################### # Create a service for monitoring the version of NSCLient++ that is installed
# Change the host_name to match the name of the host you defined above
define service{
use generic-service
host_name client2
service_description NSClient++ Version
check_command check_nt!CLIENTVERSION }
define service{
use generic-service
host_name client1
service_description NSClient++ Version
check_command check_nt!CLIENTVERSION }
# Create a service for monitoring the uptime of the server
# Change the host_name to match the name of the host you defined above
define service{ use generic-service host_name client2 service_description Uptime check_command check_nt!UPTIME } define service{ use generic-service host_name client1 service_description Uptime check_command check_nt!UPTIME }
# Create a service for monitoring CPU load
# Change the host_name to match the name of the host you defined above
define service{
use generic-service
host_name client2
service_description CPU Load
Network Monitoring As a Layer of Security Page 25 }
define service{
use generic-service
host_name client1
service_description CPU Load
check_command check_nt!CPULOAD!-l 5,80,90 }
# Create a service for monitoring memory usage
# Change the host_name to match the name of the host you defined above
define service{
use generic-service
host_name client2
service_description Memory Usage
check_command check_nt!MEMUSE!-w 80 -c 90 }
define service{
use generic-service
host_name client1
service_description Memory Usage
check_command check_nt!MEMUSE!-w 80 -c 90 }
# Create a service for monitoring C:\ disk usage
# Change the host_name to match the name of the host you defined above
define service{
use generic-service
host_name client2
service_description C:\ Drive Space
check_command check_nt!USEDDISKSPACE!-l c -w 80 -c 90 }
define service{
use generic-service
host_name client1
service_description C:\ Drive Space
check_command check_nt!USEDDISKSPACE!-l c -w 80 -c 90 }
# Create a service for monitoring the Explorer.exe process
# Change the host_name to match the name of the host you defined above
define service{
use generic-service
host_name client2
service_description Explorer
check_command check_nt!PROCSTATE!-d SHOWALL -l Explorer.exe }
Network Monitoring As a Layer of Security Page 26 define service{
use generic-service
host_name client1
service_description Explorer
check_command check_nt!PROCSTATE!-d SHOWALL -l Explorer.exe }
4.3.2 Linksys WRT54GS Router
Add custom defined commands for monitoring SNMP on Linksys Router (CPU and Ram Check). To add the commands edit the /usr/local/nagios/etc/objects/command.cfg and add the following:
define command{
command_name check_linksys_cpu
command_line $USER1$/check_snmp -H $HOSTADDRESS$ C public o 1.3.6.1.4.1.2021.10.1.5.1 u % -w 60 -c 70
}
define command{
command_name check_linksys_ram
command_line $USER1$/check_snmp -H $HOSTADDRESS$ -C public -o 1.3.6.1.2.1.25.2.3.1.6.101 -u kb -w 27000 -c 28000 }
Next edit the /use/local/nagios/etc/objects/switch.cfg and add the following lines:
############################################################################## ############################################################################### # # HOST DEFINITIONS # ############################################################################### ############################################################################### # Define the switch that we'll be monitoring
define host{
use generic-switch ; Inherit default values from a template
host_name dd-wrt ; The name we're giving to this switch alias Linksys WRT54GS ; A longer name associated with the switch address 10.0.0.1 ; IP address of the switch
hostgroups switches ; Host groups this switch is associated with }
############################################################################### ###############################################################################
Network Monitoring As a Layer of Security Page 27 #
# HOST GROUP DEFINITIONS #
############################################################################### ############################################################################### # Create a new hostgroup for switches
define hostgroup{
hostgroup_name switches ; The name of the hostgroup alias Network Switches ; Long name of the group } ############################################################################### ############################################################################### # # SERVICE DEFINITIONS # ############################################################################### ############################################################################### # Create a service to PING to switch
define service{
use generic-service ; Inherit values from a template
host_name dd-wrt ; The name of the host the service is associated with service_description PING ; The service description
check_command check_ping!200.0,20%!600.0,60% ; The command used to monitor the service normal_check_interval 5 ; Check the service every 5 minutes under normal conditions retry_check_interval 1 ; Re-check the service every minute until its final/hard state is determined
}
# Monitor uptime via SNMP
define service{
use generic-service ; Inherit values from a template
host_name dd-wrt
service_description Uptime
check_command check_snmp!-C public -o sysUpTime.0 }
define service{
use generic-service
host_name dd-wrt
service_description Check Linksys CPU
check_command check_linksys_cpu }
define service{
use generic-service
host_name dd-wrt
Network Monitoring As a Layer of Security
check_command check_linksys_ram
}
4.3.3 HP LaserJet 4
Note: You must enable SNMP on
Lesson Learned: Monitoring printers requires reinstallation of the Nagios
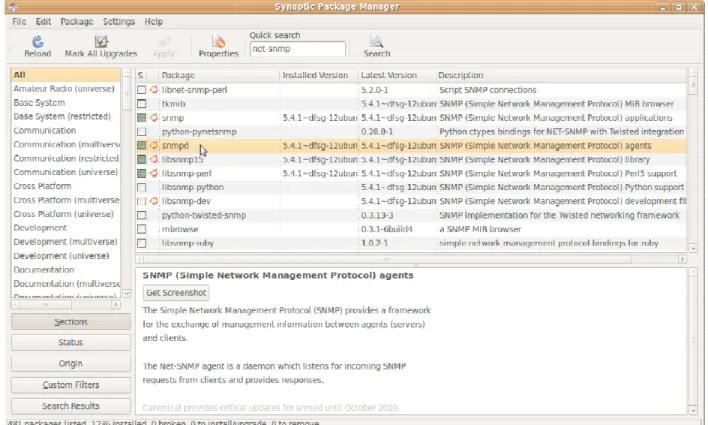
Plug-Figure 10 shows adding the net-snmp libraries using the synaptic package manager. & snmpd.
Once the net-snmp packages/libraries are installed and Nagios
scripts for monitoring printers will be in the /usr/local/nagios/etc/objects/printer.cfg. Edit printer.cfg and add the following information:
######################################
############################################################################### #
# HOST DEFINITIONS #
oring As a Layer of Security check_linksys_ram
Note: You must enable SNMP on the printer first.
Monitoring printers requires a missing net-snmp package/library -in scripts.
snmp libraries using the synaptic package manager.
Figure 10 - Synaptic Package Manager
snmp packages/libraries are installed and Nagios plug-ins reinstalled scripts for monitoring printers will be in the /usr/local/nagios/etc/objects/printer.cfg. Edit printer.cfg and add the following information:
############################################################################### ###############################################################################
Page 28
library and
snmp libraries using the synaptic package manager. Add snmp
reinstalled, the scripts for monitoring printers will be in the /usr/local/nagios/etc/objects/printer.cfg. Edit
Network Monitoring As a Layer of Security Page 29 ###############################################################################
############################################################################### # Define a host for the printer we'll be monitoring
# Change the host_name, alias, and address to fit your situation
define host{
use generic-printer ; Inherit default values from a template
host_name JMHP4 ; The name we're giving to this printer alias HP LaserJet 4 ; A longer name associated with the printer
address 10.0.0.135 ; IP address of the printer
hostgroups network-printers ; Host groups this printer is associated with }
############################################################################### ############################################################################### #
# HOST GROUP DEFINITIONS #
############################################################################### ############################################################################### # A hostgroup for network printers
define hostgroup{
hostgroup_name network-printers ; The name of the hostgroup alias Network Printers ; Long name of the group } ############################################################################### ############################################################################### # # SERVICE DEFINITIONS # ############################################################################### ############################################################################### # Create a service for monitoring the status of the printer
# Change the host_name to match the name of the host you defined above
# If the printer has an SNMP community string other than "public", change the check_command directive to reflect that
define service{
use generic-service ; Inherit values from a template
host_name JMHP4 ; The name of the host the service is associated with
service_description Printer Status ; The service description
check_command check_hpjd!-C public ; The command used to monitor the service normal_check_interval 10 ; Check the service every 10 minutes under normal conditions
retry_check_interval 1 ; Re-check the service every minute until its final/hard state is determined }
# Create a service for "pinging" the printer occassionally. Useful for monitoring RTA, packet loss, etc.
define service{
Network Monitoring As a Layer of Security Page 30 host_name JMHP4 service_description PING check_command check_ping!3000.0,80%!5000.0,100% normal_check_interval 10 retry_check_interval 1 }
4.4
Monitoring
Figure 11 show the Nagios 3.1.2 tactical overview. The overview screen shows a summary of all devices and provides an indication of overall enterprise health. Summary categories include number of services, active hosts, flap detection, notifications, events, active, and passive checks.
Network Monitoring As a Layer of Security Page 31
Figure 12 shows current status by group. This screen offers a “drill down” view from the tactical overview where every monitored service is assigned to a category based on the Nagios configuration files.
Network Monitoring As a Layer of Security Page 32
Figure 13 details each monitored service status by host or device.
Figure 13 – Service Status
Figure 14 shows an SNMP trap that was caught when the printer tray was removed from the HP LaserJet printer.
Network Monitoring As a Layer of Security Page 33
4.5
Recommendations
This paper serves as an introduction to network monitoring because there is much more to learn regarding the topic. Before deploying a Nagios system in a production environment additional security measures must be taken into consideration. For example HTTP/SSL must be enabled. For additional information regarding security and production deployment visit http://nagios.sourceforge.net/docs/3_0/cgisecurity.html.
5
Conclusion
Whether you work at a large company with an established yearly budget for network enhancements or a struggling startup, network monitoring makes sense as an added layer of protection. In large companies it makes sense to implement a commercial network monitoring system as opposed to an open source solution. Commercial products tend to be easier to configure and come with support agreements. Small to medium size companies with a limited budget or companies that need the total control and the ability to customize (via source code) should not be afraid to consider Nagios or other open source products.
Overall Nagios is a very powerful and flexible monitoring system; however, it requires much more in-depth installation and configuration when compared to some of the commercial of the shelf products such as WhatsUpGold. Additionally, Nagios may be much more difficult and even require custom scripting to support specific devices.
As general guidance to all, it is strongly recommended that every organization implement a monitoring system not only for the benefits of simplifying network administration but as an added layer of security with direct insight into the health of the system. In the end, as with any other investment in technology, justification will be based on cost benefit analysis and the calculated return on investment. The difficult part of this decision is trying to placing a price on the hypothetical costs savings in the event of an outage or cyber attack. When we view the costs of network monitoring in the same light as our willingness to pay for medical check-ups and preventative medicine for the physical body, our perspective of it importance is brought into the light. Having notification of current and potential problems is a guaranteed way to save time and money.
Network Monitoring As a Layer of Security Page 34
6
References
[1] CIO Magazine (5 Jun 2009) Network Monitoring Definition and Solutions. Retrieved Jul 13, 2009 from http://www.cio.com/article/133700/Network_Monitoring_Definition_and_Solutions [2] Ipswitch (14 Nov 2007) White Paper: THE VALUE OF NETWORK MONITORING: Why It’s Essential to Know Your Network. Retrieved Jul 29, 2009 from
http://www.whatsupgold.com/resources/whitepapers/Value_of_Network_Monitoring.pdf [3] Landis +Gyr (2009) White Paper: Securing the Smart Grid: Gridstream Security Architecture. Retrieved June 6, 2009 from http://www.landisgyr.com/en/pub/home.cfm
[4] EMS Satcom (2008) Blue Force Tracking: System Nuances and EMS SATCOM’s Contributions. Retrieve Jul 20, 2009 from http://www.emssatcom.com/newsletters/2008/Nov/bus2.aspx [5] Stanford SLAC (11 Mar 2001) Passive vs. Active Monitoring. Retrieved Jul 13, 2009 from http://www.slac.stanford.edu/comp/net/wan-mon/passive-vs-active.html
[6] TCPIP Guide (?) SNMP MIB Graphic. Retrieved Jul 29, 2009 from www.tcpipguide.com [7] HP Website
[8] Wikipedia (27 Jul 2009) Comparison of network monitoring systems. Retrieved Jul 29, 2009 from http://en.wikipedia.org/wiki/Comparison_of_network_monitoring_systems
[9] Nagios (2009) Nagios. Retrieved July, 13 2009 from http://www.nagios.org/
[10] NSClient++ () Installing NSClient++. Retrieved July 23, 2009 from http://nsclient.org/nscp/ [11] Nagios () Nagios Quickstart Installation Guides. Retrieve July 23, 2009 from
![Figure 2 - Smart Grid Monitoring represents a Landis+Gyr Advanced Metering Infrastructure (AMI) smart grid deployment [3]](https://thumb-us.123doks.com/thumbv2/123dok_us/259100.2526466/6.918.140.824.489.968/figure-monitoring-represents-landis-advanced-metering-infrastructure-deployment.webp)