Journal of Gerontology:PSYCHOLOGICAL SCIENCES Copyright 2002 by The Gerontological Society of America
2002, Vol. 57B, No. 6, P474–P482
P474
SPECIAL SECTION
Longitudinal Selectivity in Aging Populations:
Separating Mortality-Associated Versus Experimental
Components in the Berlin Aging Study (BASE)
Ulman Lindenberger, Tania Singer, and Paul B. Baltes
Max Planck Institute for Human Development, Berlin, Germany.
The authors examined 3.7-year selectivity in the Berlin Aging Study by comparing the T1 parent sample (N
516) with the T3 sample (N 206). Selectivity was partitioned into a mortality-associated component, reflecting the degree to which individuals still alive at T3 (T3 survivors, N 313) differ from the T1 parent sample (N
516) from which they originated, and an experimental component, reflecting the degree to which the T3 sample (N 206) differed from T3 survivors (N 313). Across 48 variables representing medical, sensorimotor, cogni-tive, personality-related, and socioeconomic domains, the mortality-associated component accounted for 64% of total selectivity, and the experimental component for 36% (0.18 vs 0.10 SD units; t 7.20, p .01). Except for age and intelligence, experimental selectivity effects regarding means and prevalence rates were generally small. Par-titioning selectivity into mortality-associated and experimental components is a useful tool in the longitudinal study of aging populations.
N longitudinal investigations, one common threat to gen-eralizability is sample selectivity, or nonrandom sample attrition. Sample attrition is called nonrandom when vari-ables predicting attrition are related to varivari-ables of interest. Evidence from earlier investigations indicates that such se-lectivity occurs. For instance, individuals who participate in longitudinal studies for a longer period of time tend to be younger, healthier (McArdle, Hamagami, Elias, & Robbins, 1991), of higher intelligence (Baltes, Schaie, & Nardi, 1971), and of a higher social class (Powers & Bultena, 1972) than individuals who participate for shorter periods of time.
Sample selectivity compromises the generalizability of results, especially if substantive analyses are restricted to individuals observed at all measurement occasions (for a general treatment, see Baltes, Reese, & Nesselroade, 1988; Diggle, Liang, & Zeger, 1994). In the case of aging popula-tions, generalizability can be impaired in two major ways. First, the average level of functional competence is overesti-mated if individuals with lower levels of functioning are less likely to be observed at all measurement occasions than in-dividuals with higher levels of functioning. Second, the av-erage amount of negative longitudinal change is underesti-mated if individuals with greater functional decline are less likely to be observed at all measurement occasions than in-dividuals with less decline, stability, or gain (Siegler & Bot-winick, 1979). In that case, the modal shape of observed longitudinal change is a biased representation of the full spectrum of longitudinal change trajectories at the popula-tion level, which, for instance, may include a greater propor-tion of precipitous decline patterns (e.g., Baltes & Labouvie, 1973, p. 174).
In longitudinal investigations of populations with mortal-ity rates greater than zero, selectivmortal-ity can originate from two different sources (cf. Baltes & Labouvie, 1973). First, indi-viduals with higher mortality risks may differ on relevant
at-tributes from individuals with lower mortality risks; hence-forth, we refer to this kind of selectivity as mortality-associated. Second, individuals who are willing and able to participate in data collection may differ on relevant at-tributes from those who are unwilling or unable to do so but are also still alive; that kind of selectivity we designate as experimental. Mortality-associated selectivity gradually trans-forms the composition of the population under study and is best understood as a population process. Experimental se-lectivity captures the inability of the experimenter to assign an equal chance to all surviving individuals to continue par-ticipation in the study.
Mortality-Associated Versus Experimental Selectivity: Introduction of Terminology
Mortality-associated selectivity.—With respect to differ-ences in means, the magnitude of mortality-associated se-lectivity can be computed as follows:
Mortality-associated selectivity
(MsurvivorsMparent sample)/SDparent sample, (1) where Msurvivors is the mean level of performance among in-dividuals who are alive at a given measurement occasion, Mparent sample is the mean level of performance of the original (full) sample, and SDparent sample is its standard deviation. The formula indicates the mean difference between the survivors and the parent sample in the standard deviation units of the parent sample. The same formula can also be used with di-chotomous variables to quantify experimental selectivity effects on prevalence rates.
Mortality-associated selectivity can be further subdivided into an age-linked and an age-orthogonal component (which does not imply that the causal factors governing the two components have to be different). If the nature of selective
I
SELECTIVITY IN AGING POPULATIONS P475
mortality was entirely age linked, then individuals of the same age but different functional status would not differ in mortality risk. Under such conditions, mortality-associated selectivity would be zero after individual differences in age were controlled for. In contrast, any remaining association between mortality risk and a given variable would indicate that mortality also tends to be selective with respect to this variable among individuals of the same age. One possible way to examine this issue is to examine the magnitude of mortality-associated selectivity before versus after regress-ing the variables of interest on chronological age.
Experimental selectivity.—Experimental selectivity, in the narrow sense adopted in this article, refers to an associa-tion between phenomena of interest and the likelihood of participating in the study among individuals who are still alive. With respect to mean differences, the magnitude of experimental selectivity can be computed as follows:
Experimental selectivity
(MselectMsurvivors)/SDparent sample, (2) where Mselect is the mean level of performance among indi-viduals who were measured at a given occasion, Msurvivors is the mean level of performance among individuals still alive at this occasion, and SDparent sample is the standard deviation for the original sample. As was true for mortality-associated selectivity, experimental selectivity can be subdivided into an age-linked and an age-orthogonal part. The standard de-viation of the parent sample, rather than that of the survi-vors, is used to norm mortality-associated and experimental components to the same metric. As a consequence, total se-lectivity can be defined as the sum of mortality-associated and experimental components (see following text).
Total selectivity.—Total selectivity designates the extent to which individuals measured at a given occasion differ from their parent sample, for both mortality-associated and experimental reasons. If selection is transitive (cf. Aitkin, 1934), that is, if the survivors are a subsample of the parent sample and if the select sample is a subsample of the survi-vors, then total selectivity is equal to the sum of its mortality-associated and experimental components:
Total selectivity mortality-associated selectivity
experimental selectivity (3) Alternatively, total selectivity can be computed directly as the normed difference between the select sample and the parent sample:
Total selectivity (MselectMparent)/SDparent sample (4)
A numerical example.—The following example refers
to the mean age at the first measurement occasion (T1) for three nested samples. These three samples also form the em-pirical basis of the analyses reported in this article. First, the T1 parent sample refers to all individuals who participated in the Intensive Protocol of the first measurement occasion of the Berlin Aging Study (BASE; N 516, mean age at T1 84.9 years, SD 8.7; see Appendix, Note 1). Second, the T3 survivors refer to all individuals who were still alive at
the time when the Intensive Protocol of the third measure-ment occasion took place, that is, about 3.7 years after T1 (N 313, mean age at T1 81.5 years, SD 7.6). Finally, the T3 sample refers to all individuals who actually partici-pated in the Intensive Protocol of the third measurement oc-casion (N 206, mean age at T1 79.8 years, SD 6.9). Note that the T3 survivors are a subset of the T1 parent sam-ple, and the T3 sample is subset of the T3 survivors. Thus, the relationship among the three samples is nested, or transitive.
For age at T1, mortality-associated selectivity of the T3 sample is computed according to Equation 1:
Mortality-associated selectivity (81.5 84.9)/8.7
0.39 (5) At T1, then, individuals still alive at T3 were 0.39 standard deviation units younger than the T1 parent sample. Experi-mental selectivity is computed according to Equation 2: Experimental selectivity (79.8 81.5)/8.7 0.20 (6) Total selectivity can be computed directly with Equation 4:
Total selectivity (79.8 84.9)/8.7 0.59 (7) Equation 7 indicates that the T3 sample was 0.59 standard deviation units younger than the T1 parent sample. As is easily seen, 0.39 0.20 0.59; that is, total selectiv-ity is the sum of mortalselectiv-ity-associated and experimental se-lectivity, as proposed in Equation 3. This is so (a) because the mean difference in Equation 7 is the sum of the mean differences in Equations 5 and 6, and (b) because the mean dif-ferences of all three equations are normed to the same refer-ence sample (i.e., the parent sample), which is common practice (cf. Hedges & Olkin, 1985).
The preceding analysis reveals that total selectivity for chronological age amounts to 0.59 standard deviation units, a medium-sized effect (cf. Cohen, 1977). About 66% of this total amount (i.e., [0.39/0.59] 100) is due to mortality, indicating that older individuals in the T1 parent sample were less likely to be still alive at T3 than younger individuals. Conversely, 34% of total selectivity is experi-mental in nature and refers to individuals still alive at T3. Parent Sample Estimates for Variables Assessed at T3
In addition to the decomposition of total selectivity into mortality-associated and experimental components, another desirable feature of selectivity analysis is that it examines the effects of selectivity on variables measured after selec-tion. Following our earlier work on selectivity in BASE (Lindenberger et al., 1999), the Pearson–Lawley selection formulae (PLSF; Lawley, 1943; Pearson, 1903) were used for this purpose. Using linear regression, the PLSF allow for the estimation of statistical reference values (means, vari-ances, and covariances) that take account of observed selec-tivity. Independent (or selection) variables are distinguished from dependent variables (i.e., variables on which only per-sons who continue participation have observations). Means, variances, and covariances of the parent sample on the de-pendent variables are estimated on the basis of the linear re-lations between selection variables and dependent variables and of the differences in selection variable means between
P476 LINDENBERGER ET AL.
the parent and the selected sample. The PLSF were imple-mented using the statistical package Mx (Neale, 1991). The PLSF assume that the regressions of dependent variables on selection variables are linear and that conditional variances are constant (homoscedasticity). Under these assumptions, the PLSF make optimal use of available information, allow-ing for efficient and unbiased estimation of population pa-rameters after selection.
Aitkin (1934) and Lawley (1943) showed that the PLSF can be applied repeatedly. In our case, a three-step proce-dure was followed. First, variables available at T1 were used to arrive at parent sample estimates for variables assessed at T2. Second, parent sample parameters for T1 and T2 (i.e., the observed values from T1, and the parent sample esti-mates from T2) served as selection variables and were used to arrive at parent sample estimates for variables available at the T3 Intake Assessment. Third, parent sample parameters for T1, T2, and the T3 Intake Assessment were taken to ar-rive at parent sample estimates for variables available at the T3 Intensive Protocol.
METHODS
The objective of this study was to analyze the extent of mortality-associated and experimental selectivity of the BASE T3 sample (N 206) relative to the T1 parent sample (N 516). Analyses were performed before and after re-gressing the relevant variables on age to examine the extent to which selectivity effects were age associated. Through prior use of the PLSF, selectivity effects were also estimated for variables assessed after selection.
BASE is an interdisciplinary study with a wide range and a very large number of variables from psychology, sociol-ogy, psychiatry, and internal medicine (Baltes & Mayer, 1999). Only a small fraction of variables could be included in the present analyses. Our main criterion for inclusion was construct centrality, that is, the degree to which a given vari-able is at the core of an important domain of functioning (cf. Little, Lindenberger, & Nesselroade, 1999). In addition, we decided to oversample variables from psychological domains such as intellectual and sensory functioning (see also Baltes & Lindenberger, 1997; Lindenberger & Baltes, 1997).
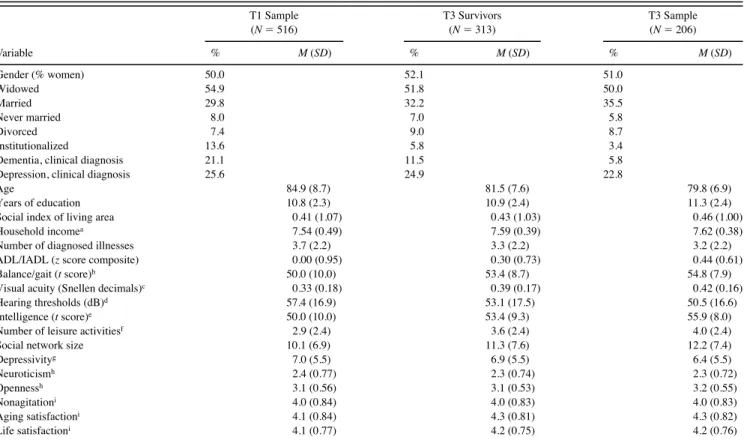
Table 1. Prevalence Rates, Means, and Standard Deviations at T1: Observed Values for the T1 Parent Sample, T3 Survivors, and the T3 Sample T1 Sample (N 516) T3 Survivors (N 313) T3 Sample (N 206) Variable % M (SD) % M (SD) % M (SD) Gender (% women) 50.0 52.1 51.0 Widowed 54.9 51.8 50.0 Married 29.8 32.2 35.5 Never married 8.0 7.0 5.8 Divorced 7.4 9.0 8.7 Institutionalized 13.6 5.8 3.4
Dementia, clinical diagnosis 21.1 11.5 5.8
Depression, clinical diagnosis 25.6 24.9 22.8
Age 84.9 (8.7) 81.5 (7.6) 79.8 (6.9)
Years of education 10.8 (2.3) 10.9 (2.4) 11.3 (2.4)
Social index of living area 0.41 (1.07) 0.43 (1.03) 0.46 (1.00)
Household incomea 7.54 (0.49) 7.59 (0.39) 7.62 (0.38)
Number of diagnosed illnesses 3.7 (2.2) 3.3 (2.2) 3.2 (2.2)
ADL/IADL (z score composite) 0.00 (0.95) 0.30 (0.73) 0.44 (0.61)
Balance/gait (t score)b 50.0 (10.0) 53.4 (8.7) 54.8 (7.9)
Visual acuity (Snellen decimals)c 0.33 (0.18) 0.39 (0.17) 0.42 (0.16)
Hearing thresholds (dB)d 57.4 (16.9) 53.1 (17.5) 50.5 (16.6)
Intelligence (t score)e 50.0 (10.0) 53.4 (9.3) 55.9 (8.0)
Number of leisure activitiesf 2.9 (2.4) 3.6 (2.4) 4.0 (2.4)
Social network size 10.1 (6.9) 11.3 (7.6) 12.2 (7.4)
Depressivityg 7.0 (5.5) 6.9 (5.5) 6.4 (5.5) Neuroticismh 2.4 (0.77) 2.3 (0.74) 2.3 (0.72) Opennessh 3.1 (0.56) 3.1 (0.53) 3.2 (0.55) Nonagitationi 4.0 (0.84) 4.0 (0.83) 4.0 (0.83) Aging satisfactioni 4.1 (0.84) 4.3 (0.81) 4.3 (0.82) Life satisfactioni 4.1 (0.77) 4.2 (0.75) 4.2 (0.76)
Notes: Sample composition is transitive in the sense that T3 survivors are a subsample of the T1 parent sample and that the T3 sample is a subsample of the T3 sur-vivors. A detailed description of variables is provided in Baltes and Mayer (1999). ADL activity of daily living; IADL instrumental activity of daily living.
aNatural logarithm of household income per capita in DM plus 100. bUnit-weighted composite of Romberg Stance and Turn 360.
cComposite of close and distance visual acuities assessed with standard reading tables. dAverage threshold in dB across both ears and four frequencies (1.00, 2.00, 4.00, and 6.00 kHz).
eUnit-weighted composite of perceptual speed, memory, fluency, and knowledge, assessed by two indicators each. fNumber of social activities outside the home during the last 12 months.
gHamilton Depression Scale. hNEO subscales.
SELECTIVITY IN AGING POPULATIONS P477
Measures
Twenty-three and 16 variables were considered at T1 and T3; they are listed in Tables 1 and 2, respectively (for de-tailed descriptions, see Baltes & Mayer, 1999). In addition, 11 variables from the second measurement occasion of the BASE (T2, N 361, 1.7 years after T1), which involved a reduced measurement protocol, were used to enhance the estimation of selectivity effects in T3 variables with the PLSF. Specifically, the following variables measured at T2 were included: activities of daily living (ADLs); depression/ depressivity, based on a checklist of depressive symptoms (0
no depression, 1 subthreshold depression, 2 depres-sion); hearing (same as T1 and T3); Digit Letter, a test of per-ceptual speed; self-rated mobility; the Short Mini-Mental State Examination (SMMSE)]; social network size; well-being (same as T1 and T3); and vision (same as T1 and T3).
Missing Data Within Measurement Occasions and Use of PLSF
For some variables, the number of participants with valid data was less than the number of persons participating at the corresponding measurement occasion. Such missing values were treated as follows: (a) the participant’s value on the variable was set to the mean of the corresponding sample (e.g., for participants with missing values on a T1 variable, their value on this variable was set to the mean of the T1 parent sample); (b) dummy variables were created, which
were set to 0 when the participant’s value was valid, and to 1 when it was missing. These dummy variables allowed us to include missing information in the use of the PLSF. Missing values were replaced for the following variables: (a) at T1: depressivity (number of missing values: n 96), income (n 70), social network size (n 17), and years of educa-tion (n 31); (b) at T2: Digit Letter test (n 37), depres-sion (n 2), hearing (n 4), and vision (n 16); (c) at T3: vision (n 3).
When projecting selectivity onto variables observed after selection using the PLSF, the following rule needs to be kept in mind: The more closely variables assessed at earlier mea-surement occasions (i.e., selection variables) are associated with variables at later occasions (i.e., dependent variables or variables after selection), the more confidence one can have in the estimates. Therefore, we examined the degree to which the linear combination of T1 and T2 variables was as-sociated with each of the T3 variables. Analyses were re-stricted to the T3 sample (N 206). On average, the pro-portion of predicted variance was quite high (mdn R2 .63). The highest value (R2 .89) was found for hearing, and the lowest for the clinical diagnosis of depression (R2 .28). Thus, insofar as there was selectivity on variables as-sessed at T3, the predictive power of the system of selection variables was generally sufficiently large to detect it. Note that low predictability for a given variable may point either to an absence of related measures at earlier occasions or to an intrinsic lack of relative stability in that variable.
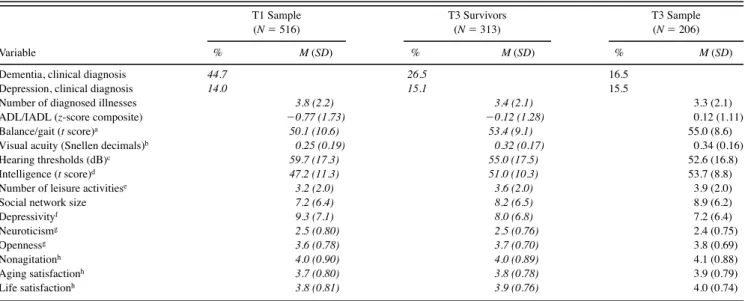
Table 2. Prevalence Rates, Means, and Standard Deviations at T3: Pearson–Lawley Estimates for the T1 Parent Sample, for Individuals Still Alive at T3, and Observed Values for the T3 Sample
T1 Sample (N 516) T3 Survivors (N 313) T3 Sample (N 206) Variable % M (SD) % M (SD) % M (SD)
Dementia, clinical diagnosis 44.7 26.5 16.5
Depression, clinical diagnosis 14.0 15.1 15.5
Number of diagnosed illnesses 3.8 (2.2) 3.4 (2.1) 3.3 (2.1)
ADL/IADL (z-score composite) 0.77 (1.73) 0.12 (1.28) 0.12 (1.11)
Balance/gait (t score)a 50.1 (10.6) 53.4 (9.1) 55.0 (8.6)
Visual acuity (Snellen decimals)b 0.25 (0.19) 0.32 (0.17) 0.34 (0.16)
Hearing thresholds (dB)c 59.7 (17.3) 55.0 (17.5) 52.6 (16.8)
Intelligence (t score)d 47.2 (11.3) 51.0 (10.3) 53.7 (8.8)
Number of leisure activitiese 3.2 (2.0) 3.6 (2.0) 3.9 (2.0)
Social network size 7.2 (6.4) 8.2 (6.5) 8.9 (6.2)
Depressivityf 9.3(7.1) 8.0 (6.8) 7.2 (6.4) Neuroticismg 2.5 (0.80) 2.5 (0.76) 2.4 (0.75) Opennessg 3.6 (0.78) 3.7 (0.70) 3.8 (0.69) Nonagitationh 4.0 (0.90) 4.0 (0.89) 4.1 (0.88) Aging satisfactionh 3.7 (0.80) 3.8 (0.78) 3.9 (0.79) Life satisfactionh 3.8 (0.81) 3.9 (0.76) 4.0 (0.74)
Notes: Sample composition is transitive in the sense that T3 survivors are a subsample of the T1 parent sample and that the T3 sample is a subsample of the T3 survivors. A detailed description of variables is provided in Baltes and Mayer (1999). Estimates based on the Pearson–Lawley selection formulae are printed in italics. ADL activity of daily living; IADL instrumental activity of daily living.
aUnit-weighted composite of Romberg Stance and Turn 360.
bComposite of close and distance visual acuities assessed with standard reading tables. cAverage threshold in dB across both ears and four frequencies (1.00, 2.00, 4.00, and 6.00 kHz).
dUnit-weighted composite of perceptual speed, memory, fluency, and knowledge, assessed by two indicators each. eNumber of social activities outside the home during the last 12 months.
fHamilton Depression Scale. gNEO subscales.
P478 LINDENBERGER ET AL.
To partition selectivity into its mortality-associated and experimental components for variables measured after se-lection, we computed two independent series of PLSF anal-yses, one to obtain means and prevalence estimates of T3 variables for the T1 parent sample (N 516) and the other to obtain means and prevalence estimates on T3 variables for the T3 survivors (N 313). Using Equations 1 and 2, we then computed mortality-associated and experimental selectivity, respectively.
RESULTS
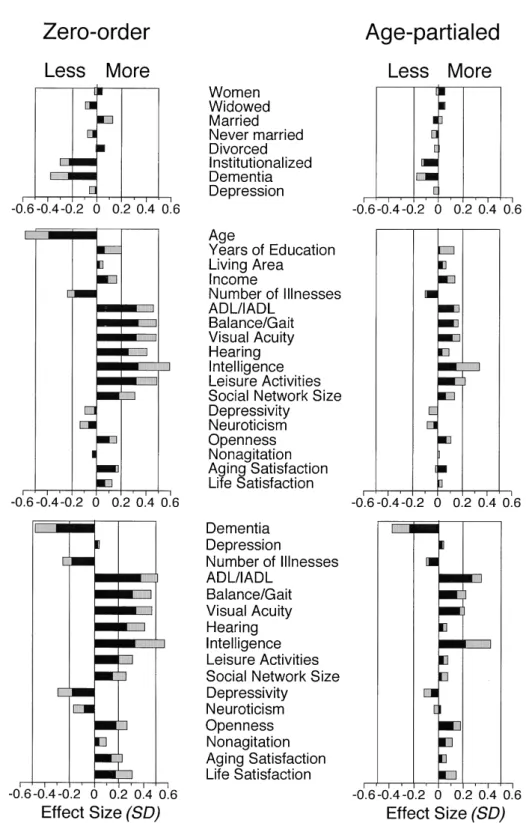
Table 1 lists the observed means and prevalence rates for T1 variables in the T1 parent sample, the T3 survivors, and the T3 sample. The corresponding selectivity effects are dis-played in the top and middle panels of Figure 1. Table 2 lists means and prevalence rates for T3 variables in the T1 parent sample, the T3 survivors, and the T3 sample; here, values for the T1 parent sample and the T3 survivors were esti-mated using the PLSF. The resulting selectivity estimates are displayed in the bottom panels of Figure 1.
In the following, chronological age and variables related to marital status were not included in the statistical analyses. Chronological age was excluded because we wished to compare the magnitude of selectivity effects before versus after its statistical control. As seen in the upper panels of Figure 1, selectivity effects related to marital status variables were negligible. Across the remaining 48 variables, the aver-age magnitude of absolute total selectivity amounted to 0.28 standard deviation units. The average magnitude of the mortality-associated component was 0.18 standard devi-ations, and the average magnitude of the experimental com-ponent was 0.10 standard deviation units. The mean differ-ence between the two components was statistically reliable, t(1) 7.20, p .01. Thus, on average, 64% of observable selectivity effects regarding means or prevalence rates were associated with mortality, and only 36% reflected selective sampling of the survivors (See Appendix, Note 2).
Mortality-Associated and Experimental Selectivity Components in Relation to Age
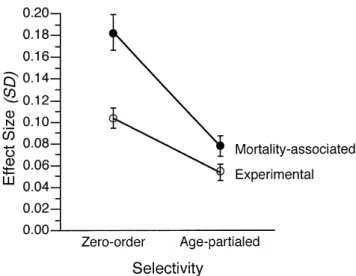
As can be seen by comparing the left and right panels of Figure 1, selectivity effects were considerably reduced when variables were regressed on age. Specifically, for the 48 variables considered, the average size of the mortality-associated component was reduced from 0.18 to 0.08, and the average size of the experimental component was re-duced from 0.10 to 0.05 standard deviation units after par-tialing age. In an analysis of variance with age (without vs with statistical control for age) and component (mortality-associated vs experimental), we found that the Age Com-ponent interaction was statistically reliable (MSE 0.0004), F(1,47) 103.93, p .01, 2 0.69. The interaction indi-cates that the mortality-associated selectivity component was more strongly related to age than the experimental com-ponent (see Figure 2). In addition to the interaction, the main effects of age (MSE 0.003), F(1,47) 108.10, p .01, 2 0.70, and component (MSE 0.004), F(1,47) 28.66, p .01, 2 0.38, were also reliable (see Appendix, Note 3).
Differences in the Magnitude of Selectivity Effects by Domain of Functioning
The magnitude of total selectivity effects differed reliably across the 48 variables considered in the preceding analy-ses, Q(47) 184.30, p .01 (cf. Formula 25 in chapter 6 of Hedges & Olkin, 1985). Thus, the null hypothesis of homo-geneity of effect sizes was inconsistent with the data. An inspection of Figure 1 suggests that experimental and mortality-associated selectivity effects were most pronounced for in-tellectual functioning, sensory functioning, and ADLs. For instance, the five variables with the highest absolute values for the mortality-associated selectivity component were chronological age (0.39), ADLs at T3 (0.38), vision at T3 (0.34), balance/gait at T1 (0.34), intelligence at T1 (0.34), and intelligence at T3 (0.33). For the experimental com-ponent, the five variables with the highest absolute values were intelligence at T1 (0.26), intelligence at T3 (0.24), Digit Letter at T2 (0.24), chronological age at T1 (–0.19), and the SMMSE at T2 (0.18). At the other end of the spec-trum, the five variables with the lowest absolute values for the mortality-associated component were clinical diagnosis of depression at T1 (–0.02), depressivity at T1 (0.02), social in-dex of living area (0.02), clinical diagnosis of depression at T3 (0.03), and nonagitation at T2 (–0.03), and the five variables with the lowest values for the experimental selectivity com-ponent were nonagitation at T1 (–0.00), clinical diagnosis of depression at T3 (0.01), aging satisfaction at T2 (0.02), be-ing female (–0.02), and agbe-ing satisfaction at T1 (0.02).
Mortality-associated and experimental selectivity compo-nents were substantially correlated (r .76, p .01). The corresponding correlation was lower for variables regressed on age (r .43, p .01); for the difference between the two correlations, z 2.52 (p .01). Thus, a significant por-tion of the link between mortality-associated and experi-mental mortality was collinear with chronological age. DISCUSSION
Consequences for the Generalizability of Results Obtained with the T3 Sample
Magnitude of experimental selectivity effects.—By con-vention (e.g., Cohen, 1977), effect sizes of 0.20, 0.50, and 0.80 are the minimum values required to indicate small, me-dium, and large effects, respectively. With respect to means and prevalence rates, then, the average magnitude of the experimental selectivity component (i.e., 0.10 standard devia-tion units) was too small to qualify for even a small effect. This result supports the conclusion that findings regarding means and prevalence rates obtained with the T3 sample can be generalized to the T1 parent sample and, after adding the qualifications summarized in Lindenberger and colleagues (1999), to the population level. As far as means and preva-lence rates are concerned, this result speaks favorably to the average sampling quality of the T3 longitudinal follow-up of BASE.
At the same time, however, there was significant hetero-geneity in the magnitude of selectivity effects. Specifically, experimental selectivity effects for chronological age and for measures of intellectual functioning varied around 0.22,
SELECTIVITY IN AGING POPULATIONS P479
rather than 0.10, standard deviation units. At least with re-spect to age and intelligence, the nonrandom sampling of survivors introduced a nonnegligible degree of mean level bias in the T3 sample.
Age-associated selectivity: Mortality-associated versus experimental components.—A substantial portion of ex-perimental selectivity was related to the fact that surviving individuals were less likely to participate when they were
Figure 1. Mortality-associated and experimental components of selectivity in the BASE T3 sample (N 206) relative to the T1 parent sam-ple (N 516) for zero-order and age-partialed variables assessed at T1 and T3. Top panels: Selectivity effects on dichotomous variables assessed at T1. Middle panels: Selectivity effects on continuous variables assessed at T1. Bottom panels: Selectivity effects on variables assessed at T3. Values for T3 variables were estimated using the Pearson–Lawley selection formulae. Throughout, left panels display zero-order effects, and right panels display age-partialed effects. In all panels, black bars represent mortality-associated components, and grey bars represent experimental components of selectivity. ADL activity of daily living; IADL instrumental activity of daily living.
P480 LINDENBERGER ET AL.
older. This association between experimental selectivity and age implies that both longitudinal and cross-sectional age relations observed in the T3 sample are likely to be less pro-nounced than they actually are in the aging population. With respect to intelligence, experimental selectivity remained substantial after controlling for age (T1: 0.26 vs 0.19; T3: 0.24 vs 0.20). Thus, surviving individuals of a given age were less likely to participate in the T3 Intensive Protocol when their levels of intellectual functioning were low.
The reduction in selectivity after controlling for chrono-logical age was more pronounced for the mortality-associated component (0.18 vs 0.08) than for the experimental compo-nent (0.10 vs 0.05; see Figure 2). The relatively strong link between mortality-associated selectivity and chronological age arises because older individuals are less likely to survive and show lower levels of functioning.
Experimental Selectivity: A “Precursor” of Mortality-Associated Selectivity?
Both conceptually and statistically, mortality-associated and experimental components of selectivity are free to vary independently of each other (cf. Baltes et al., 1988). In the present heterogeneous sample of very old individuals, how-ever, experimental and mortality-associated selectivity com-ponents shared 58% of their variance across the 48 variables
considered. A plausible explanation for this finding is that some of the causes underlying experimental and mortality-associated selectivity are identical. For instance, it appears that both life expectancies and participation rates among survivors are lower among individuals with low levels of functioning in intelligence, ADLs, and sensorimotor perfor-mance. It seems likely that the average life expectancy of in-dividuals who were still alive at T3 and did not participate in the T3 Intensive Protocol (N 107) will be lower than the average life expectancy of individuals who were still alive at T3 but did participate in the T3 Intensive Protocol (N 206). In this limited sense, experimental selectivity may be seen as a “precursor” of mortality-associated selectivity. Validity of the PLSF
The PLSF were used to project selectivity into variables measured after selection. The similarity of effects sizes at T1 and T3 for identical variables (see middle and lower pan-els of Figure 1) lends credibility to this estimation method. Note that the PLSF can also be used to estimate selectivity effects for variables that were measured at a later measure-ment occasion for the first time, especially if these variables are well predicted by variables assessed at earlier occasions (cf. Lindenberger et al., 1999).
Selectivity of the T3 Sample With Respect to Variances and Correlations
So far, our findings suggest that the degree of selectivity of the T3 sample relative to the T1 parent sample was rela-tively small by conventional standards. However, this con-clusion is warranted only with respect to average experi-mental selectivity effects on means and prevalence rates, and must not be generalized to other aspects of the data. A more comprehensive picture of selectivity effects also has to consider variability information (cf. Lindenberger et al., 1999). Therefore, we briefly address selectivity in the T3 sample regarding variances and correlations.
Overall, the T3 sample was less variable than the T1 par-ent sample on 26 of the 32 continuous variables listed in Tables 1 and 2 (z 3.36, p .01; sign test). Variability dec-rements tended to be more pronounced for variables that also showed larger selectivity effects with respect to means, such as chronological age, ADLs, and intelligence.
Variance restrictions can exert a strong influence on cova-riances and correlations (e.g., Nesselroade & Thompson, 1995). As an illustration, Table 3displays simple correlations among age, vision, hearing, balance/gait, and intelligence at
Table 3. Correlations Among Balance/Gait, Vision, Hearing, Intelligence, and Age Assessed at T1 in the Parent Sample (N 516), the T3 Survivors (N 313), and the T3 Sample (N 206)
1. Balance/Gait 2. Vision 3. Hearing 4. Intelligence 5. Age
1 — .52 / .46 / .42 .41 / .33 / .28 .53 / .44 / .38 .61 / .53 / .55
2 .25 / .27 / .24 — .44 / .40 / .34 .54 / .44 / .36 .58 / .49 / .43
3 .09 / .07 / .02 .16 / .19 / .17 — .47 / .43 / .38 .57 / .54 / .48
4 .30 / .27 / .26 .34 / .28 / .26 .24 / .25 / .28 — .53 / .44 / .30
Notes: Within each entry, values refer to the T1 parent sample, the T3 survivors, and the T3 sample, respectively, and are separated by slashes. Simple correlations are shown above the main diagonal; age-partialed correlations are shown below the diagonal. Correlations that do not differ from zero at the .01 level are printed in italics.
Figure 2. Average magnitude of absolute mortality-associated and experimental selectivity components before and after controlling for age. A total of 48 variables was considered. Error bars refer to stan-dard errors of the mean.
SELECTIVITY IN AGING POPULATIONS P481
T1 for the T1 parent sample, the T3 survivors, and the T3 sample. Almost all interrelations were attenuated by mortal-ity-associated selectivity (T1 parent sample vs T3 survivors) and by experimental selectivity (T3 survivors vs T3 sam-ple). Table 3 also shows that the corresponding changes were close to zero for age-partialed correlations. Apparently, then, the observed reductions in correlations were collinear with reductions in the variance of age.
In many analyses of aging populations, it has been com-mon practice to restrict longitudinal data analysis to individ-uals who have been observed at more than one or all mea-surement occasions. Our analysis suggests that this practice may greatly reduce the strength of observable variable rela-tions, especially to the extent that these variables have pro-nounced relations to chronological age.
Methodological Conclusions
In this article, we proposed a simple set of formulae for the additive decomposition of selectivity effects into mortality-associated and experimental components. Parti-tioning total selectivity into these two components serves to separate selectivity as a population process (i.e., selectivity associated with mortality) from selectivity as a sampling problem (i.e., selectivity associated with nonparticipation among survivors). In addition, we advocated the use of the PLSF to project selectivity onto variables measured after selection, and the comparison of results before and after regressing the relevant variables on age to document the extent to which mortality-associated and experimental com-ponents of selectivity are age linked. In combination, the three methods yield central and useful information about the magnitude and nature of selectivity effects regarding means and prevalance rates in aging populations. Because of its standardized (effect-size) format, this information is easily compared across measurement occasions, variables, and studies.
At the same time, we recognize the limitations of the data-analytic strategy pursued in this article and would like to mention three of them. First, the PLSF assume linearity as well as homoscedasticity, and generate estimates for first and second-order moments only (i.e., means, prevalence rates, variances, covariances). Hence, the PLSF do not pro-vide selectivity-adjusted estimates for missing data at the in-dividual (i.e., raw data) level, and are not well suited to cap-ture selectivity in patterns of change. Second, our approach identifies correlates for surviving up to a specific point in time (e.g., T3). This is appropriate whenever one would like to describe sample selectivity as a function of differential survival at exactly that time point, as was the case in the present article. For most other purposes, individual differ-ences in survival should be described on a temporal con-tinuum using hazard functions or related procedures (e.g., Ghisletta & Lindenberger, 2000; Maier & Smith, 1999). Third, our approach focused on selectivity at the level of individual variables. In a large multidisciplinary project such as BASE, this initial focus on individual variables is legitimate because researchers often want to know the de-gree of selectivity for their specific variable of interest. However, such variable-centered approaches to selectivity need to be complemented by methods that focus on latent
factors as the unit of selection (Dolan & Molenaar, 1994) or on differences between types of individuals (Smith & Baltes, 1997).
Despite these limitations, the data and methodology presented in this article highlight the shortcomings of common longitudinal and cross-sectional methods for the study of age differences and age changes in old and very old age. Quite often, these methods are based on the no-tion of a unitary and immutable populano-tion spanning the entire age range under study. For instance, the identifica-tion of cross-secidentifica-tional age gradients for intellectual abili-ties from age 70 to age 100 presumes that individuals observed at age 100 are drawn from the same population as individuals observed at age 70. Aside from cohort dif-ferences, this assumption is no longer tenable if survival is selective (cf. Baltes, Mayer, Helmchen, & Steinhagen-Thiessen, 1999, p. 44; Lindenberger et al., 1999, p. 78). To arrive at better representations of interindividual differ-ences in intraindividual change under conditions of selec-tive mortality, we need to develop and use methods that represent change and selection processes within the same data-analytic framework (e.g., Lindenberger & Ghisletta, in press; McArdle et al., 1991; Singer, Verhaeghen, Ghis-letta, Lindenberger, & Baltes, 2002).
Acknowledgments
We acknowledge productive discussions with Reiner Gilberg, Paolo Ghisletta, Todd Little, Ineke Maas, John R. Nesselroade, Ulrich Pötter, and Jacqui Smith. The present research was conducted in the context of the Berlin Aging Study (BASE), which is co-chaired by Paul B. Baltes and Karl Ulrich Mayer (for more information, see the Acknowledgments in Smith et al., this issue).
Address correspondence to Paul B. Baltes, Max Planck Institute for Human Development, Lentzeallee 94, D-14195 Berlin, Germany; to Ulman Lindenberger, Saarland University, School of Psychology, Im Stadtwald, Build-ing 1, D-66123 Saarbrücken, Germany; or to Tania SBuild-inger, Functional Imaging Laboratory, Wellcome Department of Imaging Neuroscience, 12 Queen Square, WC1N 3BG London, UK. E-mail: sekbaltes@mpib-berlin. mpg.de, [email protected], or t.singer@fil.ion.ucl.ac.uk
References
Aitkin, A. C. (1934). Note on selection from a multivariate normal popula-tion. Proceedings of the Edinburgh Mathematical Society, 4, 106–110. Baltes, P. B., & Labouvie, G. V. (1973). Adult development of
intellec-tual performance: Description, explanation, modification. In C. Eis-dorfer & M. P. Lawton (Eds.), The psychology of adult development and aging (pp. 157–219). Washington, DC: American Psychological Association.
Baltes, P. B., & Lindenberger, U. (1997). Emergence of a powerful connec-tion between sensory and cognitive funcconnec-tions across the life span: A new window to the study of cognitive aging? Psychology and Aging, 12, 12–21.
Baltes, P. B., & Mayer, K. U. (Eds.). (1999). The Berlin Aging Study: Aging from 70 to 100. New York: Cambridge University Press.
Baltes, P. B., Mayer, K. U., Helmchen, H., & Steinhagen-Thiessen, E. (1999). The Berlin Aging Study (BASE): Sample, design, and overview of measures. In P. B. Baltes & K. U. Mayer (Eds.), The Berlin Aging Study: Aging from 70 to 100 (pp. 15–55). New York: Cambridge Uni-versity Press.
Baltes, P. B., Reese, H. W., & Nesselroade, J. R. (1988). Life-span develop-mental psychology: An introduction to research methods. Hillsdale, NJ: Erlbaum.
Baltes, P. B., Schaie, K. W., & Nardi, A. H. (1971). Age and experimental mortality in a seven-year longitudinal study of cognitive behavior. De-velopmental Psychology, 5, 18–26.
P482 LINDENBERGER ET AL.
Cohen, J. (1977). Statistical power analysis for the behavioral sciences (Rev. ed.). New York: Academic Press.
Diggle, P. J., Liang, K. Y., & Zeger, S. L. (1994). Analysis of longitudinal data. Oxford, England: Oxford University Press.
Dolan, C. V., & Molenaar, P. C. M. (1994). Testing specific hypotheses concerning latent group differences in multi-group covariance structure analysis with structured means. Multivariate Behavioral Research,29, 203–222.
Ghisletta, P., & Lindenberger, U. (2000, November). How to include differ-ential rates of change in survival analysis using latent growth curve modeling: Intellectual functioning in the Berlin Aging Study. Paper pre-sented at the 53rd Annual Scientific Meeting of the Gerontological So-ciety of America, Washington, DC.
Hedges, L. V., & Olkin, I. (1985). Statistical methods for meta-analysis. Orlando, FL: Academic Press.
Lawley, D. N. (1943). A note on Karl Pearson’s selection formulae. Pro-ceedings of the Royal Society of Edinburgh,62, 28–30.
Lindenberger, U., & Baltes, P. B. (1997). Intellectual functioning in old and very old age: Cross-sectional results from the Berlin Aging Study. Psy-chology and Aging,12, 410–432.
Lindenberger, U., & Ghisletta, P. (in press). Modeling longitudinal changes in old age: From covariance structures to dynamic systems. In R. A. Dixon, L. Bäckman, & L.-G. Nilsson (Eds.), New frontiers in cognitive aging. Oxford, England: Oxford University Press.
Lindenberger, U., Gilberg, R., Little, T. D., Nuthmann, R., Pötter, U., & Baltes, P. B. (1999). Sample selectivity and generalizability of the re-sults of the Berlin Aging Study. In P. B. Baltes & K. U. Mayer (Eds.), The Berlin Aging Study: Aging from 70 to 100 (pp. 56–82). New York: Cambridge University Press.
Little, T. D., Lindenberger, U., & Nesselroade, J. R. (1999). On selecting indicators for multivariate measurement and modeling with latent vari-ables: When “good” indicators are bad and “bad” indicators are good. Psychological Methods,4, 192–211.
Maier, H., & Smith, J. (1999). Psychological predictors of mortality in old age. Journal of Gerontology: Psychological Sciences,54B, P44–P54. McArdle, J. J., Hamagami, F., Elias, M. F., & Robbins, M. A. (1991).
Structural modeling of mixed longitudinal and cross-sectional data. Ex-perimental Aging Research, 17, 29–51.
Neale, M. C. (1991). Mx: Statistical modelling. (Available from the De-partment of Human Genetics, Box 3MCV, Richmond, VA 23298). Nesselroade, J. R., & Thompson, W. W. (1995). Selection and related
threats to group comparisons: An example comparing factorial struc-tures of higher and lower ability groups of adult twins. Psychological Bulletin,117, 271–284.
Pearson, K. (1903). Mathematical contributions to the theory of evolution: XI. On the influence of natural selection on the variability and correla-tion of organs. Philosophical Transactions of the Royal Society of Lon-don (Series A),200, 1–66.
Powers, E. A., & Bultena, G. L. (1972). Characteristics of deceased dropouts in longitudinal research. Journal of Gerontology, 27, 350– 353.
Siegler, I. C., & Botwinick, J. (1979). A long-term longitudinal study of in-tellectual ability of older adults: The matter of selective subject attri-tion. Journal of Gerontology,34, 242–245.
Singer, T., Verhaeghen, P., Ghisletta, P., Lindenberger, U., & Baltes, P. B. (2002). The fate of cognition in very old age: Six-year longitudinal findings in the Berlin Aging Study (BASE). Manuscript submitted for publication.
Smith, J., & Baltes, P. B. (1997). Profiles of psychological functioning in the old and oldest old. Psychology and Aging, 12, 458–472.
Received July 31, 2001 Accepted July 27, 2002
Appendix Notes
1. Sample selectivity prior to the Intensive Protocol of the first measurement occasion has been reported elsewhere (Linden-berger et al., 1999).
2. The magnitude of selectivity effects did not vary reliably as a function of measurement occasion (i.e., T1, T2, T3), F(2,45) 0.87, MSE 0.016, p .43. Therefore, it appeared justified to collapse the data across measurement occasions despite the fact that selectivity effects at T1 were computed directly, whereas selectivity effects at T2 and T3 were computed after application of the PLSF.
3. Note that our rationale for identifying the age-orthogonal com-ponent of mortality-associated and experimental selectivity ef-fects was entirely descriptive. From a developmental perspec-tive, the age-linked component of selectivity is at least as much in need of explanation as the age-orthogonal component.