Abstract
In this paper, Supervised Machine Learning was used to develop a new approach to handle customers’ claims which were gathered from a real-case company. Supervised machine learning was used with accurate data in order to develop a machine learning model. This model was deployed and used to evaluate new un-evaluated claims by examining their content variables and assigning a ranking value for each claim expressing its priority.
The goal of this experiment was to show evidence on the ability of new technologies such as Machine Learning to automate quality management traditional activities, improve efficiency and effectiveness, and support a new approach to “Quality 4.0”. Other goals were to improve customer satisfaction by enhancing responsiveness to their claims and to convince the company (the real case of this study) to extend the project for further applications.
Keywords
Industry 4.0, Quality 4.0, TQM, Machine Learning, Artificial Intelligence, Customer Satisfaction. Introduction
Artificial Intelligence (AI) is radically developing nowadays in many different fields, empowered by the development of computer and telecom technologies such as big data and supercomputers which are able to analyze large volumes of data at a super-fast speed [1]. Machine Learning (ML) is one of the AI technologies, it is used in many fields of our lives, based basically on extracting knowledge from big data, trying to detect patterns or predict future behaviors [2]. ML is being widely used by large scale businesses such as Google. Microsoft, and Facebook
benefiting from the massive amounts of data accumulated through the usage of their services [3]. Currently, ML is being used at other sectors such as health [4], finance [5], and in many business management fields such as logistics and workflow optimization [6], customer care [7] and more. There are many ML tools and platforms, some examples are Google TensorFlow, Scikit-learn, Google’s Cloud AutoML, Microsoft, etc. [2], [8].
Arora et al (2009) [7] utilized supervised ML to categorize online customers’ comments either by categorizing them to qualified, or bad claims. In their experiment, a sufficient number of online customers’ reviews which were written in two languages was collected and used as training data to develop a logarithm that will be deployed later to analyze customers' comments. [9] used Natural Language Processing (NLP) and Deep Learning (DL) to extract meaningful insights from customer’s perceptions. They used historical data about a specific car model and used NLP/DL to understand the customers’ favorite features. The goal was to improve future cars to fulfill customers’ expectations.
Customers’ complaints are very critical not only to resolve customer’s problems but also to understand important information about them and their behavior, which if well managed could be very expensive knowledge for the company’s development. Complaints are reported through different channels and the most important part of it is the narrative content that describes the product’s problems [10]. Therefore, it is important to develop automated and efficient tools that can handle large volumes of complaints containing complex and interconnected data automatically and in a highly responsive manner. This paper summarizes the results of a real-life experiment resulted from scientific cooperation with large manufacturing company in Hungary. At present,
HUNGARIAN AGRICULTURAL ENGINEERING
N° 36/2019 15-21
Published online: http://hae-journals.org/
HU ISSN 0864-7410 (Print) / HU ISSN 2415-9751(Online) DOI: 10.17676/HAE.2019.36.15
UTILIZING MACHINE LEARNING TECHNIQUES TO PROCESS
CUSTOMERS CLAIMS AUTOMATICALLY
Author(s):
S. Sader
Affiliation:
Ph.D. Student, Doctoral School of Engineering, Szent István University, Páter K. u. 1., Gödöllő, H-2103, Hungary
Email address:
PERIODICAL OF THE COMITTEE OF AGRICULTURAL AND BIOSYSTEM ENGINEERING OF
THE HUNGARIAN ACADEMY OF SCIENCES and
SZENT ISTVÁN UNIVERSITY Faculty of Mechanical Engineering Received: 2019.10. 05. - Accepted: 2019.12.28.
claims are being received, registered at the ERP system of the company, and later viewed and handled manually by the experienced quality management staff. The company adopts Issue Priority Ranking (IPR) strategy to evaluate and rank every claim by a scale of 1-300 points based on detailed evaluation criteria. According to the IPR value of every single claim, the quality team decides the next handling steps. Time and experience playing an important role in this system; therefore, it was important to improve the process of evaluating claims and lever the current experience by utilizing machine learning.
Accordingly, one-year data of claims was extracted from the ERP system and used as training data to develop a machine learning model that was deployed later and tested to handle new claims. The model was trained to automatically analyze every claim content and return an IPR value to each based on the information provided. Moreover, the model was trained to categorize the source problem process where the defect problem came from.
In this experiment, Google AutoML service was used to develop and deploy the model. Google AutoML was selected for its user-friendly environment as there is no need to have any earlier coding practice. Later, the model can be deployed and integrated into the company’s ERP system. The results showed relatively high-quality results with acceptable accuracy, given the volume of data used for training and the accuracy expected in filling the data of every claim filled at the customers’ end.
The industrial partner in this research work is CLAAS Hungária Kft (CLH)1 , established in 1997
in Hungary as a member company of CLAAS Group. CLAAS group is an international German family-owned business company based in Germany and owns many manufacturing plants worldwide. CLAAS is a world-leading manufacturer of agricultural engineering equipment and machinery, acknowledged by its high quality and innovation. Since establishment, CLAAS Hungária expanded from 350 workers and 8 hectares plant to more than 700 workers working on a 14- hectare plant and became a center of excellence for combine harvester tables and trolley carts production. The connection with CLH was started in 2017 and resulted research cooperation with the Quality Management Department.
Materials and methods
In this research work, supervised machine learning was used to improve the customers’ claim processing
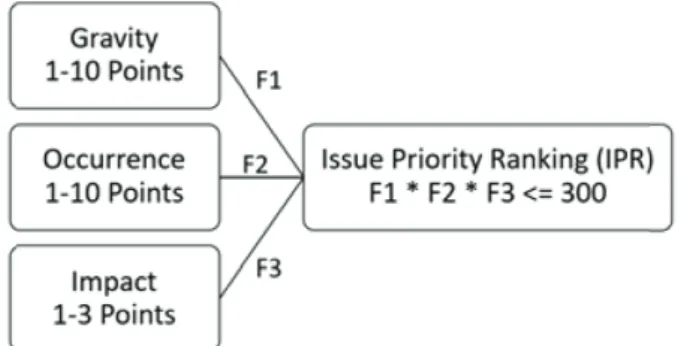
process. Claims are being received from different sources, analyzed, categorized and ranked based on a defined internal procedure. Claims are reported by agents and service centers to the quality management office through the company’s (ERP) system. The industrial partner uses Issue Priority Ranking (IPR) methodology were all claims are being evaluated by experienced quality management staff based on well-defined criteria. Accordingly, claims are ranked and prioritized based on their importance and critical impact. Mainly, claims priority is ranked based on three major factors: (Gravity, Occurrence, and Impact). Gravityrepresents the consequences of the claim from customer and company perspectives, this includes the cost of resolving this issue and the safety impact on operator. The weight of this factor ranges between 1 to 10 points, where 1 is the lowest impact and 10 is the highest. Occurrence represents the number of incidents a specific claim has been witnessed in a specific period. The weight of this factor is similar to gravity. Impact, weighted by a value between 1 to 3 points, represents the repair efforts, time, repetition of the same work, and the overall impact of the claim on the reputation and image of the company.
IPR = Gravity * Occurance * Impact (1) As in equation 1 the multiplication of the three factors values will result in an IPR value between 1 and 300 points. An IPR value above 160 points is categorized to be at a very high priority, lower but still high priority if the IPR value more than 100 points, medium priority if the IPR value is above 35 points, and low priority if less than that.
Figure 1. Factors affecting claim ranking and the weight of every factor
Although such a process requires highly experienced people to evaluate and rank claims, the volume and velocity of claims reported, and their processing time is very critical from quality management perspective. It is important in such a high-value industry to resolve issues as soon as they
are reported. Early and fast processing of quality issues will be translated to a lower quality cost and will positively enhance the general business performance. Moreover, standardization of the evaluation process and ensuring consistency is vital to guarantee subjective IPR value every time. Also, given the machine learning capabilities and capacities to analyze several features (columns) at one dimension, aligned with large volume of data (rows) at the other dimension, will help to discover and analyze unseen factors, considering that the best quality practices focus on the claim root cause analysis. Additionally, utilizing technology whenever it is possible is very promising in industry, especially its capacity to work at any time (24/7) under any conditions and its ability to go deeper in analysis beyond human capacity. Leaving such task to machines will let human intelligence to focus on higher strategic issues.
Accordingly, this solution proposes utilizing supervised machine learning technology to replace human intervention in processing, evaluating, and categorizing claims. The current flow of claims from other involved parties is illustrated in fig. 2. In this figure, claims are flowing in from internal company quality product audit activities and issues that were detected during further production processes such as assembly (Cross Company Claims). The claims are pipelined in the company’s ERP system and human intervention is important at one point to evaluate claims. Based on the evaluation results, the quality management decides how to deal with every single claim to find the root cause of the problem, either by following the Eight Disciplines of Problem Solving (3I-8D methodology), or by just updating the quality checklists in order to ensure quality of next produced items, or by ignoring the issue, as it is occasional and occupies a very low IPR value.
The proposed solution aims at developing an automatic claim filtering and evaluation system based on developing a machine learning algorithm that can read, analyze, evaluate, and assign a ranking numeric
value (IPR) for every processed claim. In order to do so, historical data of already evaluated claims was used to train the model, later the model was deployed to evaluate new claims based on the experience learned by the historical data.
Figure 2. The flow of internal quality audit and cross-company claims to quality management
Figure 3. Development of machine learning model A dataset contains an adequate volume of claims’ data has been received from the industrial partner of this research project. Every claim in the dataset was described by 23 different input features, which will be used later to build up the machine learning model. The first step was to prepare the data for the machine learning platform, this included ensuring all features of the dataset are organized and data types are well defined. Additionally, some claims were not evaluated and had no IPR value. Therefore, these claims were evaluated manually by the quality management team at the partner company using a specially developed tool that facilitated the manual evaluation process. The top relevant 5 key input features in the dataset are defined in table 1 below.
Google Cloud Auto Machine Learning Platform (Google AutoML) was used in order to analyze data and develop the ML model. Google AutoML was developed by Google to help researchers in handling big data and building high accuracy ML models. The
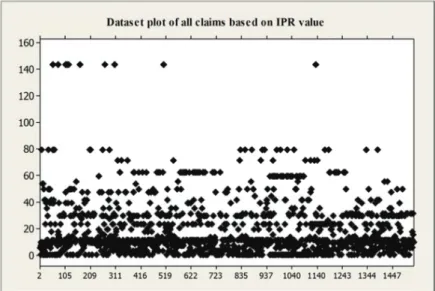
dataset was uploaded, input features were defined, and targeted values were selected. The data plot in fig 4 shows the distribution of the data, where the x-axis is the number of readings, and y-axis is the IPR value.
Figure 4. Dataset plot of all claims based on IPR value
Figure 5. Two approaches to predict the IPR value At this stage, two approaches were used to predict
the IPR using Google AutoML, the first approach by using the dataset including all input features as exported from the ERP system along with the accurate IPR value for each claim and then train the ML model to predict the IPR value for new un-evaluated claims. The second approach by training the ML model three independent times using the same data but every time targeting one of the three evaluation factors (gravity, occurrence, and Impact) and after apply equation 1 to calculate the IPR value. Figure 5 elaborates the two approaches.
In addition, to train a model to predict the IPR and the three factors, it is also important to categorize the
root source process of every claim. Therefore, a fifth ML model was trained based on the same dataset, but the targeted value was the category of the claim, so the trained model will also predict the claim category based on historical categorization of the claims. The categories which were defined in the dataset were: (Cutting, Bending, Welding, Painting, Assembly, Packaging, Transportation, and others). As a result, autoML was not only used to predict the priority of the claim, but also to categorize the root source process of the problem.
Results and discussion
Firstly, the initial training data used here consisting of 23 input features and 5 output variables. The input features included the details about every claim, the top important features were explained in table 1, while the output variables are defined in table 2.
Five machine learning models were trained successfully. Table 2 shows the training results and accuracy metrics for four regression models including (IPR, Gravity, Occurrence, and Impact). Table 3 shows the training results and classification accuracy metrics for Claim Category, which was trained as a classification model as the claim category could be either in process (a) or process (b), not in a middle point.
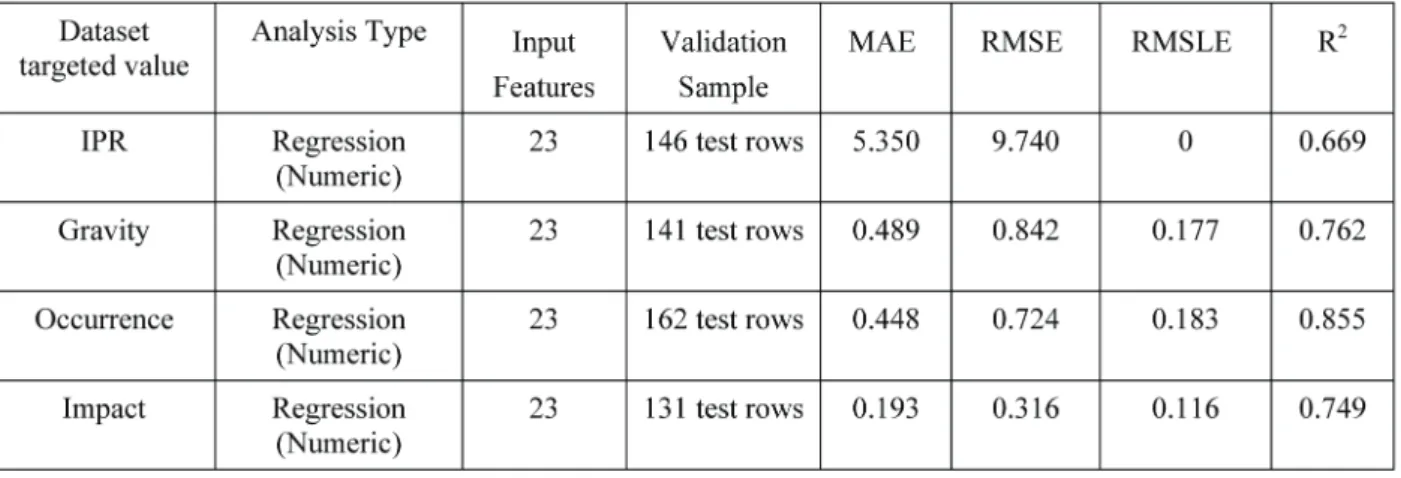
The input features were 23 for all models, and the validation sample was automatically selected and tested by the auto-machine learning platform. The mean absolute error (MAE), Root mean square error (RMSE), Root mean squared logarithmic error (RMSLE), and Determination Coefficient (R2) as elaborated in Table 2 are the accuracy metrics for the regression models, which are relevant for all values being predicted. For example, the MAE for the IPR is 5.350 and RMSE is 9.740 points respectively. Both metrics values elaborate accepted model quality given the range of IPR value is between 1 and 144 points. Which means in other words that the predicted IPR values are ± MAE or RMSE to the actual values.
Table 2. Model Training Accuracy Measures for IPR, Gravity, Occurrence, and Impact
Table 3. Model Training Accuracy Measures for Claim Category
In table 3, the area under the precision-recall (AUC-PR) curve and the area under the receiver operating characteristic (ROC) curve are close to 1, which indicates a high-quality classification model. Moreover, the model precision is about 86.6% which means that the model was correct in predicting the category of claims for 86.6% of the total claims population.
Accordingly, the values predicted for IPR, Gravity, Occurrence, and Impact is plotted in figure 6. For every actual value vise predicted. The histogram in black line represents the actual values. It is noticeable
that the IPR actual and predicted values are almost overlapping, which represents a higher accuracy of the model.
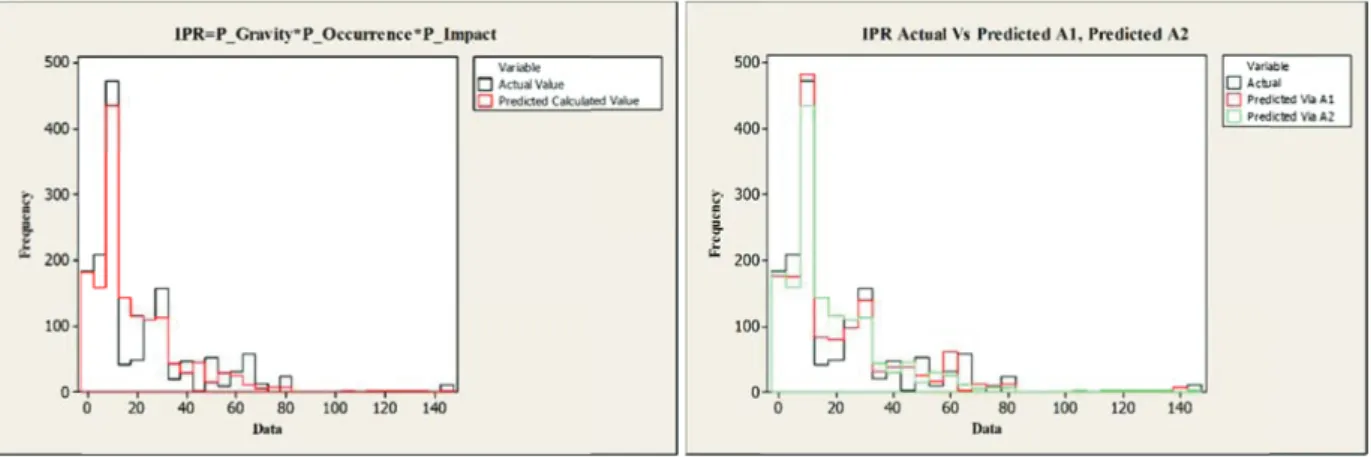
Calling back the two approaches to predict the IPR value as illustrated in fig 5, the second approach multiplies the predicted values for Gravity, Occurrence, and Impact according to equation 1. After calculations, the resulted IPR value was plotted in figure 7 (left) and the two IPR (Approach 1, Approach 2) were after plotted against the actual IPR as shown in figure 7 (right).
Figure 6. Actual Vs. Predicted plots for (IPR, Gravity, Occurrence, and Impact)
Figure 7. Actual Vs. Predicted plots for IPR according to Approach A(Left) and Actual Vs. Approach A Vs. Approach B for IPR (Right)
Conclusions
This research work first suggested machine learning as a tool to replace human involvement in evaluating customers’ claims by assigning a ranking value (IPR) for every claim and categorizing claims according to the problem root cause. Utilizing such technology will enhance the capabilities of quality management team to handle any volume of the claims data under any flow velocity. The benefits of such technology do not end by this, but also could be furtherly extended to link claims and defects to the relevant
manufacturing process/machine, so once a claim is reported to the quality management it will be processed by the model and instantly will be communicated to the relevant operators or managers.
One more result for this project is that the production quality checklists for the selected product became dynamically updated based on the top ten IPR value which is updated frequently. Such improvement enhanced the quality of processes and products.
Finally, it is important to highlight the affecting factors that control the quality and accuracy of the developed model. For example, the accuracy of the
model is strongly depending on the quality of the data originating at the first point where the problem or defect was first detected. Empty data rows or ambiguous data could forfeit important features that can help in predicting more accurate IPR value for the claim. Furthermore, it is also important to keep updating and maintaining the ML model by conducting periodical review sessions for the predicted IPR values and correct them when needed. Retraining the model using a larger volume of data will accumulate the model experience and though improve the model accuracy.
Acknowledgements
This work was supported by the Stipendium Hungaricum Programme and by the Mechanical Engineering Doctoral School, Szent István University, Gödöllő, Hungary.
Special thanks to CLAAS Hungaria Kft, especially to Mr. Robert Csombordi, Head of Quality Management, for their endless support in conducting this research work.
References
[1] Y. Duan, J. S. Edwards, és Y. K. Dwivedi, „Artificial intelligence for decision making in the era of Big Data – evolution, challenges and research agenda”, Int. J. Inf. Manag., köt. 48, o. 63–71, okt. 2019, doi: 10.1016/j.ijinfomgt.2019.01.021.
[2] K. M. Lee, J. Yoo, S.-W. Kim, J.-H. Lee, és J. Hong,„Autonomic machine learning platform”, Int. J. Inf. Manag., köt. 49, o. 491–501, dec. 2019, doi: 10.1016/J.IJINFOMGT.2019.07.003.
[3] I. Guyon és mtsai., „Analysis of the AutoML Challenge Series 2015–2018”, Springer, Cham, 2019, o. 177–219.
[4] L. Faes és mtsai., „Automated deep learning design for medical image classification by health-care professionals with no coding experience: a feasibility study”, Lancet Digit. Health, köt. 1, sz. 5, o. e232– e242, szept. 2019,
doi: 10.1016/s2589-7500(19)30108-6.
[5] I. SADGALI, N. SAEL, és F. BENABBOU, „Performance of machine learning techniques in the detection of financial frauds”, Procedia Comput. Sci., köt. 148, o. 45–54, jan. 2019,
doi: 10.1016/J.PROCS.2019.01.007.
[6] A. Lyutov, Y. Uygun, és M.-T. Hütt,„Managing workflow of customer requirements using machine learning”, Comput. Ind., köt. 109, o. 215–225, aug. 2019, doi: 10.1016/J.COMPIND.2019.04.010. [7] S. Arora, M. Joshi, és C. P. Rosé, „Identifying types of claims in online customer reviews”, 2009, o. 37, doi: 10.3115/1620853.1620865.
[8] B. Liu, „A Very Brief and Critical Discussion on AutoML”, sz. Ml, o. 1–5, 2018.
[9] S. Ramaswamy és N. DeClerck, „Customer Perception Analysis Using Deep Learning and NLP”, Procedia Comput. Sci., köt. 140, o. 170–178, jan. 2018, doi: 10.1016/J.PROCS.2018.10.326.
[10] B. A. Galitsky, M. P. González, és C. I. Chesñevar, „A novel approach for classifying customer complaints through graphs similarities in argumentative dialogues”, Decis. Support Syst., köt. 46, sz. 3, o. 717–729, febr. 2009,