© 2010 International Monetary Fund January 2010 IMF Country Report No. 10/13
[Month, Day], 2001 August 2, 2001
Senegal: Fourth Review Under the Policy Support Instrument and Second Review Under the
Exogenous Shocks Facility—Staff Report; Press Release
In the context of the Fourth Review Under the Policy Support Instrument and Second Review Under the Exogenous Shocks Facility, with Senegal, the following documents have been released and are included in this package:
• The staff report for the Fourth Review Under the Policy Support Instrument and Second Review and Augmentation of Access Under the Exogenous Shocks Facility Arrangement, prepared by a staff team of the IMF, following discussions that ended on November 19, 2009, with officials of Senegal on economic developments and policies. Based on information available at the time of these discussions, the staff report was completed on December 7, 2009. The views expressed in the staff report are those of the staff team and do not necessarily reflect the views of the Executive Board of the IMF.
• A Press Release on the completion of the reviews.
The documents listed below have been or will be separately released. Letter of Intent sent to the IMF by the authorities of Senegal*
Memorandum of Economic and Financial Policies by the authorities of Senegal* Technical Memorandum of Understanding*
*Also included in the Staff Report
The policy of publication of staff reports and other documents allows for the deletion of market-sensitive information.
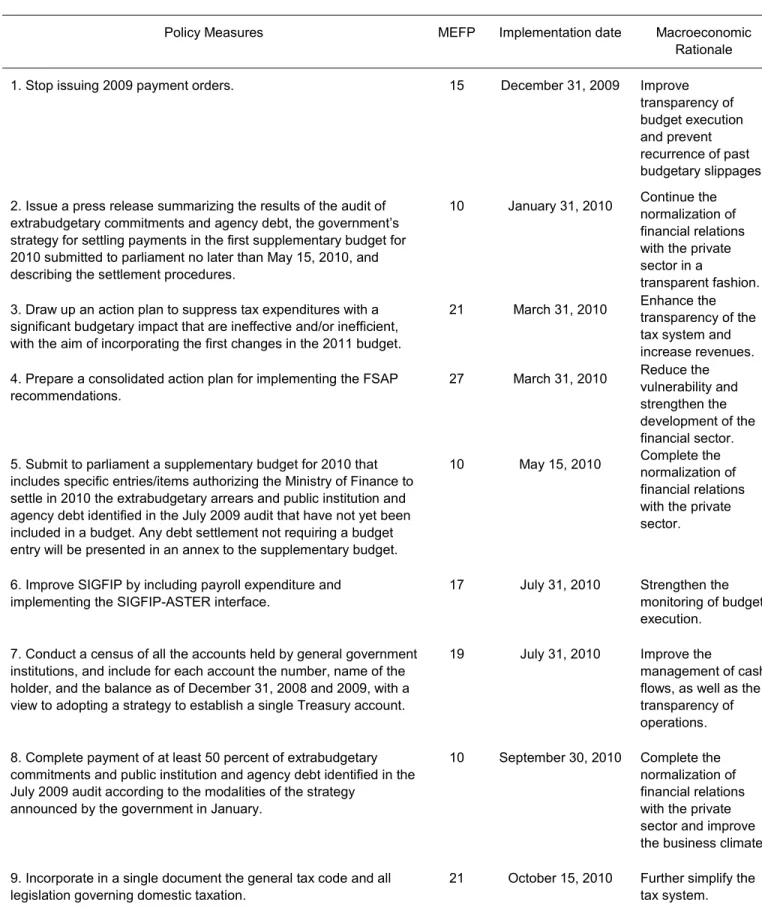
Copies of this report are available to the public from International Monetary Fund • Publication Services
700 19th Street, N.W. • Washington, D.C. 20431
Telephone: (202) 623-7430 • Telefax: (202) 623-7201
E-mail:
International Monetary Fund
INTERNATIONAL MONETARY FUND SENEGAL
Fourth Review Under the Policy Support Instrument and Second Review Under the Exogenous Shocks Facility
Prepared by the African Department (In consultation with other departments) Approved by Roger Nord and Dominique Desruelles
December 7, 2009
PSI/ESF Reviews. Staff recommends their completion. All quantitative assessment/ performance criteria have been met and most structural conditionality has been observed.
Program Discussions. Held in Dakar November 4–18, 2009. The team comprised
Mr. Funke (head), Mr. Lakwijk, Mr. Gitton (all AFR), Ms. Sancak (FAD), Mr. Painchaud (SPR), and Ms. Fichera (resident representative). Mr. Dieng (EXR) also joined the mission. The team met with Finance Minister Diop, Budget Minister Diop, Agriculture Minister Sarr, Energy Minister Sarr, International Cooperation and Infrastructure Minister Wade, BCEAO National Director Diop, other senior government officials, and representatives of development partners and the private sector.
Outreach and seminars: Mr. Nord (AFR) joined the mission at the beginning for outreach
related to the Regional Economic Outlook: Sub-Saharan Africa. The mission also met with representatives of trade unions and civil society. In two half-day seminars the authorities presented the findings of their studies on tax expenditure and the economic outlook, including the impact of the global financial crisis. The team made presentations on
(i) changes in the Fund’s financial architecture for low-income countries; (ii) changes in the low-income country debt sustainability framework and debt limits in Fund-supported programs, (iii) vulnerabilities of the Senegalese banking system; and (iv) the impact of cyclical fluctuations on government revenues.
2
Contents Page
Executive Summary ...3
I. Recent Economic Developments, Short-term Outlook, and Program Performance ...4
II. Recovering from the Global Financial Crisis ...8
III. Economic and Structural Policies ...12
A. Overview ...12
B. Macroeconomic Policies ...12
C. Scope for Easing Fiscal Policy ...13
D. Deepening PFM Structural Reforms ...14
E. Growth-Enhancing Structural Reforms ...16
IV. Program Issues and Risks ...17
V. Staff Appraisal ...18
Tables 1. Selected Economic and Financial Indicators, 2006–14 ...20
2. Balance of Payments, 2006–14 ...21
3. Government Financial Operations, 2006–14 ...22
4. Government Financial Operations, 2006–14 ...23
5. Monetary Survey, 2005–09 ...24
6. Financial Soundness Indicators for the Banking Sector, 2003–09 ...25
7. Quantitative Assessment Criteria (Performance Criteria) and Indicative Targets for 2009 ...26
8. Indicators of Capacity to Repay the Fund, 2008–20...27
Figures 1. Recent Macroeconomic Developments, 2003–09 ...5
2. Comparing Macroeconomic Developments During Global Economic Downturns ...9
3. Senegal, WAEMU, and SSA: Macroeconomic Developments and Outlook, 2004–10 ...10
4. Medium-Term Outlook, 2008–14 ...11
Boxes 1. Government Payment Delays, Extrabudgetary Spending, and Agency Debt ...6
2. Energy Sector Reform...16
Appendix I. Letter of Intent ...28
Attachment I. Memorandum of Financial Policies ...30
3
Executive Summary
Although the global financial crisis is having a marked impact on the Senegalese economy, program implementation has been satisfactory.
Economic developments: Real GDP growth is expected to slow to 1¼ percent in 2009. The
economic rebound in 2010 is projected to be gradual, tracking the global recovery, provided domestic reform momentum does not slip. Inflation is expected to be about 2 percent. Risks to the economic outlook are still high.
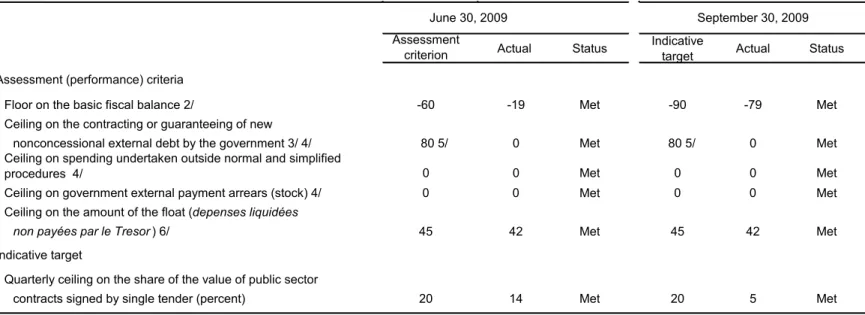
Program performance: All quantitative assessment (performance) criteria were met,
notably the targets for the fiscal deficit and the budgetary float. Fiscal policy was tighter during the first half of 2009 than foreseen in the program due to delays in financing. Structural reforms are broadly on track.
Priorities: Authorities and staff agreed that the priorities are to (i) use macroeconomic and structural policies to weather the impact of the global economic crisis, including shifting the fiscal stimulus to late 2009 and into 2010; (ii) finish normalizing the government’s financial relations with the private sector by regularizing extrabudgetary spending and paying public agency debt; (iii) continue to pursue structural reforms in public financial management (PFM) to enhance governance, transparency, and accountability; and (iv) press ahead with other growth-enhancing reforms, especially in the energy sector, in close collaboration with development partners.
Risks: The main risks relate to (i) the possibility that the international crisis will have a more enduring impact on growth; (ii) uncertainty about the available financing, which could lead to difficult trade-offs in prioritizing expenditure, and (iii) incomplete reform of the energy sector. Recurring governance and transparency issues could also affect the program, and ultimately economic growth.
4
MEFP ¶ 4
I. RECENT ECONOMIC DEVELOPMENTS,SHORT-TERM OUTLOOK, AND PROGRAM
PERFORMANCE
1. Structural challenges and the marked impact of the global financial crisis on the Senegalese economy are more than offsetting the positive impact of the reversal of last
year’s external and domestic shocks from higher food and fuel prices and rising payment
delays. The international crisis is being transmitted mainly through drops in export prices, and downward pressure on remittances, foreign direct investment, and tourism. As a result:
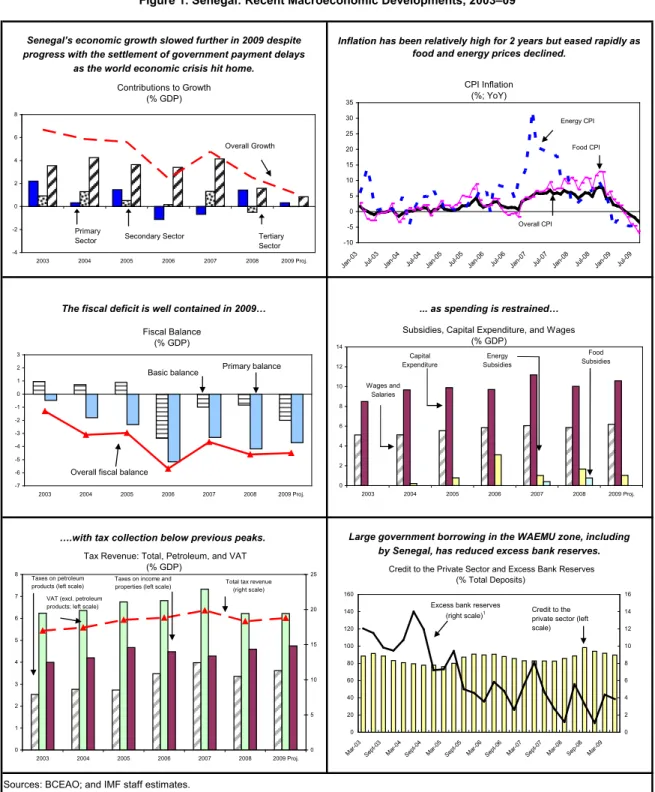
• Real GDP growth is expected to slow to 1¼ percent in 2009 from an already
depressed 2½ percent in 2008 (Figure 1). While the agricultural sector benefited from supportive policies and favorable weather during much of the year, most of the industrial and tertiary sectors
suffered from depressed demand at home and abroad.1
• Annual inflation turned negative in May, largely because food and energy prices fell. Core inflation has fallen less.
Electricity shortages and urban flooding also caused economic problems in the second half.
2. Despite difficult economic conditions, program
implementation has been broadly satisfactory. All quantitative
assessment criteria have been met, and good progress has been made with structural reforms. Faced with shortfalls in revenues and in financing (e.g., no privatization receipts and less bank financing with SONATEL shares as collateral), the authorities pulled back on spending. The end-June fiscal deficit target was met by a wide margin, and the budgetary float was below its ceiling (Box 1).
1 However, Industries Chimiques du Sénégal (ICS), Senegal’s largest company, which mainly
produces phosphoric acid (a fertilizer input), began to recover in 2009.
CPI Inflation (%; YoY) -6 -4 -2 0 2 4 6 8 Jan-03 Jul-03 Jan-04 Jul-04 Jan-05 Jul-05 Jan-06 Jul-06 Jan-07 Jul-07 Jan-08 Jul-08 Jan-09 Jul-09 Overall CPI Core CPI
5
Sources: BCEAO; and IMF staff estimates.
1 Difference between actual and required reserves, which are a percentage of deposits, short-term credit, and gross foreign claims. by Senegal, has reduced excess bank reserves. ….with tax collection below previous peaks.
progress with the settlement of government payment delays Inflation has been relatively high for 2 years but eased rapidly as food and energy prices declined.
... as spending is restrained…
Figure 1. Senegal: Recent Macroeconomic Developments, 2003–09
Senegal’s economic growth slowed further in 2009 despite
Large government borrowing in the WAEMU zone, including as the world economic crisis hit home.
The fiscal deficit is well contained in 2009…
Contributions to Growth (% GDP) -4 -2 0 2 4 6 8 2003 2004 2005 2006 2007 2008 2009 Proj. Primary
Sector Secondary Sector Tertiary Sector Overall Growth CPI Inflation (%; YoY) -10 -5 0 5 10 15 20 25 30 35 Jan-03 Jul-03 Jan-04 Jul-04 Jan-05 Jul-05 Jan-06 Jul-06 Jan-07 Jul-07 Jan-08 Jul-08 Jan-09 Jul-09 Overall CPI Energy CPI Food CPI Fiscal Balance (% GDP) -7 -6 -5 -4 -3 -2 -1 0 1 2 3 2003 2004 2005 2006 2007 2008 2009 Proj. Basic balance Primary balance
Overall fiscal balance
Subsidies, Capital Expenditure, and Wages (% GDP) 0 2 4 6 8 10 12 14 2003 2004 2005 2006 2007 2008 2009 Proj. Wages and Salaries Capital
Expenditure SubsidiesEnergy
Food Subsidies
Tax Revenue: Total, Petroleum, and VAT (% GDP) 0 1 2 3 4 5 6 7 8 2003 2004 2005 2006 2007 2008 2009 Proj. 0 5 10 15 20 25 Taxes on petroleum
products (left scale) VAT (excl. petroleum products; left scale)
Taxes on income and
properties (left scale) Total tax revenue (right scale)
Credit to the Private Sector and Excess Bank Reserves (% Total Deposits) 0 20 40 60 80 100 120 140 160 Mar-0 3 Sept-03 Mar-0 4 Sept-04 Mar-0 5 Sept-05 Mar-0 6 Sept-06 Mar-0 7 Sept-07 Mar-0 8 Sep-08 Mar-0 9 0 2 4 6 8 10 12 14 16 Credit to the private sector (left scale) Excess bank reserves
6
MEFP ¶ 5
Box 1. Government Payment Delays, Extrabudgetary Spending, and Agency Debt
Settlement has progressed and the stock of unpaid bills within the expenditure chain (the budgetary float) was normalized, having been reduced from CFAF 175 billion (3 percent of GDP) in October 2008 to below CFAF 45 billion (⅔ percent of GDP) in September (Table 7).1
Still to be done is settling extrabudgetary spending and agency debt:
• The audit completed in July 2009 identified extrabudgetary spending of CFAF 37 billion (0.6 percent of GDP).2
• The audit also revealed that public agencies owed the private sector CFAF 67 billion (1 percent of GDP). Additionally, blocked treasury accounts of nonfinancial public agencies are estimated at about CFAF 15 billion (¼ percent of GDP).
_________________
1 See Box 1 of the last Staff Report (Country Report No. 09/205, 6/8/2009) for previous developments.
2 This is less than initially estimated because the audit did not consider agency debt that has been
contracted following normal budgetary procedures to be extrabudgetary.
3. Structural reforms were broadly on track in 2009 (Text Table).In particular,a study on the composition and level of current tax
expenditures, which identified tax expenditures of over 3 percent of GDP, provides a solid basis for further analysis of how to protect government revenues and increase the fairness, performance, and integrity of the tax system. The recommendations of a technical audit and a technical assistance mission provide a good basis for improving the efficiency, reliability, and coverage of the budget monitoring system (SIGFIP). While the authorities are committed to settling extrabudgetary spending and paying agency debt, they are still finalizing the modalities. Progress with a budget accounting module has been slower than expected due to technical challenges, but budget flexibility and presentation have been improved. The authorities are committed to advance in these areas.
7
Structural Benchmarks, June 2009–December 2009 2
Policy Measures Implementation Target Date for Status
1. Decide whether extrabudgetary expenditure should be (i) proposed to Parliament for regularization in the 2010 budget; or (ii) rejected as invalid claims that will not be paid (see MEFP, ¶ 19).
July 31, 2009 Partially met
2. Complete a study on the basis for, and current level of,
tax expenditures (see MEFP, ¶ 21). September 30, 2009 Met
3. Complete an external audit of SIGFIP focused on the budget execution database and production of output tables (see MEFP, ¶ 17).
September 30, 2009 Met
4. Improve the flexibility and presentation of the budget
(see MEFP, ¶ 16). October 15, 2009 Partially met
5. Make the ASTER budget accounting module
operational (see MEFP, ¶ 18). October 31, 2009 In progress
6. Adopt provisions to transfer petroleum tax collection (FSAPP, Fonds de sécurisation des importations en produits pétroliers) to the DGID (see MEFP, ¶ 22).
October 31, 2009 Met
Sources: MEFP (June 2009) and staff assessment.
2 In addition, two structural benchmarks that were under way at the time of the Third PSI Review (an
8
II. RECOVERING FROM THE GLOBAL FINANCIAL CRISIS
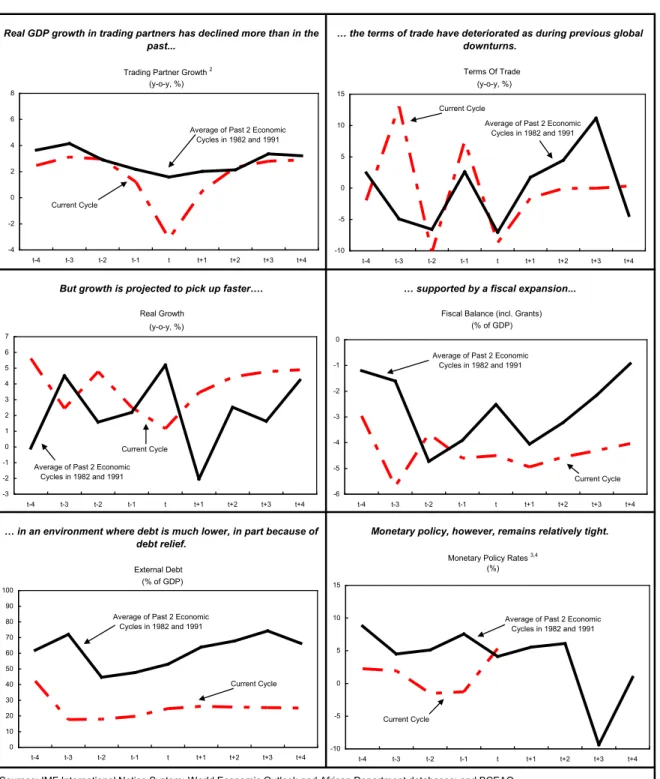
4. The economic rebound in 2010 is projected to be hesitant and gradual but somewhat more synchronized with global developments than during previous global downturns (Figure 2). The combined impact of the domestic and external shocks is somewhat stronger with regard to growth and the fiscal deficit than projected at the last review, but somewhat weaker with regard to the external sector.
• An economic growth rate of about 3½ percent should be possible in 2010 based on
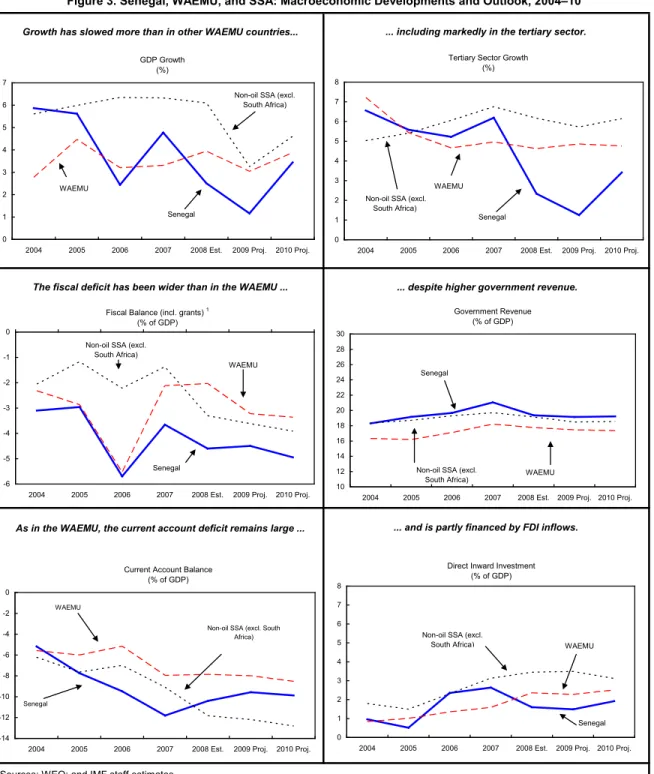
the projected recovery in the world economy, stabilization of remittances, settlement of extrabudgetary spending, and payment of agency debt. However, in 2010 growth in Senegal would still be weaker than in other WAEMU countries (Figure 3). Higher growth is necessary to make a significant dent in poverty. Over the medium term, broad-based structural reforms are needed to boost growth to above 5 percent (Figure 4).
• Inflation is likely to
return to the historical level of about
2 percent over the medium term as the effects of commodity price changes wane.
• The external current
account deficit
(including grants) is projected to stabilize over the medium term at under 10 percent of GDP. The narrowing
of the current account deficit in 2009 is due primarily to reduced imports related to subdued growth and lower food and fuel prices. The overall balance of payments is projected to be in deficit in 2009 (excluding the SDR inflow above the line) and in 2010, and to show small surpluses over the medium term.
5. There is still substantial uncertainty about the economic outlook. External risks include a slower than expected global recovery and the possibility that the full impact of the global crisis may be delayed and prolonged. Risks to growth prospects could also be
presented by financing constraints, e.g., in the regional market, that may limit the support fiscal policy can provide to the economy, delays in settling agency debt and extrabudgetary spending, and deepening challenges in the energy sector. Longstanding risks like weather and
2009 2010 2009 2010
GDP growth 1.2 3.4 -2.0 0.0
Consumer prices -0.8 1.8 -1.6 -0.4
Overall fiscal balance -4.5 -4.9 0.1 -1.0
Current account -573 -626 169 92
Capital and financial account 620 544 -65 -70
Of which: SDR allocation 94 0 94 0
Overall balance of payments 48 -82 104 22 Overall balance of payments,
excluding SDR allocation -47 -82 10 22
Sources: Tables 1 and 2; and Staff Report for 3rd PSI Review (6/8/09).
(Percent of GDP) (CFAF billions)
Change relative to previous review Selected Indicators, 2009-10
9
Figure 2. Senegal: Comparing Macroeconomic Developments During Global Economic Downturns1
Real GDP growth in trading partners has declined more than in the
past... … the terms of trade have deteriorated as during previous global downturns.
But growth is projected to pick up faster…. … supported by a fiscal expansion...
… in an environment where debt is much lower, in part because of
debt relief. Monetary policy, however, remains relatively tight.
4 The policy rate is the real normal discount rate (1978 - 1989), discount rate (1990 - 1993), and refinancing rate (1994 - present).
Sources: IMF International Notice System; World Economic Outlook and African Department databases; and BCEAO.
1 Comparison of current cycle with the average of the two previous global cycles in 1982 and 1991. The year t represents the year of the global
trough. For the current cycle, t + 1 through t + 4 are projections.
2 Main (export) trading partners are: France, United States, Germany, Japan, Italy, Netherlands, Belgium, United Kingdom, Spain, India, Brazil,
Canada, China, Cote d'Ivoire, Denmark, South Korea, Australia and Malaysia.
3 Data available through October 2009. The decline in t + 3 reflects the devaluation of the CFAF in 1994.
Trading Partner Growth 2
-4 -2 0 2 4 6 8 t-4 t-3 t-2 t-1 t t+1 t+2 t+3 t+4 (y-o-y, %)
Average of Past 2 Economic Cycles in 1982 and 1991 Current Cycle Terms Of Trade -10 -5 0 5 10 15 t-4 t-3 t-2 t-1 t t+1 t+2 t+3 t+4 (y-o-y, %)
Average of Past 2 Economic Cycles in 1982 and 1991 Current Cycle Real Growth -3 -2 -1 0 1 2 3 4 5 6 7 t-4 t-3 t-2 t-1 t t+1 t+2 t+3 t+4 (y-o-y, %)
Average of Past 2 Economic Cycles in 1982 and 1991
Current Cycle
Fiscal Balance (incl. Grants)
-6 -5 -4 -3 -2 -1 0 t-4 t-3 t-2 t-1 t t+1 t+2 t+3 t+4 (% of GDP)
Average of Past 2 Economic Cycles in 1982 and 1991 Current Cycle External Debt 0 10 20 30 40 50 60 70 80 90 100 t-4 t-3 t-2 t-1 t t+1 t+2 t+3 t+4 (% of GDP)
Average of Past 2 Economic Cycles in 1982 and 1991
Current Cycle
Monetary Policy Rates 3,4 (%) -10 -5 0 5 10 15 t-4 t-3 t-2 t-1 t t+1 t+2 t+3 t+4 Average of Past 2 Economic
Cycles in 1982 and 1991
10
Sources: WEO; and IMF staff estimates.
1 For 2006, fiscal balance excluding grants for WAEMU and non-oil SSA to eliminate effect of MDRI relief.
... including markedly in the tertiary sector.
Figure 3. Senegal, WAEMU, and SSA: Macroeconomic Developments and Outlook, 2004–10
Growth has slowed more than in other WAEMU countries...
... and is partly financed by FDI inflows. As in the WAEMU, the current account deficit remains large ...
The fiscal deficit has been wider than in the WAEMU ... ... despite higher government revenue.
GDP Growth (%) 0 1 2 3 4 5 6 7
2004 2005 2006 2007 2008 Est. 2009 Proj. 2010 Proj. Senegal
WAEMU
Non-oil SSA (excl. South Africa)
Tertiary Sector Growth (%) 0 1 2 3 4 5 6 7 8
2004 2005 2006 2007 2008 Est. 2009 Proj. 2010 Proj. Senegal
WAEMU Non-oil SSA (excl.
South Africa)
Fiscal Balance (incl. grants) 1
(% of GDP) -6 -5 -4 -3 -2 -1 0
2004 2005 2006 2007 2008 Est. 2009 Proj. 2010 Proj. Senegal
WAEMU Non-oil SSA (excl.
South Africa) Government Revenue (% of GDP) 10 12 14 16 18 20 22 24 26 28 30
2004 2005 2006 2007 2008 Est. 2009 Proj. 2010 Proj. Senegal
WAEMU Non-oil SSA (excl.
South Africa)
Current Account Balance (% of GDP) -14 -12 -10 -8 -6 -4 -2 0
2004 2005 2006 2007 2008 Est. 2009 Proj. 2010 Proj. Senegal
WAEMU
Non-oil SSA (excl. South Africa) 0 1 2 3 4 5 6 7 8
2004 2005 2006 2007 2008 Est. 2009 Proj. 2010 Proj. Senegal WAEMU Non-oil SSA (excl.
South Africa)
Direct Inward Investment (% of GDP)
11
...while the economy remains dependent on foreign assistance.
Sources: BCEAO; and IMF staff estimates.
Output growth is projected to be driven by the services sector, Inflation is projected to return to historical trends in the
Figure 4. Senegal: Medium-Term Outlook, 2008–14
recovery in ICS' production, and construction related to context of WAEMU membership and in the absence of
to be financed in part by FDI ... The fiscal balance will be contained…
while over time allowing public investment to rise. large investment projects. renewed energy and food price pressures.
The current account deficit is projected
...by controlling expenditure
Contributions to Growth (% GDP) -4 -2 0 2 4 6
2008 2009 Proj. 2010 Proj. 2011 Proj. 2012 Proj. 2013 Proj. 2014 Proj.
Primary
Sector Secondary Sector
Tertiary Sector Overall Growth CPI Inflation (%; YoY) -6 -4 -2 0 2 4 6 8 10 Jan-08May-0 8 Sep-08Jan-09May-0 9 Sep-09Jan-10May-1 0 Sep-10Jan-11May-1 1 Sep-11Jan-12May-1 2 Sep-12Jan-13May-1 3 Sep-13Jan-14May-1 4 Sep-14 Fiscal Balance (% GDP) -7 -6 -5 -4 -3 -2 -1 0 1 2 3
2008 2009 Proj. 2010 Proj. 2011 Proj. 2012 Proj. 2013 Proj. 2014 Proj.
Basic Fiscal Balance
Primary Balance
Overall Fiscal Balance
Energy/Food Subsidies, Capital Expenditure, and Wages
(% GDP) 0 2 4 6 8 10 12 14
2008 2009 Proj. 2010 Proj. 2011 Proj. 2012 Proj. 2013 Proj. 2014 Proj.
Wages and Salaries Capital Expenditure Energy Subsidies Food Subsidies
Current Account Deficit, FDI, and ICS Exports (% GDP) -14 -12 -10 -8 -6 -4 -2 0 2 4 6 8 10
2008 2009 Proj. 2010 Proj. 2011 Proj. 2012 Proj. 2013 Proj. 2014 Proj.
CAD (incl. official transfers) FDI ICS Exports Foreign Assistance (% GDP) 0 1 2 3 4 5 6 7 8 9
2008 2009 Proj. 2010 Proj. 2011 Proj. 2012 Proj. 2013 Proj. 2014 Proj.
Total Assistance (net)
Loans Debt Relief (flow) Grants
12
pests could affect the economy, as could commodity price shocks. Also, recurring governance and transparency concerns constitute risks to the program—and ultimately economic growth.
III. ECONOMIC AND STRUCTURAL POLICIES
A. Overview
6. Policy discussions focused on how to return quickly to higher growth and to
sustain reform momentum. Key issues are:
a. The scope and financing for countercyclical policies to mitigate the impact of the global financial crisis;
b. Full normalization of the government’s financial relations with the private sector; and
c. Structural reforms, in PFM and other areas, especially to make the energy sector more efficient and the financial sector stronger.
B. Macroeconomic Policies
7. In the year remaining until the PSI (Text Table) ends, the program is dedicated to helping Senegal surmount the impact of the global economic crisis and normalize the
government’s financial relations with the private sector.3
The PSI Program's Four Pillars
Containing the fiscal deficit to underpin macroeconomic stability and safeguard debt sustainability. Ιmproving fiscal governance and transparency so as to enhance policy credibility and sustain external assistance.
Εncouraging private sector activity by improving the business environment and addressing structural impediments to higher economic growth.
Limiting financial sector vulnerabilities and raising the sector’s contribution to the economy.
Given the continued economic weakness and some new financing, staff supports a moderate fiscal stimulus in late 2009 and 2010.The program’s structural conditionality covers, among other areas, regularization of extrabudgetary spending and payment of agency debt and further PFM reforms to help shore up revenues and prevent a recurrence of payment delays.
13
MEFP ¶ 8
MEFP ¶ 9
C. Scope for Easing Fiscal Policy
8. Fiscal policy in the first half of 2009 has been tighter than programmed, but financing available in the second half is expected to
create room to reach the programmed level of spending. Earlier in the year, spending was
constrained by delays in mobilizing financing and tight controls to avoid recurrence of
payment delays. Strong revenue administration efforts are helping to stabilize tax revenues as a share of GDP. The ten-year CFAF loan from the BCEAO (equal to the SDR allocation) has helped to offset other financing shortfalls.4
9. The 2010 budget aims to strike a balance between resource
Staff underscored the need to better manage liquidity.
constraints, investment needs, and protecting priority spending. The
2008
Est. Prog. Proj. Proj. budgetSuppl. 1
Total revenue and grants 21.8 21.6 22.1 21.9 21.9
Of which: Tax revenue 18.3 18.7 18.8 18.9 18.9
Total expenditure and net lending 26.6 26.3 26.6 26.9 27.6
-- -- -- -- 0.81
Current expenditure 16.5 15.8 16.0 15.6 …
Capital expenditure 10.0 10.4 10.6 11.2 …
Overall fiscal balance2 -4.6 -4.6 -4.5 -4.9 -5.7
Memorandum items:
Settlement of payment delays3 1.4 1.1 1.1 1.3 1.3
Above-the-line settlement -- -- -- -- 0.81
Below-the-line settlement 1.4 1.1 1.1 1.34 0.61
SDR allocation -- -- 1.4 --
--1 Illustrative outcome (70 percent of extrabudgetary commitments and agency debt settled). 2 Includes selected public sector entities balance.
3 Within the expenditure chain in 2008-09; extrabudgetary spending and agency debt in 2010. 4 Payments for extrabudgetary spending and agency debt included below the line pending
finalization of modalities and amounts.
Of which: Settlement of extra-budgetary spending and agency debt
2010 (Percent of GDP)
Fiscal Developments, 2008–10 2009
4 The terms are identical to those of the other WAEMU countries (maturity of 10 years, three-year
grace period, and interest rate of 3 percent). Part of the proceeds were used to repay an earlier bank loan to address payment delays.
14
MEFP ¶ 10, 11
MEFP ¶14-19 staff’s cautious macroeconomic assumptions suggest the deficit will reach about 5 percent of GDP (excluding settlement of extrabudgetary expenditure and payment of agency debt). While the authorities reiterated their commitment to a fiscal policy that would keep debt sustainable over the medium term, moderate short-run fiscal expansion in late 2009 and 2010 could support aggregate demand,as growth is still sluggish. A temporary increase in the deficit would not jeopardize Senegal’s hard-won gains in debt sustainability.5
10. Authorities and staff agreed that complete and transparent
Social expenditure is expected to increase, though somewhat below PRSP objectives.
settlement of extrabudgetary spending and payment of agency debt is criticalto fully restore private sector confidence and improve the
business environment.6
D. Deepening PFM Structural Reforms
The authorities intend to (i) announce their strategy by end-January 2010 (structural benchmark); (ii) submit to parliament a corresponding supplementary budget by mid-May (structural benchmark); and (iii) pay at least 50 percent of extrabudgetary
expenditure to be settled and agency debt by end-September 2010 (structural benchmark). If sufficient financing is available, the remainder will also be settled in 2010 but no later than in 2011. Staff stressed that expeditious clearing, supported by improved resource management, would also be advisable from a macroeconomic policy stance because the associated liquidity injection would support aggregate demand. Given the sluggish economic outlook and likely lower multipliers than with new expenditure, the risk of overheating would be limited. To the extent that financing constraints persist, some expenditure re-orientation may be necessary.
11. Reforms in PFM and accountability are still at the heart of
the authorities’ program (Text Table). The current reform agenda,
which aims to improve budget and treasury execution and transparency, specifies the following structural benchmarks:
• A timely end to the issuance of payment orders for the 2009 budget year to help prevent recurrence of payment delays.
• Better budget execution and accounting systems.
5 See Joint IMF/IDA Debt Sustainability Analysis (Country Report No. 09/205, Supplement 1). 6 Settlement of extrabudgetary spending and most agency debt will amount to new budgetary
spending. However, to the extent that agencies have incurred debt because their treasury accounts were blocked, settlement requires only below-the-line financing. Pending finalization of modalities and amounts, all payments for extrabudgetary spending and agency debt are for the time being recorded below the line, 70 percent in 2010 and 30 percent in 2011 (Tables 3 and 4).
15
Structural Benchmarks, 2009–10
Policy Measures MEFP § Implementation
date Macroeconomic Rationale
For the Fifth PSI Review
1. Stop issuing 2009 payment orders. 15 December 31,
2009 Improve transparency of budget execution and prevent recurrence of past budgetary slippages. 2. Issue a press release summarizing the results of the audit of
extrabudgetary commitments and agency debt, the government’s strategy for settling payments in the first supplementary budget of 2010 submitted to the parliament no later than May 15, 2010, and describing the settlement procedures.
10 January 31,
2010 Continue the normalization of financial relations with the private sector in a
transparent manner. 3. Draw up an action plan to suppress tax expenditures with a
significant budgetary impact that are ineffective and/or inefficient, with the aim of incorporating the first changes in the 2011 budget.
21 March 31, 2010 Enhance the transparency of the tax system and increase revenues.
4. Prepare a consolidated action plan to implement the FSAP
recommendations. 27 March 31, 2010 Reduce the vulnerability and strengthen the development of the financial sector. 5. Submit to the parliament a draft supplementary budget for
2010 that includes specific entries/ items authorizing the Ministry of Finance to settle in 2010 the extrabudgetary arrears and agency debt identified in the July 2009 audit that have not yet been included in a budget. Any debt settlement not requiring a budget entry will be presented in an annex.
10 May 15, 2010 Help normalize financial relations with the private sector.
For the Sixth PSI Review
1. Improve SIGFIP by including payroll expenditure and
implementing the SIGFIP-ASTER interface. 17 July 31, 2010 Strengthen monitoring of budget execution. 2. Conduct a census of all the accounts held by general
government institutions, and include for each account the number, name of the holder, and the balance as of
December 31, 2008 and 2009, with a view to adopting a strategy to establish a single Treasury account.
19 July 31, 2010 Improve cash management and transparency of operations.
3. Complete payment of at least 50 percent of extrabudgetary commitments and public institution and agency debt identified in the July 2009 audit according to the modalities of the strategy announced by the government in January.
10 September 30,
2010 Help normalize financial relations with the private sector and enhance the business climate. 4. Include in a single document the general tax code and all
16
MEFP ¶22- 26 MEFP ¶20-21 • Movement toward a single treasury account to improve cash management and make
operations more transparent.
12. The authorities are also reinforcing tax administration and following up on the findings of their recent tax expenditure study.
The study will be extended and an action plan will be prepared with a view to rationalizing some tax expenditures (structural benchmark).Making substantial progress in this area would lay the basis for higher revenues and additional fiscal space for priority spending.
E. Growth-Enhancing Structural Reforms
13. Despite continuing reforms in the energy sector—critical to raising Senegal’s
growth potential—the challenges are still significant (Box 2).A
comprehensive reform plan for the energy sector will need to be
carried out to limit fiscal costs and contain economic risks. The electricity company
SENELEC will need to be made financially sound on a permanent basis to ensure adequate electricity distribution.In collaboration with donors, the authorities are working out the details of a course of action that will require forceful measures from all actors, including implementing commitments to strengthen SENELEC, tariff adjustments, restructuring debt, and also financial support. Delays in comprehensive reforms would lead to risks for growth and future fiscal claims.
Box 2. Energy Sector Reform
A World Bank and Agence Française de Développement (AFD) emergency stock-taking mission in September 2009 identified several reasons for the energy sector’s current difficulties: technical failures leading to higher production costs, an inadequate tariff structure, insufficient marketing and operational performance, constraints in fuel supply, delays in energy-saving measures, large arrears (CFAF 70 billion, more than 1 percent of GDP, as of September 2009, more than half of which are back taxes), high debt-servicing costs weighing on cash flow, and weaknesses in internal governance.
The authorities are finalizing reforms in cooperation with the World Bank and the AFD.
The strategy will involve a number of measures, such as debt restructuring, audits, restoration of the production capacity of an important private supplier of SENELEC (GTI), tariff
adjustments to take into account supply and production costs while limiting the impact on the most vulnerable consumers, compliance with Bank and AFD conditionality to allow release of the second tranche of their financial assistance (CFAF 15 billion), and a contribution from the government budget in the form of debt restructuring and a budgetary transfer not received in 2008.
__________________
1Tariffs were raised by 17 percent in August 2008, lowered by 12 percent in January 2009 (with oil at
17
MEFP ¶29 Financial Soundness Indicators for the Banking Sector, 2002–09
(Percent)
2002 2003 2004 2005 2006 2007 2008 2009 Dec. Dec. Dec. Dec. Dec. Dec. Dec. Jun. Capital to risk-weighted assets 16.0 11.7 11.5 10.8 12.9 13.5 13.8 15.5 Loans to 5 largest borrowers to capital 104.9 141.0 131.4 179.9 103.7 88.5 86.9 91.8 Gross NPLs to total loans 1/ 18.5 13.3 12.6 11.9 16.8 18.6 19.1 18.0 NPLs net of provisions to total loans 1/ 5.5 3.3 3.4 3.2 8.8 8.6 9.3 9.8 NPLs net of provisions to capital 1/ 30.7 27.8 25.1 27.2 67.9 60.7 63.9 62.9 Total deposits to total liabilities 78.5 82.0 79.6 78.3 75.8 73.6 70.3 71.2 1/ Changes in 2006 due to ICS. It was recapitalized in 2008 but past provisions remain in place.
MEFP ¶15,30 MEFP ¶27-28 14. The direct impact of the global crisis on the banking system
has been small because of its limited international integration, but it
is affected by the slowdown in domestic growth. Nonperforming loans
have increased, and several banks are not meeting some prudential regulations (see text table with financial soundness indicators). Appropriately, the authorities have stepped up their high-frequency monitoring of financial sector risks. They also intend to take stock of various reform initiatives across different fora in an updated consolidated financial sector action plan (structural benchmark) taking into account progress since the 2004 national FSAP and the 2007 regional FSAP.
15. Raising Senegal’s growth potential requires faster action on
the authorities’ Accelerated Growth Strategy. Senegal’s ranking in
the Doing Business indicators has slipped. Priority reforms include
reducing the cost of transferring property, more investor protection and better contract enforcement, modernization of labor market legislation, simplification of customs
procedures, and creation of credit bureaus. A better business climate will also be conducive to mutually reinforcing benefits of several high-profile investment projects, including the airport, economic zone, and Dakar port.
16. The authorities expressed their commitment to strengthen
governance, including by publishing budget execution regularly, ensuring
that audit and regulatory agencies have adequate financial and human resources to fulfill their responsibilities, and revising the property law.
IV. PROGRAM ISSUES AND RISKS
17. The authorities welcomed the changes in the Fund’s policy on nonconcessional
borrowing and expressed interest in making use of its new flexibility. The authorities
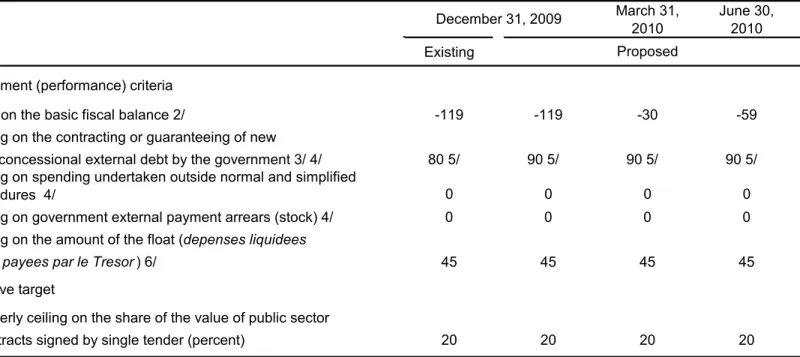
requested to raise the ceiling to finance the Dakar-Diamniadio toll highway project by CFAF 10 billion to CFAF 90 billion. The higher ceiling would allow them to accommodate possibly higher costs and issue a bond in international markets of US$200 million, typically seen as a minimum size for this type of transaction. Given Senegal’s low risk of debt distress, staff supports this request. The authorities also expressed interest to borrow more externally
18
on nonconcessional terms with untied limits, especially to finance economically and socially profitable projects.7
18. The definition of the basic fiscal balance in the TMU has been adjusted to exclude payments linked to settling extrabudgetary spending and agency debt. A yet unknown part of these transactions will need to be recorded above the line.
While Senegal is at low risk of debt distress, the CPIA and PEFA
indicators point to limited macroeconomic and PFM capacity, based in part on past budgetary slippages. Staff emphasized that reforms should focus on continued progress in PFM and governance, which would augur well for a more favorable assessment of Senegal’s capacity in the future. Staff also reiterated that nonconcessional borrowing for Senegal should for the time being stay linked to specific economically profitable projects for which sufficient concessional financing could not be mobilized. Untied limits could become possible after PFM improves.
19. The program entails risks related to the global financial crisis and delays in implementing domestic reforms:
• Financing of the deficit could be undermined by liquidity shortages in the regional bond market.
• Delays in regularizing outstanding payments could slow the recovery.
• A slower than expected global recovery, continued problems in the energy sector, or spill-overs from the recent announcement of Dubai World on a possible debt
standstill could suppress growth and put pressure on the fiscal target.
V. STAFF APPRAISAL
20. In difficult economic circumstances, program implementation has been broadly satisfactory. Faced with shortfalls in financing, the authorities carefully managed spending and also continued their structural reforms—both of which bode well for the future.
21. Economic developments next year will require continued vigilance. The outlook is more uncertain than usual, with risks rooted in the pace of the global recovery and
domestic governance and transparency problems. Continued forceful implementation of the program will go a long way to lay the groundwork for renewed growth in the next few years. 22. In coming months Senegal’s economic policies should continue to be geared to weathering the impact of the global economic crisis and normalizing the government’s financial relations with the private sector. Given continued economic weakness, shifting a modest fiscal expansion into 2010, in line with the 2010 budget under the staff’s
19
macroeconomic assumptions, would help support these objectives, while the authorities remain committed to a fiscal policy that preserves medium-term debt sustainability. It will be important to protect emergency and priority spending in the interest of the more vulnerable segments of the population. Better liquidity management is essential to minimize risks that fiscal policy will become procyclical.
23. Fast settlement of extrabudgetary spending and payment of agency debt is needed to fully normalize relations with the private sector. It is also critical to maintain the reform momentum in PFM and accountability. This will help prevent a recurrence of payment delays and improve the outcomes of budgetary processes.
24. Although Senegal is at low risk of debt distress, it needs to reinforce its fiscal
management capacity. Nonconcessional borrowing should for the time being stay linked to
specific economically profitable projects for which sufficient concessional financing could not be mobilized. Significant reforms to improve management capacity would pave the way for untied limits in the future.
25. In the energy sector, which is critical to raising Senegal’s growth potential,
further deterioration must be avoided. The authorities should diligently implement a
comprehensive strategy and guard against an energy sector drain on the budget, including by improving the efficiency of the sector and adjusting tariffs regularly to keep them aligned with costs.
26. The financial system has so far coped well with the global financial crisis, but because vulnerabilities could arise from an increase in nonperforming loans, credit
concentration, or a drying-up of liquidity, it will be essential to continually monitor them at both national and regional levels.
Staff recommends completion of the fourth review of the PSI and the second review of
the ESF arrangement. Implementation has been generally satisfactory, and major new
20
2007 2008 2010 2011 2012 2013 2014
Est. Prog. Proj.
National income and prices
GDP at constant prices 2.4 4.8 2.5 3.1 1.2 3.4 4.4 4.8 4.9 4.9 Of which: nonagriculture GDP 4.0 6.2 1.3 3.1 0.7 3.4 4.5 4.9 5.0 5.0 GDP deflator 4.0 5.5 7.1 2.1 -0.3 2.1 2.1 2.1 2.1 2.1 Consumer prices Annual average 2.1 5.9 5.8 0.8 -0.8 1.8 2.2 2.2 2.2 2.2 End of period 3.9 6.2 4.3 2.2 0.1 2.2 2.2 2.2 2.2 2.2 External sector
Exports, f.o.b. (CFA francs) 0.1 -3.7 14.1 -12.1 -12.6 14.6 6.7 5.5 7.6 7.7
Imports, f.o.b. (CFA francs) 9.6 19.5 7.7 -7.8 -11.9 10.8 8.3 6.4 7.8 7.6
Export volume -14.1 0.2 -3.8 9.0 6.3 10.5 4.0 4.0 4.6 5.0
Import volume 6.4 11.7 -2.7 2.5 -2.3 5.1 5.5 5.0 5.2 5.2
Terms of trade ("–" = deterioration) 13.0 -10.3 7.5 -11.0 -8.7 -1.6 -0.1 0.0 0.3 0.3
Nominal effective exchange rate 0.2 1.9 3.3 … … … …
Real effective exchange rate -0.2 5.3 5.3 … … … …
Money and credit
Net domestic assets 5.0 8.6 6.2 5.1 4.6 13.0 12.9 11.1 10.6 9.6
Domestic credit 5.8 11.5 7.3 5.5 5.1 13.4 13.3 11.5 10.9 9.9
Credit to the government (net) 3.0 4.9 -3.5 -1.6 1.8 8.3 6.4 4.7 3.9 2.7
Credit to the economy (percentage growth) 4.2 10.5 17.2 10.0 4.6 7.5 10.4 10.6 11.2 11.6
Government financial operations
Revenue 19.7 21.1 19.4 19.2 19.4 19.6 19.9 20.2 20.3 20.5
Grants 1.5 2.6 2.4 2.4 2.7 2.3 2.3 2.3 2.3 2.3
Total expenditure and net lending 27.2 27.6 26.6 26.3 26.6 26.9 26.7 26.7 26.6 26.8
Overall fiscal surplus (+) or deficit (–)
Payment order basis, excluding grants -7.2 -6.2 -7.0 -7.1 -7.2 -7.3 -6.8 -6.6 -6.3 -6.2
Payment order basis, including grants -5.7 -3.7 -4.6 -4.6 -4.5 -4.9 -4.6 -4.3 -4.0 -4.0
Primary fiscal balance 1/ -5.2 -3.3 -4.2 -3.7 -3.7 -4.1 -3.7 -3.3 -3.0 -2.9
Basic fiscal balance 2/ -3.4 -1.0 -0.8 -1.9 -2.0 -1.9 -1.4 -1.2 -1.0 -0.8
Gross domestic investment 28.2 32.1 31.5 27.6 29.8 30.9 31.5 32.0 32.4 32.9
Government 9.7 11.2 10.0 10.4 10.6 11.2 11.2 11.4 11.3 11.5
Nongovernment 18.5 21.0 21.5 17.1 19.2 19.6 20.3 20.6 21.1 21.4
Gross domestic savings 10.7 9.8 9.8 7.8 10.6 11.8 12.3 13.0 13.3 13.8
Government 3.4 7.1 5.0 6.3 6.4 7.3 7.6 8.2 8.4 8.8
Nongovernment 7.3 2.6 4.7 1.5 4.3 4.5 4.7 4.8 4.9 5.0
Gross national savings 18.7 20.3 21.1 15.7 20.2 21.0 21.8 22.5 22.8 23.3
External current account deficit (–)
Including current official transfers -9.5 -11.8 -10.4 -11.8 -9.6 -9.9 -9.7 -9.5 -9.6 -9.6
Excluding current official transfers -10.5 -13.2 -11.4 -13.0 -10.9 -10.8 -10.6 -10.4 -10.5 -10.5
Central government domestic debt 3/ 4.3 5.6 4.4 3.7 6.1 7.0 9.9 11.7 13.1 13.9
External public debt (nominal) 3/ 4/ 17.7 17.9 19.7 23.4 24.7 26.1 25.7 25.3 25.1 25.3
External public debt service 4/
Percent of exports 4.2 3.4 2.7 4.8 3.9 4.2 7.3 7.0 6.7 5.4
Percent of government revenue 5.4 4.1 3.4 5.2 4.2 4.8 8.2 7.8 7.3 6.0
Gross domestic product (CFAF billions) 4,893 5,408 5,935 6,264 5,983 6,336 6,756 7,230 7,743 8,292
Sources: Senegalese authorities; and IMF staff estimates and projections.
1/ Defined as total revenue and grants minus total expenditure and net lending, excluding interest expenditure.
2/ Defined as total revenue minus total expenditure and net lending, excluding externally financed capital expenditure, on-lending, and expenditure financed with HIPC Initiative and MDRI assistance.
3/ Debt outstanding at year-end.
4/ After HIPC and MDRI (from 2006) debt relief.
(Annual percentage change)
(Changes in percent of beginning-of-year broad money, unless otherwise indicated)
(Percent of GDP, unless otherwise indicated) Proj. 2009
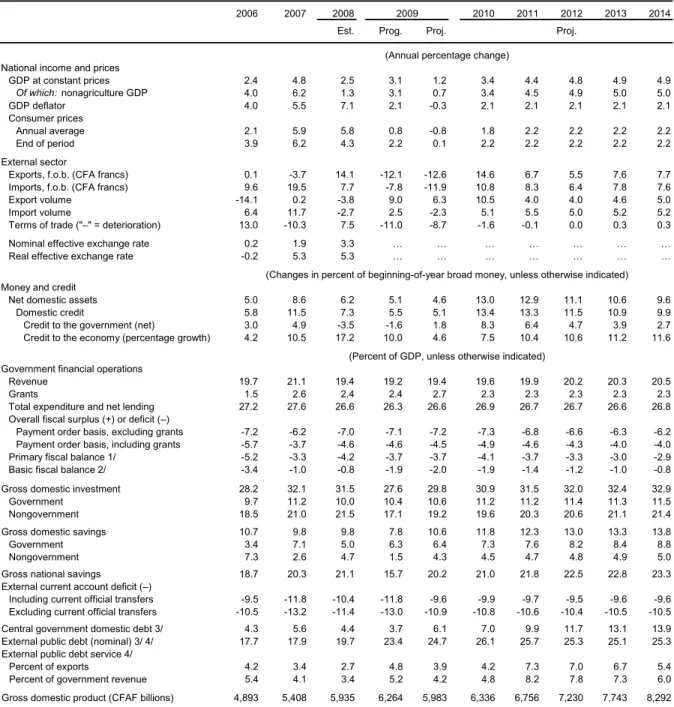
Table 1. Senegal: Selected Economic and Financial Indicators, 2006–14
21 2007 2008 2009 2010 2011 2012 2013 2014 Est. Current account -464 -638 -617 -573 -626 -656 -688 -742 -799 Balance on goods -836 -1,193 -1,234 -1,093 -1,181 -1,294 -1,386 -1,496 -1,610 Exports, f.o.b. 833 803 916 800 917 979 1,032 1,110 1,196 Imports, f.o.b. -1,670 -1,996 -2,150 -1,893 -2,098 -2,272 -2,419 -2,607 -2,806
Services and incomes (net) -65 -64 -103 -105 -89 -73 -60 -59 -64
Credits 512 671 671 619 650 694 756 817 876
Debits -577 -734 -774 -724 -740 -768 -816 -876 -941
Of which: interest on public debt -36 -24 -24 -26 -31 -31 -31 -30 -30
Unrequited current transfers (net) 438 618 720 625 645 711 758 813 872
Private (net) 1/ 409 566 685 568 606 674 717 768 822
Public (net) 28 52 35 57 39 36 41 46 50
Of which: budgetary grants 9 53 38 61 41 38 41 44 47
Capital and financial account 520 690 512 620 544 678 724 803 873
Capital account 1,234 182 109 109 114 122 130 139 149
Private capital transfers 7 7 7 7 7 8 8 8 8
Project grants 64 86 101 101 107 114 122 131 140
Debt cancellation and other transfers 2/ 3/ 1,163 89 0 0 0 0 0 0 0
Financial account -714 508 404 512 430 556 594 664 725
Direct investment 110 131 82 78 114 169 187 219 251
Portfolio investment -11 29 0 23 32 87 71 67 60
Other investment -812 348 321 411 283 300 336 378 414
Public sector (net) -1,021 114 307 352 154 101 114 131 180
Of which: disbursements 145 154 260 402 206 191 207 226 253 program loans 39 19 70 63 30 17 18 19 20 project loans 107 138 192 155 176 192 207 225 251 other -3 -2 -2 184 0 -18 -18 -18 -18 Of which: SDR allocation 0 0 0 94 0 0 0 0 0 amortization -1,166 -54 -44 -50 -52 -89 -93 -95 -73
Private sector (net) 173 254 105 59 130 198 221 247 234
Errors and omissions 36 -20 -91 0 0 0 0 0 0
Overall balance 57 51 -105 48 -82 22 36 60 74
Financing -57 -51 105 -72 58 -22 -36 -60 -74
Net foreign assets (BCEAO) -83 -75 -8 -86 46 -33 -48 -71 -84
Net use of Fund resources -66 0 17 24 0 -2 -3 -3 -9
Purchases/disbursements 11 0 17 24 0 0 0 0 0
Repurchases/repayments -77 0 0 0 0 -2 -3 -3 -9
Other -16 -75 -25 -110 46 -32 -46 -69 -75
Deposit money banks -37 3 98 -5 -6 -6 -6 -7 -7
Exceptional financing 3/ 63 21 16 20 18 17 18 17 17
Residual financing gap 4/ 0 0 0 24 24 0 0 0 0
Memorandum items:
Current account balance
Including current official transfers (percent of GDP) -9.5 -11.8 -10.4 -9.6 -9.9 -9.7 -9.5 -9.6 -9.6
Excluding current official transfers (percent of GDP) -10.5 -13.2 -11.4 -10.9 -10.8 -10.6 -10.4 -10.5 -10.5
Gross official reserves (imputed reserves, billions of US$) 1.3 1.6 1.5 1.8 1.7 1.8 1.9 2.0 2.1
(percent of broad money) 37.8 37.2 37.1 39.0 33.2 30.2 28.2 26.9 25.9
WAEMU gross official reserves (billions of US$) 8.1 10.7 10.5 … … … …
(percent of broad money) 57.5 57.8 56.0 … … … …
(months of WAEMU imports of GNFS) 5.5 5.9 6.4 … … … …
Gross domestic product 4,893 5,408 5,935 5,983 6,336 6,756 7,230 7,743 8,292
Sources: Central Bank of West African States (BCEAO); and IMF staff estimates and projections. 1/ Upwardly revised from 2008 based on a new survey of workers' remittances.
2/ Includes receipts from sale of a telecom license in 2007. 3/ Includes MDRI stock debt relief in 2006.
4/ Financing gap in 2009 and 2010 to be filled with ESF drawings.
(CFAF billions, unless otherwise indicated)
Table 2. Senegal: Balance of Payments, 2006–14
2006
22
2011 2012 2013 2014
Est. Prog. Proj. Proj.
Total revenue and grants 1,036 1,277 1,293 1,354 1,323 1,390 1,495 1,621 1,750 1,890
Revenue 963 1,139 1,153 1,201 1,160 1,242 1,343 1,458 1,575 1,703
Tax revenue 922 1,088 1,088 1,172 1,125 1,199 1,297 1,409 1,523 1,647
Income tax 219 232 273 302 284 300 326 356 388 423
Taxes on goods and services 533 628 616 648 625 663 715 772 838 908
Taxes on petroleum products 170 215 199 222 216 235 256 282 297 315
Nontax revenue 41 51 65 30 36 43 46 49 52 56
Grants 73 138 140 153 162 148 152 163 174 187
Budgetary 9 53 38 51 61 41 38 41 44 47
Budgeted development projects 64 86 101 101 101 107 114 122 131 140
Total expenditure and net lending 1,331 1,491 1,579 1,645 1,592 1,703 1,803 1,932 2,062 2,218
Current expenditure 829 881 979 988 957 989 1,048 1,111 1,189 1,264
Wages and salaries 1/ 286 327 348 389 370 397 419 448 480 514
Interest due 42 34 39 60 48 53 58 71 81 91
Of which: external 2/ 36 24 24 36 26 31 31 31 30 30
Other current expenditure 500 519 593 540 539 539 572 592 628 659
Transfers and subsidies 3/ 308 287 333 270 270 250 267 267 282 289
Of which: SAR and butane subsidy 66 55 69 44 44 0 0 0 0 0
Of which: SENELEC 86 0 30 18 18 0 0 0 0 0
Of which: Food subsidies 0 21 46 0 0 0 0 0 0 0
Goods and services 186 217 239 256 256 277 293 313 335 358
HIPC and MDRI current spending 7 15 21 13 13 12 12 12 11 11
Capital expenditure 4/ 475 605 595 655 633 713 755 821 873 954
Domestically financed 337 392 314 408 386 439 459 503 529 576
HIPC and MDRI-financed 26 60 63 54 42 48 48 47 46 46
Non-HIPC/MDRI financed 311 331 251 354 344 392 412 456 484 530
Externally financed 138 213 281 247 247 273 295 318 344 378
Net lending 27 5 5 2 2 2 0 0 0 0
Of which: On-lending 33 10 12 10 10 10 11 11 12 13
Selected public sector entities balance 5/ 16 16 13 0 0 0 0 0 0 0
Primary fiscal balance -236 -163 -235 -231 -221 -260 -251 -240 -232 -237
Overall fiscal balance (including grants) -279 -198 -273 -291 -269 -313 -308 -311 -313 -328
Overall fiscal balance (excluding grants) -352 -336 -413 -444 -431 -462 -461 -474 -487 -515
Basic fiscal balance 6/ -165 -54 -50 -119 -119 -119 -95 -86 -74 -67
Financing 279 198 273 291 269 313 308 311 313 328 External financing 121 131 224 263 292 191 189 181 191 233 Drawings 146 156 262 219 218 206 209 225 244 271 Program loans 39 19 70 64 63 30 17 18 19 20 Project loans 107 138 192 155 155 176 192 207 225 251 Amortization due -58 -54 -44 -56 -50 -52 -89 -93 -95 -73
Debt relief and HIPC Initiative assistance 41 21 16 22 20 18 17 18 17 17
T-bills and bonds issued in WAEMU -8 8 -9 -2 14 20 70 49 43 36
Nonconcessional loans for infrastructure development 0 0 0 80 90 0 -18 -18 -18 -18
Domestic financing 158 58 124 46 19 182 156 130 121 95
Banking system 7/ 128 98 -46 -33 36 182 156 131 122 96
Of which: T-bills and bonds 23 136 -16 -57 -26 69 178 151 136 113
Nonbank financing 30 -40 169 78 -17 -1 -1 -1 -1 -1
Settlement of payment delays 8/ 0 0 -84 -66 -66 -83 -36 0 0 0
Errors and omissions -1 9 9 0 0 0 0 0 0 0
Financing gap 9/ 0 0 0 48 24 24 0 0 0 0
Memorandum items:
Budgetary float (program definition) 58 55 66 45 45 45 45 45 45 45
New issues of government securities ... 183 131 80 127 177 ... ... ... ...
Priority expenditure (percent of total expenditure) 10/ 31 32 33 36 34 35 … … … …
Gross domestic product 4,893 5,408 5,935 6,264 5,983 6,336 6,756 7,230 7,743 8,292
Sources: Senegalese authorities; and IMF staff estimates and projections.
1/ Excludes project-related wages and salaries, which are included in capital spending, and the salaries of autonomous agencies and health and education contractual workers, which are included in transfers and subsidies.
2/ From 2006 on, reflects post-MDRI debt service schedule.
3/ Excludes subsidies aimed at sector development policies, which are included in capital spending.
5/ Local governments, autonomous public sector entities (e.g., hospitals, universities), and the civil servants pension fund (FNR).
6/ Total revenue minus total expenditure and net lending, excluding externally financed capital expenditure, on-lending, and HIPC/MDRI expenditure. 7/ Includes the 10-year CFAF loan from the BCEAO in 2009 equal to the general SDR allocation.
8/ Within the expenditure chain in 2008-09; extrabudgetary spending and agency debt in 2010 (70 percent) and 2011 (30 percent). 9/ Financing gap in 2009 and 2010 to be filled with ESF drawings.
10/ Defined as expenditures on health, education, environment, the judiciary, social development, sewage, and rural irrigation. 2007
2006 2008 2010
4/ Includes recapitalization of SENELEC. The government provided CFAF 65 billion in 2007 under domestically-financed capital expenditure, while budget support by the World Bank and France in 2008-10 specifically earmarked for the recapitalization is being provided under externally-financed capital expenditure.
(Billions of CFA francs, unless otherwise indicated) Table 3. Senegal: Government Financial Operations, 2006–14
2009
23
2010 2011 2012 2013 2014 Est. Prog. Proj.
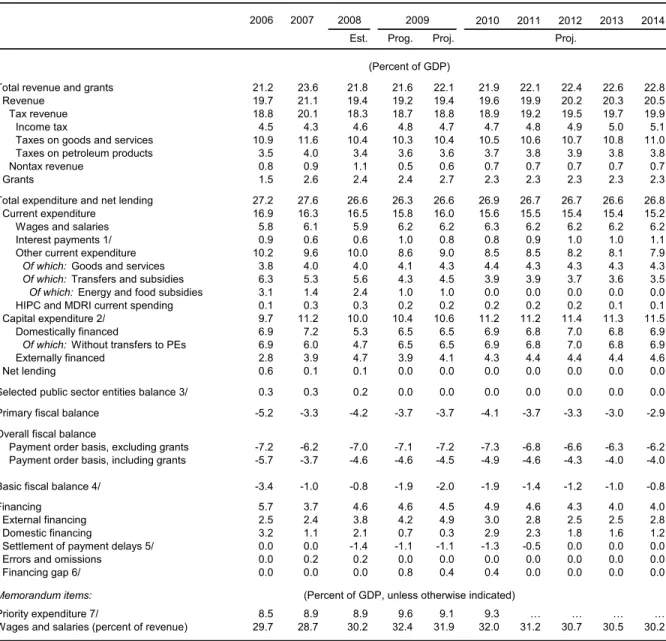
Total revenue and grants 21.2 23.6 21.8 21.6 22.1 21.9 22.1 22.4 22.6 22.8
Revenue 19.7 21.1 19.4 19.2 19.4 19.6 19.9 20.2 20.3 20.5
Tax revenue 18.8 20.1 18.3 18.7 18.8 18.9 19.2 19.5 19.7 19.9
Income tax 4.5 4.3 4.6 4.8 4.7 4.7 4.8 4.9 5.0 5.1
Taxes on goods and services 10.9 11.6 10.4 10.3 10.4 10.5 10.6 10.7 10.8 11.0 Taxes on petroleum products 3.5 4.0 3.4 3.6 3.6 3.7 3.8 3.9 3.8 3.8
Nontax revenue 0.8 0.9 1.1 0.5 0.6 0.7 0.7 0.7 0.7 0.7
Grants 1.5 2.6 2.4 2.4 2.7 2.3 2.3 2.3 2.3 2.3
Total expenditure and net lending 27.2 27.6 26.6 26.3 26.6 26.9 26.7 26.7 26.6 26.8 Current expenditure 16.9 16.3 16.5 15.8 16.0 15.6 15.5 15.4 15.4 15.2
Wages and salaries 5.8 6.1 5.9 6.2 6.2 6.3 6.2 6.2 6.2 6.2
Interest payments 1/ 0.9 0.6 0.6 1.0 0.8 0.8 0.9 1.0 1.0 1.1
Other current expenditure 10.2 9.6 10.0 8.6 9.0 8.5 8.5 8.2 8.1 7.9 Of which: Goods and services 3.8 4.0 4.0 4.1 4.3 4.4 4.3 4.3 4.3 4.3 Of which: Transfers and subsidies 6.3 5.3 5.6 4.3 4.5 3.9 3.9 3.7 3.6 3.5 Of which: Energy and food subsidies 3.1 1.4 2.4 1.0 1.0 0.0 0.0 0.0 0.0 0.0 HIPC and MDRI current spending 0.1 0.3 0.3 0.2 0.2 0.2 0.2 0.2 0.1 0.1 Capital expenditure 2/ 9.7 11.2 10.0 10.4 10.6 11.2 11.2 11.4 11.3 11.5
Domestically financed 6.9 7.2 5.3 6.5 6.5 6.9 6.8 7.0 6.8 6.9
Of which: Without transfers to PEs 6.9 6.0 4.7 6.5 6.5 6.9 6.8 7.0 6.8 6.9
Externally financed 2.8 3.9 4.7 3.9 4.1 4.3 4.4 4.4 4.4 4.6
Net lending 0.6 0.1 0.1 0.0 0.0 0.0 0.0 0.0 0.0 0.0
Selected public sector entities balance 3/ 0.3 0.3 0.2 0.0 0.0 0.0 0.0 0.0 0.0 0.0 Primary fiscal balance -5.2 -3.3 -4.2 -3.7 -3.7 -4.1 -3.7 -3.3 -3.0 -2.9 Overall fiscal balance
Payment order basis, excluding grants -7.2 -6.2 -7.0 -7.1 -7.2 -7.3 -6.8 -6.6 -6.3 -6.2 Payment order basis, including grants -5.7 -3.7 -4.6 -4.6 -4.5 -4.9 -4.6 -4.3 -4.0 -4.0 Basic fiscal balance 4/ -3.4 -1.0 -0.8 -1.9 -2.0 -1.9 -1.4 -1.2 -1.0 -0.8
Financing 5.7 3.7 4.6 4.6 4.5 4.9 4.6 4.3 4.0 4.0
External financing 2.5 2.4 3.8 4.2 4.9 3.0 2.8 2.5 2.5 2.8
Domestic financing 3.2 1.1 2.1 0.7 0.3 2.9 2.3 1.8 1.6 1.2
Settlement of payment delays 5/ 0.0 0.0 -1.4 -1.1 -1.1 -1.3 -0.5 0.0 0.0 0.0
Errors and omissions 0.0 0.2 0.2 0.0 0.0 0.0 0.0 0.0 0.0 0.0
Financing gap 6/ 0.0 0.0 0.0 0.8 0.4 0.4 0.0 0.0 0.0 0.0
Memorandum items:
Priority expenditure 7/ 8.5 8.9 8.9 9.6 9.1 9.3 … … … …
Wages and salaries (percent of revenue) 29.7 28.7 30.2 32.4 31.9 32.0 31.2 30.7 30.5 30.2 Sources: Senegalese authorities; and IMF staff estimates and projections.
1/ From 2006 on, reflects post-MDRI debt service schedule.
3/ Local governments, autonomous public sector entities (e.g. hospitals, universities), and the civil servants pension fund (FNR). 4/ Defined as total revenue minus total expenditure and net lending, excluding externally financed capital expenditure, on-lending,
and HIPC/MDRI expenditure.
5/ Within the expenditure chain in 2008-09; extrabudgetary spending and agency debt in 2010 (70 percent) and 2011 (30 percent). 6/ Financing gap in 2009 and 2010 to be filled with ESF drawings.
7/ Defined as expenditures on health, education, environment, the judiciary, social development, sewage, and rural irrigation. Table 4. Senegal: Government Financial Operations, 2006–14
(Percent of GDP)
(Percent of GDP, unless otherwise indicated) 2006 2007 2008 2009
Proj.
2/ Includes SENELEC recapitalization. The government provided CFAF 65 billion in 2007 under domestically-financed capital expenditure, while earmarked budget support by the World Bank and France in 2008-10 is being provided under externally-financed capital expenditure.
24
2007 2008 2009
Est. Proj.
Net foreign assets 660 780 851 762 854
Central Bank of West African States (BCEAO) 487 569 644 653 739
Commercial banks 173 210 207 109 115
Net domestic assets 894 972 1,122 1,245 1,338
Net domestic credit 1,032 1,122 1,324 1,467 1,570
Net credit to the government -35 11 96 28 64
Central bank 84 45 55 -14 8
Commercial banks -123 -46 21 33 47
Other institutions 4 12 20 9 10
Credit to the economy 1,067 1,111 1,228 1,440 1,506
Of which: crop credit 10 9 10 5 5
Other items (net) -138 -151 -202 -223 -232
Broad money (M2) 1,553 1,751 1,973 2,007 2,192
Currency outside banks 378 453 485 474 473
Total deposits 1,176 1,298 1,488 1,532 1,718
Demand deposits 593 652 784 779 905
Time deposits 582 646 705 754 813
Net foreign assets -1.2 7.7 4.1 -4.5 4.6
BCEAO 0.7 5.3 4.3 0.4 4.3
Commercial banks -1.8 2.4 -0.2 -5.0 0.3
Net domestic assets 8.6 5.0 8.6 6.2 4.6
Net credit to the government -4.1 3.0 4.9 -3.5 1.8
Credit to the economy 14.5 2.9 6.7 10.7 3.3
Other items (net) -1.8 -0.8 -2.9 -1.0 -0.5
Broad money (M2) 7.4 12.7 12.7 1.7 9.2
Memorandum items:
Velocity (GDP/M2; end of period) 3.0 2.8 2.7 3.0 2.7
Nominal GDP growth (percentage growth) 8.3 6.5 10.5 9.8 0.8 Credit to the economy (percentage growth) 24.5 4.2 10.5 17.2 4.6 Credit to the economy/GDP (percent) 23.2 22.7 22.7 24.3 25.2 Variation of net credit to the government (from
previous year; CFAF billions) -59.2 46.3 85.1 -68.3 36.0 Central bank refinance rate (eop/latest; percent) 4.00 4.25 4.25 4.75 4.25 Sources: Senegalese authorities; and IMF staff estimates and projections.
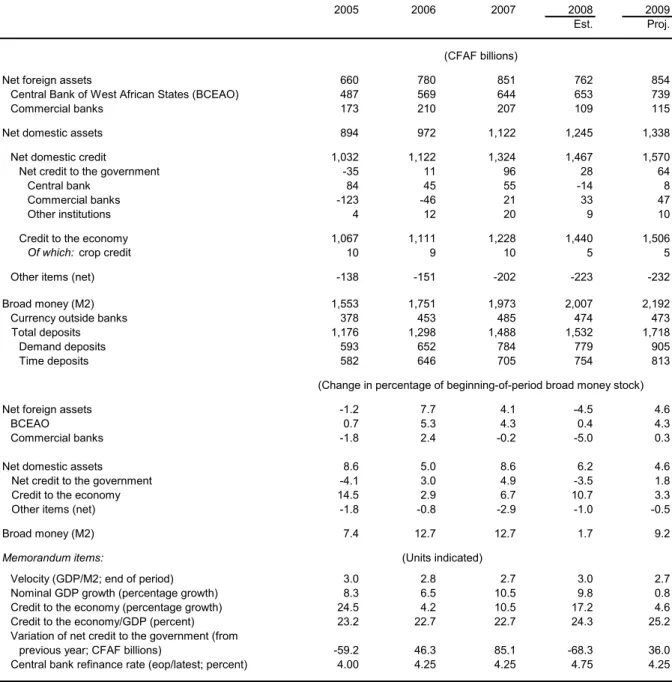
Table 5. Senegal: Monetary Survey, 2005–09
(Change in percentage of beginning-of-period broad money stock) (CFAF billions)
(Units indicated) 2006 2005
25
2003 2004 2005 2006 2007 2008 2009 Dec. Dec. Dec. Dec. Dec. Dec. Jun. Capital adequacy
Capital to risk-weighted assets 11.7 11.5 10.8 12.9 13.5 13.8 15.5 Regulatory capital to risk-weighted assets 12.1 11.9 11.1 13.1 13.6 13.9 15.9
Capital to total assets 7.8 7.7 7.6 8.3 8.3 9.1 9.8
Asset composition and quality
Total loans to total assets 59.6 57.1 64.0 63.8 58.8 62.8 63.1 Concentration: loans to 5 largest borrowers to capital 141.0 131.4 179.9 103.7 88.5 86.9 91.8 Sectoral distribution of loans
Industrial 41.1 33.6 35.5 28.9 25.1 19.5 25.3
Retail and wholesale trade 19.9 19.3 17.0 18.9 14.4 18.5 16.5 Services, transportation and communication 17.2 27.4 28.0 30.0 29.6 31.1 35.4 Gross NPLs to total loans 1/ 13.3 12.6 11.9 16.8 18.6 19.1 18.0
Of which: without ICS … … … … 12.7 14.2 15.4
Provisions to NPLs 1/ 75.3 75.7 75.4 52.0 53.8 51.5 50.5
Of which: without ICS … … … … 74.6 62.9 60.9
NPLs net of provisions to total loans 1/ 3.3 3.4 3.2 8.8 8.6 9.3 9.8
Of which: without ICS … … … … 3.6 5.4 6.6
NPLs net of provisions to capital 1/ 27.8 25.1 27.2 67.9 60.7 63.9 62.9
Of which: without ICS … … … … 23.8 35.3 41.2
Earnings and profitability
Average cost of borrowed funds 1.8 2.0 2.0 2.2 2.3 … … Average interest rate on loans 8.7 11.7 11.8 11.3 11.6 … …
Average interest margin 2/ 6.7 9.7 9.8 9.2 9.4 … …
After-tax return on average assets 1.8 1.8 1.6 1.6 1.6 … … After-tax return on average equity 22.1 17.6 15.8 14.6 15.3 … …
Noninterest expenses/net banking income 48.9 48.7 47.9 49.4 50.7 … …
Salaries and wages/net banking income 21.8 21.5 21.2 21.7 22.2 … … Liquidity
Total deposits to total liabilities 82.0 79.6 78.3 75.8 73.6 70.3 71.2 Source: BCEAO.
2/ Excluding the tax on banking operations.
1/ NPL changes in 2006 due to ICS. In 2008, ICS was recapitalized and the government guarantee for its bank loans was lifted. However, the loans in question remain classified as non-performing for the time being, although without the need to provision.
Table 6. Financial Soundness Indicators for the Banking Sector, 2003–09 (Percent, unless otherwise indicated)
26
Assessment
criterion Actual Status Indicativetarget Actual Status Assessment (performance) criteria
Floor on the basic fiscal balance 2/ -60 -19 Met -90 -79 Met
Ceiling on the contracting or guaranteeing of new
nonconcessional external debt by the government 3/ 4/ 80 5/ 0 Met 80 5/ 0 Met
Ceiling on spending undertaken outside normal and simplified
procedures 4/ 0 0 Met 0 0 Met
Ceiling on government external payment arrears (stock) 4/ 0 0 Met 0 0 Met
Ceiling on the amount of the float (depenses liquidées
non payées par le Tresor) 6/ 45 42 Met 45 42 Met
Indicative target
Quarterly ceiling on the share of the value of public sector
contracts signed by single tender (percent) 20 14 Met 20 5 Met
1/ Indicative targets for September 2009, except for the assessment (performance) criteria monitored on a continuous basis. 2/ Defined as total revenue minus total expenditure and net lending, excluding externally financed capital expenditure, on-lending, and HIPC and MDRI spending. Cumulative since the beginning of the year. Total revenue excludes privatization receipts and sales of mobile telephone licenses.
3/ Excluding government or government-guaranteed CFAF borrowing from financial institutions within the WAEMU and external loans contracted by the airport project company (AIDB) to finance the construction of the new Dakar Airport.
4/ Monitored on a continuous basis.
5/ Cumulative since approval of second PSI review. The amount of up to CFAF 80 billion is to finance exclusively the Dakar-Diamniadio toll highway project. 6/ Defined as all expenditure for which a bill has been received and recognized (dépense liquidée) but not yet paid by the Treasury.
Table 7. Quantitative Assessment Criteria (Performance Criteria) and Indicative Targets for 2009 1/
(CFAF billions, unless otherwise specified)
27
2008 2009 2010 2011 2012 2013 2014 2015 2016 2017 2018 2019 2020
Obligations to the Fund from existing drawings
Principal (SDR millions) 0.0 0.0 0.4 2.1 3.5 3.5 11.6 14.5 12.7 11.3 11.3 3.2 0.0
Charges/Interest (SDR millions) 1/ 0.8 0.4 0.5 0.5 0.4 0.4 0.4 0.3 0.3 0.2 0.2 0.1 0.1
Obligations to the Fund from prospective drawings 2/
Principal (SDR millions) 0.0 0.0 0.0 0.0 0.0 0.0 0.0 9.7 12.9 12.9 12.9 12.9 3.2
Charges/Interest (SDR millions) 1/ 0.0 0.0 0.3 0.3 0.3 0.3 0.3 0.3 0.3 0.2 0.1 0.1 0.0
Total existing and prospective obligations to the Fund 2/
In millions of SDRs 0.8 0.4 1.1 2.9 4.2 4.2 12.3 24.8 26.2 24.7 24.6 16.3 3.3
In millions of U.S. dollars 1.3 0.7 1.6 4.4 6.6 6.5 19.0 38.4 40.5 38.2 38.0 25.3 5.2
In percent of exports of goods and services 0.0 0.0 0.1 0.1 0.2 0.2 0.5 0.9 0.9 1.0 0.9 0.6 0.1
In percent of debt service 0.8 0.4 0.8 1.5 2.2 2.1 6.8 11.1 11.1 10.0 9.4 6.2 1.3
In percent of quota 0.5 0.3 0.7 1.8 2.6 2.6 7.6 15.3 16.2 15.2 15.2 10.1 2.1
In percent of gross official reserves 0.1 0.0 0.1 0.2 0.3 0.3 0.9 1.8 2.0 1.9 1.8 1.2 0.2
Total Fund credit outstanding 2/
In millions of SDRs 41.6 106.3 138.3 136.3 132.8 129.3 117.8 93.6 68.0 43.7 19.4 3.2 0.0
In millions of U.S. dollars 63.3 165.5 215.1 211.6 206.1 200.5 182.2 145.0 105.2 67.7 30.1 5.0 0.0
In percent of exports of goods and services 1.9 6.0 6.8 6.3 5.8 5.3 4.5 3.3 2.2 1.8 0.7 0.1 0.0
In percent of debt service 37.2 93.8 106.2 73.5 68.0 65.0 65.5 42.1 28.9 17.7 7.5 1.2 0.0
In percent of quota 25.7 65.7 85.5 84.2 82.1 79.9 72.8 57.9 42.0 27.0 12.0 2.0 0.0
In percent of gross official reserves 3.8 9.3 12.4 11.7 10.9 9.9 8.4 7.0 5.1 3.3 1.4 0.2 0.0
Memorandum items:
Exports of goods and services (millions of US$) 3,343 2,767 3,153 3,361 3,569 3,817 4,062 4,347 4,759 3,762 4,095 4,456 4,847 Debt service (millions of US$) 170 177 203 288 303 309 278 345 364 382 402 408 401 Quota (millions of SDRs) 162 162 162 162 162 162 162 162 162 162 162 162 162 Gross official reserves (millions of US$) 1,668 1,788 1,738 1,801 1,888 2,019 2,157 2,077 2,053 2,061 2,097 2,161 2,264 GDP (millions of US$) 13,316 12,526 13,608 14,443 15,339 16,283 17,243 18,492 19,852 21,321 22,900 24,606 26,447
Sources: BCEAO; and Fund staff estimates and projections.
1/ Obligations to the Fund do not take into account the temporary waiver of interest payments and new interest rates structure, which have not yet become effective.
2/ Based on the following ESF disbursement schedule: SDR 32.36 million (20 percent of quota) upon completion of the second ESF review, December 2009; and SDR 32.36 million (20 percent of quota) upon completion of the third ESF review, June 2010.
Projections Table 8. Senegal: Indicators of Capacity to Repay the Fund, 2008–20
28
LETTER OF INTENT
Translation from French
Dakar, Senegal December 4, 2009 Mr. Dominique Strauss-Kahn
Managing Director
International Monetary Fund 700 19th Street, N.W.
Washington, D.C., 20431 Dear Mr. Strauss-Kahn:
1. The attached Memorandum of Economic and Financial Policies (MEFP) reviews recent economic developments and implementation of the government of Senegal’s macroeconomic and structural program under the country’s three-year Policy Support Instrument (PSI), approved by the IMF Executive Board on November 2, 2007, and the Exogenous Shocks Facility (ESF) arrangement, approved on December 19, 2008, and augmented and extended on June 19, 2009. The attached MEFP builds on previous Memoranda, and sets out policies the government intends to implement with emphasis on measures and objectives for 2010.
2. All quantitative assessment (performance) criteria for June 2009 and all quantitative indicative targets for September 2009 were met. Structural reforms, which are focused on public financial management, have generally progressed in line with the program despite some delays. Given the complexity of the task, the government is in the process of finalizing the procedures regarding regularization of extrabudgetary commitments and the debt of public agencies and institutions, and has therefore not been able to incorporate them in the 2010 budget law. The government will submit to parliament by May 15, 2010, a supplementary budget containing the specific entries and budget lines to settle these payments. As described in the attached MEFP, the government continues to pursue an ambitious program of budget and fiscal reform, governance reform, and energy sector reform.
3. To supplement resources from donors and the private sector, the government is
mobilizing external funds for the Dakar-Diamniadio toll highway. To this end, the government requests to raise the ceiling for non-concessional borrowing for this project by CFAF 10 billion (less than 0.2 percent of GDP) to CFAF 90 billion. The higher ceiling would allow the
government to accommodate possibly higher costs and issue a bond in international markets of $200 million, typically seen as a minimum size for this type of transaction. The small increase would have no negative impact on debt sustainability.