POLICY RESEARCH WORKING PAPER
2751
Contractual Savings
This paper argues thatcontractual savings lassets of
Institutions and Banks'
pension funds and life* *
1
r r
*
~~~~~~~~~~insurance
companies}
Stability and Efficiency
isrnecmais
contribute to the
improvement of banks'
Gregorio Impavido efficiency, credit, and liquidity
Alberto
PMusalem
risk. The authors use bankThierry Tressel level panel data across
countries to assess the impact of contractual savings on bank efficiency and lending behavior. They concentrate on profitability measures and
on term transformation and credit risk indicators.
The World Bank
Financial Sector Development Department
Public Disclosure Authorized
Public Disclosure Authorized
Public Disclosure Authorized
| POLICY RESEARCH WORKING PAPER 275
1
Summary findings
Impavido, Musalem, and Tressel analyze the relationship After controlling for banks' characteristics,
between the development of contractual savings macroeconomic factors, and more standard indicators of
institutions and banks' efficiency, credit, and liquidity financial development, they show that the development
risks. They discuss the potential mechanisms through of contractual savings institutions is associated with
which the development of contractual savings institutions increased efficiency of the banking system and greater
may affect the banking sector. They show that the resilience to credit and liquidity risks.
development of contractual savings institutions has a significant impact on bank spreads and loan maturity.
This paper-a product of the Financial Sector Development Department-is part of a larger effort in the department to study the effects of contractual savings on financial markets. Copies of the paper are available free from the World Bank, 1818 H Street NW, Washington, DC 20433. Please contact Patricia Braxton, room MC9-704, telephone 202-473-2720, fax 202-522-7105, email address pbraxton@cworldbank.org. Policy Research Working Papers are also posted on the Web at http://econ.worldbank.org. The authors may be contacted at gimpavidoCaworldbank.org, amusalem@worldbank.org, or tresse[L delta.ens.fr. December 2001. (27 pages)
The Policy Research 51 !.. Paper Series dissemzinates the findings of work in progress to encourage the exchange of ideas about
development issues. An objective of the series is to get the findings outt quickly, even if the presentations are less than fully polished. The
papers carry the names of the auithors and should be cited accordingly. The findings, interpretations, and conclusions expressed in this
paper are entirely those of the authors. They do niot necessarily represent the view of the World Bank, its Executive Directors, or the couintries they represent.
Stability and Efficiency
Gregorio Impavido, Alberto R. Musalem, and Thierry Tresselt
The World Bank
JEL Classification Code: G21, G22, G23.
Keywords: Contractual savings, Banking sector, Risk management.
t Gregorio Impavido (gimpavido(a,worldbank.org) and Alberto Roque Musalem,INTRODUCTION
The emerging economies' crisis stress repeatedly the risks associated with the
international financial system. Excessive volatility of capital flows exacerbates the
structural weaknesses of these economies, especially in the banking system. Thus, policy
makers are urged to reassess banking supervision and regulation. However, this cannot
go without a clearer understanding of the interaction between banks and other
components of the financial structure to define future strategies.
Recent studies show indeed that contractual savings have become important actors of
financial systems in developed and also in a handful of emerging economies (e.g., Chile,
South Africa). They are also growing at a fast pace in several Latin American countries
(e.g., Argentina, Mexico) and demographic evolution may increase the benefits
associated to a funded system in other countries. Impavido and Musalem (2000) and
Catalan, Impavido and Musalem (2000) show that the development of institutional
investors, in particular contractual savings, partly explain the rapid expansion of stock
markets over the past 15 years. Impavido, Musalem and Tressel (2001) show moreover
that the development and asset allocation of contractual savings have had an independent
impact on firms' financing choices after controlling for macroeconomic and firms'
characteristics. They identify several channels. In market-based economies, an increase
in the proportion of shares in the portfolio of contractual savings leads to a decline in
firms' leverage. In bank-based economies, instead, an increase in the size of contractual
savings is associated with an increase in leverage and debt maturity in the corporate
sector. This suggests that firms are more resilient to refinancing or bankruptcy risks.
However, while the banking system plays a crucial role in most economies as it
provides external finance to firms excluded from the securities market, the interaction
between contractual savings institutions and banks and its implications on the cost of
capital for the firms has not been assessed yet.
Impavido, Musalem and Tressel (2001) propose several mechanisms through which
contractual savings interact with the banking sector and that are consistent with their
results. First, contractual savings, as competing intermediaries, may increase the
efficiency of the banking sector. Underwriting costs may also decrease, thus lowering
the cost of access to capital markets. Moreover, banks may respond to more intense
competition by concentrating on their core comparative advantage - that is their superior
ability to monitor firms - and increase short-term loans. As bank liabilities are liquid, this
may reduce the balance sheet mismatch of the banking sector. Second, contractual
savings institutions may also be complementary to banks. Indeed, banks may for
instance issue long-term securities bought by contractual savings institutions, or the latter
could invest in long term bank deposits. As a result, the term-transformation risk in the
banking sector may decrease. The development of contractual savings institutions may
therefore increase the stability and efficiency of the banking system when adequate
regulation and supervision are effective.
This paper provides a first step in providing a better understanding on the impact of
contractual savings development on the banking system. First, we provide a discussion
of the potential channels through which the development of contractual savings
Gregorio Impavido, Alberto R. Musalem, and Thierry Tressel
institutions might affect the efficiency and stability of the banking system. Second, using bank level data across countries we provide regression analysis on panel data in order to
assess the impact on contractual savings on bank efficiency and lending behavior. We concentrate on profitability measures and on term transformation and credit risks indicators.
I
INTERACTION BETWEEN CONTRACTUAL SAVINGS
INSTITUTIONS AND BANKS
In this section, we discuss the potential mechanisms through which the development of contractual savings institutions might affect the banking system. We want to address two main questions. First, does the development of contractual savings institutions increase or decrease the competitive pressures on banks? In other words, are banks and contractual savings institutions substitute or complementary? Second, does the development of contractual savings institutions enhance the stability of the banking system?
The broad movement of financial liberalization that started in the early eighties has deeply modified the functioning of banking systems in many countries. Increased competitive pressures may increase efficiency of the banking system, but may also increase instability when proper regulation and supervision is not set. Surprisingly, few studies have analyzed the efficiency, profitability and balance sheets of banks on a cross-country basis 1. In particular, whereas financial liberalization was often associated to competitive pressures from non-bank financial institutions, there has been, to date, no attempt to analyze both empirically and theoretically the interaction between the banking system and other financial institutions (except the stock market)2.
First, we want to assess whether the development of contractual savings institutions has increased the competitive pressures on the banking system, and more particularly how the behavior of banks has been affected, across countries and over time. In doing so, we
want to assess the specific impact of contractual savings, after controlling for banks' characteristics, financial sector development, and the macroeconomic environment.
Contractual savings institutions will act as competing suppliers of funds, hence competitive pressure on the banking systems will increase, either indirectly or directly. Contractual savings institutions will indirectly increase competitive pressures because the development of contractual savings institutions is associated to the development and increased liquidity of the capital markets (Impavido and Musalem (2000)). The cost of issuing securities will decrease3, hence reducing the market power of banks4. Moreover, contractual savings institutions may increase the supply of public information on capital market and have positive spillover effects on the monitoring of borrowers by banks. In
1
See, however, Demirguc-Kunt and Huizinga (1999a, 1999b), Davis and Tuori (2001) and Claessens, Demirguc-Kunt and Huizinga (2001).2 Allen and Santomero (1999) claim that the broad movement towards more market finance, that was
initiated in the 80s, has led to a greater importance of non-bank financial intermediation.
Underwriting costs may decrease, as argued by Vittas (i 999) and the supply of funds will increase on capital markets.
4See Rajan (1992) who analyzes the welfare gains of increasing firms' outside financial opportunities. See also Petersen and Rajan (1995).
-addition, the development of contractual savings institutions will directly increase the competitive pressures on the barking system. First, they will compete on the saving side (for instance, in France, the development of life insurance over the past 10 years has implied a significant reallocation of savings from more "classic" banking savings instruments). Second, they will compete on the lending side, either directly or indirectly, by increasing the demand for securities on the primary markets. Hence, we should expect to observe an impact on banks behavior. Competition, however, will be two-dimensional. First, competition will be in price, thus we should expect a decrease in bank net interest margins as contractual savings institutions develop. Second, banks may modify the maturity of their loans. As contractual savings institutions have a comparative advantage in suplying long-term finance5, banks may decrease the maturity of their loans6.
Therefore, one might expect to observe a decrease in the maturity of bank loans.
However, contractual savings institutions may also be complementary to banks. First, as noticed by Demirguc-Kunt and Maksimovic (1996), banks and stock markets may be complementary7. Information disclosure requirements and generally the increased transparency associated to capital market development may stimulate the monitoring activity of banks8, lowering the credit risk borne by the banking sector9; an increase in bank lending and total profitability may be observed as capital markets develop. Second, contractual savings institutions may provide long-term resources to banks, thus reducing the interest rate and liquidity risk in the banking system by limiting the term
transformation activity of banks 10 Therefore the maturity of bank loans may increase if such complementarity effects dominate.
Second, the development of contractual savings institutions may increase the stability of the banking system, thus reducing systemic risks that may potentially lead to banking crisis 11. This would be the case if the development of contractual savings institutions reduces the risks borne by the banking sector. First, credit risk may be reduced if the development of contractual savings institutions leads directly or indirectly to an increase in bank monitoring. Second, the development of contractual savings institutions may reduce interest rate risks and liquidity risks associated to the term transformation of assets realized in the banking system. On the one hand, as noticed in the previous paragraph, if
5 Contractual savings institutions have long-term liabilities.
6The maturity choice is also affected by monitoring decisions (Stiglitz and Rey (1993)).
7 Bank and market finance are complementary also because they finance different segments of the firm population: see Diamond (1991), Bolton and Freixas (2000) among others.
8However, the theoretical relation between stock market transparency, liquidity, and monitoring of firms by claimants (banks or investors) is not clear-cut as first illustrated by Grossman and Stiglitz (1984). See also Holmstromand Tirole (1993).
9 Davis (2001) stresses the "multiple avenues" of financial systems by comparing aggregate net flows of bank loans and market debt finance.
10 Following Diamond and Dybvig (1983), systemic risk in the banking system has been identified as a consequence of maturity transformation and the "sequential service" constraint on bank liabilities; in addition, imperfect information and moral hazard increase this fragility of the banking system (Chen (1999)). Freixas and Rochet (1997) provide a guidebook to microeconomic theories of banking. 1l Increased competitive pressures and financial stability are not incompatible. For a recent theoretical analysis, see for instance Koskela and Stenbacka (2000) who show that loan market competition, which leads to a reduction of lending rates and higher investments without increasing the equilibrium bankruptcy risk of firms. In addition, whether a reduction in term transformation risk in the banking system leads to more or less efficient lending decisions is an empirical question.
Gregorio Impavido, Alberto R. Musalem, and Thierry Tressel
contractual savings institutions are competitors to banks, the latter may indeed respond to
competitive pressures by concentrating on their core comparative advantage (associated
to narrow banking), -that is their superior ability to monitor firms - and increase
short-term loans. Banks will therefore be able to avoid losses caused either by unexpected
increase in short-term interest rates or by sudden withdrawals. On the other hand, if
contractual savings institutions provide resources to the banking system (either in the
form of loans, deposits, or by buying securities issued by banks), banks will be less
subject to liquidity risks for a given level of long-term assets. They may therefore
increase the supply of long-term loans
12,Finally, the recent emerging economies' crisis
have stressed the risks associated to short-term capital flows. Excessively volatile capital
movements have exacerbated the structural weaknesses of these economies, that were
magnified by fragile banking systems 1
3. This financial risk is associated to the difficulty
(or impossibility) for these economies to borrow abroad in their own currencies, and
long-term. One of the solution is to deepen domestic financial system in order to develop
domestic sources of long-term finance (see for instance Caballero (2001)), which is the
comparative advantage of contractual savings.
The development of contractual savings institutions, given adequate regulation and
supervision'
4, may therefore enhance the stability and efficiency of the banking system.
11
DATA AND EMPIRICAL STRATEGY
Il.A Data
We use balance sheet and income statement of commercial banks, aggregted by country
each year, from the Bankscope data base provided by IBCA. We use an unbalanced
sample of banks over the period 1991-2000, in order to maximize the time-series
dimension for each country.
The database on contractual savings is taken from Inpavido and Musalem (2000),
extended for several countries (Argentina, Brazil, India and Mexico). It includes
information from different sources (including the OECD institutional investors data 2000,
and national sources) on total assets, financial assets, and allocation of assets for pension
funds and insurance companies.
All other macroeconomic variables are obtained from various sources: Datastream, the
World Development Indicators, the IMF International Financial Statistics and the Bank
for Internationa I Settlement for bond markets data.
12 Our results are consistent with this assertion.
13 See the recent literature, such as Aghion, Banerjee and Bachetta (2000), Caballero and Krishnamurthy
(2000), Chang and Velasco (1999), Rodrik and Velasco (1999) and Deckle and Kletzer (2001). For empirical analysis, see Demirguc-Kunt and Detriagache (1997, 1998, 2000) and Harwood et al. eds. (1999).
14 See Barth et al. (2001 ) for an analysis of the prudential regulation of banks (see also Dewatripont and Tirole (1994)). Generally, La Porta et al. (1997, 1998) claim that laws are important determinants of cross-country differences in firms' external finance choices.
II.B Definition of variables and empirical strategy
We want to assess the impact of contractual savings institutions on banks' characteristics.
More specifically, we analyze: (i) profitability (ii) the maturity structure of loans, (iii)
credit risk, and (iv) the structure of liabilities. We focus on pooled (GLS) estimates and
panel estimates (GLS with fixed effects). The GLS estimator corrects for
heteroschedasticity specific to each panel (country). Fixed effects estimations are
important in so far as they control for country specific regulatory and supervision
characteristics that may partly explain the cross-country variation of our bank variables
1516
The dependent variables that we consider are: (i) net interest margin (NIM), defined as
the accounting value of a bank's net interest income over total assets, (ii) profitability
(Profit), defined as profit before taxes over total assets
17 18,(iii) loan maturity defined as
short-term loans (with maturity less than one year) over total loans (STL), (iv) credit risk
proxied by loan loss provisions (over total assets, or over total loans), and (v) the
importance of short-term liabilities, proxied by customer + short-term funding (over total
assets).
The two first variables describe the profitability of banks, hence proxy for their
efficiency. The NIM variable accounts for banking spreads; this variable allows us to
assess whether banks pricing behavior may be affected by the development of contractual
savings institutions. In addition, the NIM is also affected by the credit risk borne by the
banks. The NIM variable is indeed an ex-post measure taking into account the realized
default rate. For these reasons, we use also the Profit variable that accounts for all
sources of bank profits.
The third variable describes the maturity transformation activity realized in the banking
system; more specifically, we want to test whether the development of contractual
savings institutions has had an impact on the maturity of bank loans. In other words, do
banks increase or decrease long-term lending when contractual savings institutions
develop?
The fourth set of variables aim at describing the credit risk borne by the banks. We use
two measures: first, loan loss provisioning over total assets is the relevant variable to
understand the indirect impact of contractual savings on profitability via the reduction in
credit risk. The second variable, loan loss provisions over total loans, roughly describes
the risk of the loan portfolio.
15 Fixed effects estimator use the time variation within countries to estimate partial correlations between the dependent and explanatory variables.
16 We also checked that our results are not affected by the inclusion of time dummies common to all
countries.
" See for instance Demirguc-Kunt and Huizinga (1999a, 1999b).
18 From the income statement, we have the following accounting identity: Profit = NIM + non-interest
Gregorio Impavido, Alberto R. Musalem, and Thierry Tressel
We use three sets of explanatory variables: (i) banks' characteristics, (ii)
macroeconomic factors, and (iii) financial system characteristics'9. All the relevant variables are expressed in percentages.
lI.B.1 Bank-specific characteristics
The first bank characteristic is the book value of equity divided by total assets (ETA). Recent studies (see for instance Demirgiiu-Kunt and Huizinga (1999a, 1999b) for cross-country comparisons) show that there exists a positive relationship between bank
profitability and capitalization. High capitalization and profitability may indeed reflect a high franchise value (Caprio and Summers (1993)). Moreover, well-capitalized banks may face lower bankruptcy risks, thereby reducing their costs of funding. In addition, we want to control that loan maturity is not explained by the structure of banks liabilities.
The second variable controlling for the structure of bank liabilities is customer and short-term funding over total assets. It includes all short-term and long-term deposits plus other non-deposit short term funding. Again, this variable controls that loan
maturity is not driven by the structure of liabilities. This is important in so far as we want to test whether the development of contractual savings institutions has an independent impact on bank loan maturity that is not driven by other bank-specific characteristics.
We include two variables describing the structure of bank activities. The first one is total loans over total assets. The second one is non-interest earnings assets over total assets. Non- interest earnings assets are mainly cash and non-interest earnings deposits at other banks.
Finally, we control for overhead expenses, expressed as a percentage of total assets. This implies that differences between net interest margin and profits before taxes are explained by variations in non- interest income (or taxes and provisions for loan losses).
II.B.2 Macroeconomic factors
Various macroeconomic factors may affect banks profitability and loan maturity. We use the Log of GDP per capita as a broad measure of economic development. Richer
economies have in general more efficient institutions, a better compliance with the legal system in general, and with creditor rights, accounting standards and transparency rules (on the stock market) in particular. Moreover, the inclusion of country fixed effects further controls for unobserved country-specific regulation and supervision. The inflation rate is an indicator of both the government's management of the economy and whether long-term contracting is likely to be widespread. It characterizes also the
opportunity cost of holding money. We also include government fiscal balances (% GDP) to control for the demand for public debt2O.
19 In order to provide comparable results, we choose explanatory variables similar to those used by
Demirguci-Kunt and Huizinga (I 999a, 1999b).
20 We also used Government debt over GDP. Our main results are not affected. We choose not to report these regressions because of the more limited country coverage.
-II.B.3 Financial system characteristics
The stock market and banking sector variables control that our contractual savings variables are not simply a proxy for the level of development of the financial system and
2 1 the degree of competition between capital markets and banks
II.B.3.1
The stock market
First, we measure the size of stock markets by the stock market capitalization (in percentage of GDP). This variable has been widely used in the recent literature. The
ability of the stock market to provide risk diversification opportunities and information also depends on its level of activity and liquidity (Levine and Zervos (1998)). Greater liquidity will encourage investors to acquire stakes in risky firms2 2and will enhance information acquisition by large investors (Holmstrom and Tirole (1993)). Greater informational content in prices will increase the efficiency of capital allocation, whereas better public information may have a spillover effect on the long-term debt market by reducing initial informational asymmetries, as illustrated in the model in Impavido,
Musalem and Tressel (2001). Activity in the stock market is measured by total stock traded over GDP and liquidity is proxied by the turnover ratio, that is the total value traded, in proportion of the stock market capitalization.
II.B.3.2
The banking system
The degree of comp etition among banks, and between banks, capital markets and other non-bank financial intermediaries depends on the level of development of the banking system. Moreover, the tendency of banks to engage in long-term lending may also depend on the deepening of the banking sector. We use domestic credit provided by the banking system over GDP as a proxy for the development and soundness of the banking
sector.
II.B.3.3
Contractual savings institutions
The level of development of contractual savings institutions is proxied either by contractual savings financial assets over GDP or the log of contractual savings
institutions financial assets over GDP. The Log allows to capture non linearities if for instance the impact of contractual savings development is larger for low initial levels of development than for high initial levels of development. Simple scatter-plots indeed suggest the existence of such non- linearities for NIM, profits, and loan maturity.
II.B.4 Empirical strategy
We start with summary statistics of the variables defined in the previous paragraph. A detailed description of the evolution of contractual savings institutions over the period studied in our sample can be found in Impavido, Musalem and Tressel (2001). Next, we
21 Whereas the level of development and characteristics of capital markets (and the size of the banking sector) may affect bank profitability, recent studies suggest that financial structure per se (that is the relative importance of capital markets and the banking sector) has not additional impact (see Demirguc-Kunt and Huizinga (1999b), Demirguc-Demirguc-Kunt and Levine (1999) and Beck et al. (2000)).
Gregorio Impavido, Alberto R. Musalem, and Thierry Tressel
compute simple correlations between the variables. These simple statistics show a strong
correlation between the development of contractual savings institutions and banks
characteristics. Finally, we provide panel data analysis (GLS without and with fixed
effect estimates, with a correction for heteroschedasticity). Our bank level data are
aggregated at the country level for each year. The intersection of the various data set
(Bankscope, Institutional Investors Data base, and World Bank Indicators) provide a
sample of approximately 200 observations, and 8 years at best per country.
III
EMPIRICAL RESULTS
lIMA Descriptive statistics
Table 1 presents the sample of countries that are included in our contractual savings
database, and the total number of banks available for each country. We have data for 34
countries, including 13 emerging economies (Argentina, Brazil, Chile, Hungary, India,
Korea, Malaysia, Mexico, Singapore, South Africa, Sri Lanka, Thailand and Turkey).
The contractual savings data include information on total financial assets and portfolio
composition for pension funds and insurance companies (in particular corporate stocks),
except for 6 countries for which we have no information on equity investments (Austria,
Brazil, France, Japan, Spain, and Turkey). The Bankscope database has a very
comprehensive coverage in most countries, with banks included roughly accounting for
90 % of total banking assets (Demirguc-Kunt and Huizinga (1999)).
Table 2 provides the definition of the variables used in the regressions. As described in
detail in Impavido, Musalem and Tressel (2001), there has been a spectacular increase
23in the total assets managed by pension funds and life insurance companies,
2 4 25relative to
GDP. Expressed in rate of growth, the increase is even more impressive. Contractual
savings financial assets, relative to GDP, have been growing at an average annual rate of
17.7%, 3.4%, 6.9%, 6.0%, 7.9%, 8.99% and 4.6% respectively in France, Germany,
South Africa, the United States, the United Kingdom, Chile and Korea. As shown by
Impavido and Musalem (2000) and discussed also in Impavido, Musalem and Tressel
(2001), this development has been similar, in term of growth, to the development of
capital markets, and may partly explain this evolution.
Table 3 provides simple descriptive statistics while Table 4 displays the correlation
between the main variables. Net interest margins display some slight differences
between countries, when averaged over the period, with a maximum value of 7.71% for
Turkey and a minimum of 1.05% in Switzerland. Argentine banks are the most
capitalized, on average (14.62% of total assets), while Belgium ones are the least
capitalized (3.64%). Banks have the highest proportion of loans in their assets (72.7%) in
New Zealand, while those in Brazil have the lowest proportion of loans (33.9%). The
maturity of loans exhibits also significant differences (we have the information on loan
23 Singapore is the only country in which contractual savings assets decreased relative to GDP.
24 Musalem and Impavido (2000) show, on this sample of countries, that this explosion of contractual savings institutions may partly explain the rapid growth of stock markets over the last 15 years.
25 In France, where pension funds are underdeveloped, the life insurance industry exploded at the beginning of the 90s as a result of strong fiscal incentives to save in life-insurance products (these savings were exempt of taxes).
-9-maturity structure only in 15 countries): 92.5% of Greek banks loans are a -9-maturity
below 1 year while on the contrary almost 80% of bans by Belgium banks have a
maturity above I year. Table 4 finally shows that there is a strong negative correlation
between the net interest margin and the log of contractual savings financial assets
(%GDP). Note that the correlation is also negative and significant if we simply consider
contractual savings financial assets over GDP. The proportion of short-term loans in total
bank loans is also strongly negatively correlated with LogcsfaGDP suggesting that the
development of contractual savings institutions is associated with an increase in loan
maturity. The structure of liabilities does not seem to be significantly correlated with the
development of contractual savings
26. Finally, credit risk seems to be negatively
correlated with the development of contractual savings institutions. Note the large
cross-country differences: the top 4 countries in term of credit risk (LLTA) are Hungary
(2.36%), Argentina (1.56%), Thailand (1.18%) and Brazil (1.16%), while banks face the
lowest credit risk in Germany (0.06%), Austria (0.10%), Belgium (0.21%) and Ireland
(0.24%). In the former group, contractual savings financial assets are 4.3% of GDP on
average, and 29.6% on average in the latter group. This suggests that contractual savings
may have some explanatory power for such cross-country differences. The econometric
analysis will confirm its robustness. This is consistent with conclusions drawn by
Impavido, Musalem and Tressel (2001). Finally, Figures 1, 2 and 3 illustrate the
correlation between maturity of loans, net interest margin and credit risk, respectively,
with the development of contractual savings.
These simple statistics neither account for banks' characteristics, nor allow one to
conclude that the correlations are not the result of the correlation with stock market and
banks characteristics. In the next section, we provide a simple econometric analysis that
confirms that the correlation between banks' profitability, loan policy and the activity of
institutional investors is not merely a function of banks' characteristics and other
macroeconomic factors.
III.B Regression results
Table 5, 6, 7, 8, 9 and 10 report regression results respectively for (1) the net interest
margin, (2) the profit rate, (3) the maturity of bank loans, (4) the credit risk (loan loss
provisions over total assets), (5) the credit risk proxied by loan loss provisions over total
loans, and (6) the structure of liabilities (customer and short-term funding over total
assets). For each dependent variable, we report OLS and within (fixed effect) estimates.
In each case, time dummies are included (not displayed in the tables), and we include the
full set of control variables described in the previous sections. Moreover, we controlled
for the potential simultaneity bias between the dependent variable and the contractual
savings variable in two ways: first, we use the lagged contractual savings variable;
second, we instrumented the contractual saving variable by its lagged value and a set of
lagged macroeconomic indicators (see Impavido and Musalem (2000)). This also
suggests that causality - if any - is more likely to go from contractual savings
development to bank profitability and loan maturity. The lag may also simply reflect the
time adjustment for the impact of contractual savings to materialize.
26 On the contrary, econometric analysis will show a strong negative correlation between short-tern funds and contractual savings development.
Gregorio Impavido, Alberto R. Musalem, and Thierry Tressel
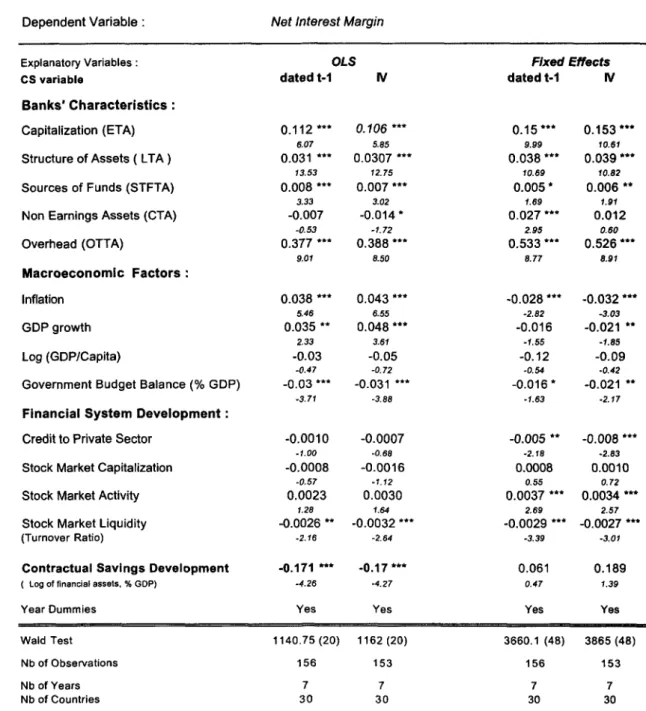
Table 5 displays the results of the net interest margin regressions. First, the NIM is positively correlated with the capitalization ratio, which is consistent with previous studies (see Demirguc-Kunt and Huizinga (1999)). It is also significantly and positively correlated with the structure of assets, the sources of funds and overhead expenses. Note however that the last correlation probably simply reflects the financial statement
accounting identity. Second, it is negatively correlated with stock market liquidity, but positively correlated with stock market activity. Government fiscal balances are negatively correlated with net interest margin, possibly reflecting macroeconomic uncertainties. Inflation and real GDP per capital growth are positively correlated with NIM when considering cross-country variations (OLS) but negatively correlated with NIM when considering within variations (fixed effects). Third, the level of development of contractual savings institutions (LogcsfaGDP) is negatively associated with net interest margin 27 when concentrating on cross country variations (however within country
variation has not significant impact): We have a logarithmic relation between contractual savings development and net interest margin; this suggests that the magnitude of the impact depends on the initial development of contractual savings institutions. The impact is large at low initial level of contractual savings development, and it decreases as contractual savings institutions develop. Therefore, our results are consistent with the initial hypothesis that the development of contractual savings institutions is associated to increased competitive pressures in the banking system, leading banks to reduce the spreads between loan and deposit rates.
Table 6 displays the results of the profit regressions. Note now that the correlation between contractual savings development and bank profits is reversed. Indeed, while the OLS regression does not show any significant correlation, the fixed effect estimation provides a positive and significant correlation between contractual savings development and bank profitability. While banks tend to choose lower spread when contractual savings institutions are more developed, the total impact on profit is surprisingly positive. In Tables 8 and 9, we show that the impact is likely to go through a reduction in credit risk.
Loan maturity regressions are summarized in Table 7 (these estimations are realized on a subset of 14 countries for which we have the information). Note that, given the bank level control variables included in the regressions, the results obtained on the
LogcsfaGDP variable do not reflect modifications in the structure of assets or liabilities of the banks. First, standard measures of financial development do not seem to explain the loan maturity, while GDP growth and inflation do have a significant effect. Second, the level of development of contractual savings institutions has a positive and significant effect on loan maturity. Given the discussion in the second section, this suggests that, even if banks seem to face higher competitive pressures when contractual savings institutions develop (thus reducing interest spreads), they do not reduce the maturity of loans (in other word they do not seem to concentrate on their core activity). On the
27 The correlation is weaker if we simply take csfaGDP; this suggests that non linearities are probably important.
contrary, there seems to be a complementarity between the two institutions when
concentrating on the loan maturity dimension
28.
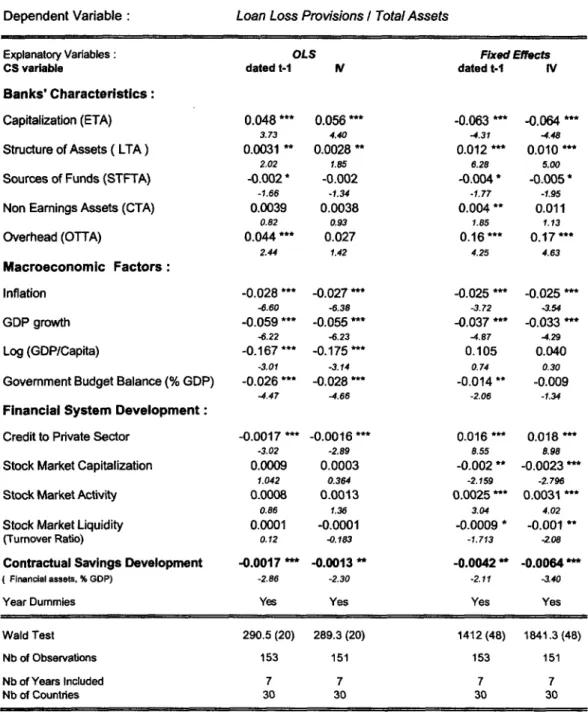
In Tables 8 and 9, we show moreover that there is a strong negative correlation
between credit risk borne by the banking system and the level of development of
contractual savings institutions. It is worthwhile underlying that this strong result does
not reflect cross-country differences, for instance the level of economic development
29.
This result complements the conclusions of Impavido, Musalem and Tressel (2001) who
show that the corporate sector is more resilient to various shocks when contractual
savings institutions are more developed or invest more on the stock exchange.
Finally, we show in Table 10 that, within countries, the development of contractual
savings implies a reduction in short-term liabilities of the banking sector. Hence, this
result is also consistent with complementarity between banks and contractual savings
institutions.
IV
CONCLUDING REMARKS
This paper is a first attempt at assessing the interaction between the banking system and
contractual savings institutions that have rapidly developed over the past 20 years in
many countries. We show that the development of contractual saving is associated with a
more efficient banking system. Moreover, our results strongly support the argument that
the banking system is more resilient to liquidity and credit risks when contractual savings
institutions are more deweloped. They are consistent with the conclusions drawn by
Impavido, Musalem and Tressel (2001) concerning firms' financing patterns.
28 For various aspects of the role of long-term finance, see the discussion in Impavido, Musalem and Tressel (2001).
Gregorio Impavido, Alberto R. Musalem, and Thierry Tressel
REFERENCES
[1] Aghion, P., Bachetta, P., and A. Banerjee (2000), Currency Crisis and Monetary Policy in an Economy with Credit Constraints, Harvard University, mimeo. [2] Allen, F., and Santomero, A. M. (1998), The Theory of Financial Intermediation,
Journal of Banking and Finance, 21, 1461-1485.
[31 Barth, James, Gerard Caprio and Ross Levine (2001) Bank Regulation and Supervision: What Works and What Doesn't, World Bank, mimeo.
[4] Beclh I., De mirguc-Kunt, A., Levine, R., and V. Maksimovic (2000), Financial Strucrurr and Economic Development: Firm, Industry and Country Evidence, World Bank Po. icy Research Working Paper, No. 2423.
[5] Bolton, P., and X. Freixas (2000) Equity, Bonds, and Bank Debt: Capital Structure and Financial Market Equilibrium under Asymmetric Information, Journal of Political Economy, vol.108, No.2.
[6] Caballero Ricardo J. (2001) Macroeconomic Volatility in Latin America: a View and Three Case Studies, mimeo MIT.
[7] Caballero Ricardo J. and Arvind Krishnamurthy (2000) Dollarization of Liabilities: Underinsurance and Domestic Financial Development, mimeo MIT. [8] Caprio, Gerard, Jr. and Asli Demirguc-Kunt (1997) The Role of Long Term
Finance: Theory and Evidence, Policy Research Department, The World Bank. [9] Caprio, G., and L. Summers (1993) Finance and its Reformn, Beyond
Laissez-Faire, World Bank Policy Research Paper 1171.
[10] Catalan, M., Impavido G., and A. R. Musalem(2000) Contractual Savings or Stock Market Development: Which Leads? Journal of Applied Social Science Studies, 120(3): 445-87. Paper can also be downloaded from the World Bank Pension Primer Series at http://www.worldbank.org/pensions
[ 1] Chang, R., and A. Velasco (1999), Liquidity Crisis in Emerging Markets - Theory and Evidence, NBER Working Paper, No 7272.
[12] Chen, Yehning (1999) Banking Panics: The Role of the First-Come, First-Served Rule and Information Externalities, Journal of Political Economy, Vol. 107, No.5. [13] Claessens, S., Demirguc-Kunt, A., and H. Huizinga (2001), How Does Foreign
Entry Affect Domestic Bank Markets?, Journal of Banking and Finance, No.25, 891-911.
[14] Davis, E. Philip (2001) Multiple Avenues of Intermediation, Corporate Finance and Financial Stability, IMF Working Paper.
[15] Davis, E. Philip and Klaus Tuori (2001) The Changing Structure of Banks' Income, an Empirical Investigation.
[16] Deckle, R. and K. Kletzer (2001) Domestic Bank Regulation and Financial Crisis: Theory and Empirical Evidence from East Asia, NBER working paper 8322.
-[17] Demirguc-Kunt, Asli and Enrica Detragiache (1997) The Determinants of Banking Crisis: Evidence from Developed and Developing Countries, mimeo World Bank.
[18] Demirguc-Kunt, Asli and Enrica Detragiache (1998) Financial Liberalization and Financial Fragility, mimeo World Bank.
[19] Demirguc-Kunt, Asli and Enrica Detragiache (2000) Does Deposit Insurance Increase Banking System Stability? An Empirical Investigation, mimeo World Bank.
[20] Demirguc-Kunt, Asli and Harry Huizinga (1999a) Determinants of Commercial Bank Interest Margins and Profitability: some International Evidence, The World Bank Economic Review, vol. 1 3 No.2, 379-408.
[21] Demirguc-Kunt, Asli and Harry Huizinga (1999b) Financial Structure and Bank Profitability, mimeo World Bank.
[22] Demirguc-Kunt, Asli, and Ross Levine (1999) Bank-Based and Market Based Financial Systems: Cross-Country Comparisons, mimeo, World Bank.
[23] Demirguc-Kunt, Asli, and Vojislav Maksimovic (1996) Stock Market
Development and Financing Choices of Firms, The World Bank Economic Review, vol.10, no.2.
[24] Dewatripont, M., and J. Tirole, (1994) The Prudential Regulation of Banks, The MIT Press.
[25] Diamond, D., and Dybvig (1983), Bank Runs, Deposit Insurance, and Liquidity, Journal of Political Economy, 91, 401-419.
[26] Diamond, Douglas W. (1991) Monitoring and Reputation: The Choice between Bank Loans and Directly Placed Debt, Journal of Political Economy, vol. 99, no. 4.
[27] Freixas, Xavier, and Jean-Charles Rochet (1997) Microeconomics of Banking, The MIT Press.
[28] Greene William H. (1990) Econometric Analysis, Second Edition, Prentice Hall. [29] Grossman, S. and J. Stiglitz, (1984) On the impossibility of informationally
efficient markets, American Economic Review, 70, 393-408.
[30] Harwood, A., Litan, R., and M. Pomerleano (eds.) Financial Markets and
Development - The Crisis in Emerging Markets. 1999, Brookings Institution Press, Washington D.C.
[31] Holmstrom, Bengt, and Jean Tirole (1993) Market Liquidity and Performance Monitoring, Journal of Political Economy, vol. 101, no. 4.
[32] Impavido, G., and A. R. Musalem (2000), Contractual Savings, Stock and Asset Markets, World Bank Policy Research Paper 2490.
[33] Impavido, Gregorio, Musalem, Alberto R., and Thierry Tressel (2001), Contractual Savings, Capital Markets and Firms' Financing Choices, World Bank Policy Research Paper 2186.
Gregorio Impavido, Alberto R. Musalem, and Thierry Tressel
[34] Institutional Investors Statistical Yearbook OECD 2000 Edition.
1351 Koskela, E., and R. Stenbacka (2000) Is There a Tradeoff between Bank
Competition and Financial Fragility? Journal of Banking and Finance, No.24,
1853-1873.
[36] La Porta, Rafael, Florencio Lopez-de-Silanes, Andrei Shleifer, and Robert W.
Vishny (1997) Legal Determinants of External Finance, Journal of Finance, no.52.
[37] La Porta, Rafael, Florencio Lopez-de-Silanes, Andrei Shleifer, and Robert W.
Vishny (1998) Law and Finance, Journal of Political Economy, no.
106.
[38] Levine, Ross (1997) Financial Development and Economic Growth: Views and
Agenda, Journal of Economic Literature, June.
[39] Levine,R. and Zervos, S., (1998) Stock Markets and Economic Growth, The
American Economic Review, LXXXVIII, 537-58.
[40] Maug, E., (1998) Large Shareholders as Monitors: Is There a Trade-Off between
Liquidity and Control, The Journal of Finance.
[41] OECD, (2000) Institutional Investors in Latin America.
[42] Petersen, M., and R. Rajan(1995) The Effect of Credit Market Competition on
Lending Relationships, The Quarterly Journal of Economics.
[43] Rajan, R. (1992), Insiders and Outsiders: The Choice between Informed and
Arm's- length Debt, Journal of Finance, 47, 1367- 1400.
[44] Rey, Patrick and Joseph E. Stiglitz(1993) Short-term Contracts as a Monitoring
Device, NBER Working Paper, no. 4514.
[45] Rodrik, D., and Andres Velasco (1999) Short-term Capital Flows, mimeo Harvard
University.
[46] Shleifer, Andrei, and Robert W. Vishny (1997) A Survey of Corporate Governance, Journal of Finance 52.
[47] Stulz, Rene, (2000) Does Financial Structure Matter for Economic Growth? A
Corporate Finance Perspective, mimeo.
[48] Vittas Dimitri (1999) Pension Reform and Financial Markets, Harvard Institute for
International Development, Development Discussion Paper no. 697.
[49] Vittas, Dimitri (2000) Pension Reform and Capital Market Development:
Feasiblity and Impact Preconditions. World Bank Policy Research Paper no. 2414.
-APPENDIX A
Tabl 1: TheSani
aB cGy 1Uin P hkujm=cmrm*s Lkm Cmm*s
-Wya F).A$ obthmod Re As PobCbtcs FIwvdAw*
~
t71 AR 110 Yes YS s yVs NY m
2 M.STRALA 87 YEs yes ys YEs Ys yes
3 AJSIT 149 Ye N, Ye N, Ys N,
4 IEGLM 110 Yes Yes Ys YS Ys YVs
5 1ABL 1E8 Yes YES Y_ yes N Nb
6 0t4YE 72 yVs yes Yes yVs YeS yVs 7 C-.E 35 YeS Yes YVs Yes Ys Yes 8 0341AW 105 Yes Yes YVs yVs YVs yVs
9 FNLD 17 ys Ys YeS ys Yes Ys
10 FRANC 516 Yesb Yes N, ys N,
11 GERVNi 2111 ys yes Yes Yes YVs yVs
12 25 yVs YVs VS Ys YeS YV
13 IH3NR? 31 Y Vs ys YVs YVs yVs
14 NIA 8 YeS YeVs ys Yes Yes yes
15 IAD 2 Ys Yes Ys yVs Yes yVs
16 [rALY V5 yes ys YES Yes Yes Yes
17 JAPAN 213 yVs tb YeVs N YVs b 18 IJF - E8 Vs yes yes yes Yes YeV 19 M~LAY9A 84 Yes YVs yVs yVs YVS ys
20 KS= 47 Ys yes YS Yes YS N
21 WHEIRBIA'IO 75 Ys Ys Yes Yes Ys ys 22 NBNENAND 18 Ys ys YS YES Yes Yes
23 NWAY 47 YVS Yes yes Yys s ys
24 CF13°L 48 YVs Y ess yes Vs Ys
25 9 CE 59 Ves YVs Vt ys YS Ys
26 S)U1F1AFA 67 yes Yes YVs Yes yVs YVs
27 SPAN 171 YVs Nb Vts , YeVs N
28 SRLN(A 12 Yes yVs yes Ys Yes ys
22 SAE91 30 YV yes Ms Ys ES Ys
3 SMAfli 381 yes Ys Ys Yes Yes ys
31 TDI1 34 yVs yes YVs Yes Yes YVs
32 7LRY 34 Vs N, ys N,b yVs N
33 WEDNGCM 398 Ys yVs Yes Yes Ys yes 34 UINE)SrATE; 1153 Ys Ys YES Yes YeV Y
Gregorio Impavido, Alberto R. Musalem, and Thierry Tressel
Table 2: Definition of Variables
VARIABLE DEFINITION
Banks Characteristics
Net Interest Margin (NIM) (Interest Income - Interest Expenses) I Total Assets
Profitability (Profit) Total Profit before Taxes / Total Assets
Capitalization (ETA) Equity / Total Assets
Structure of Assets ( LTA) Loans / Total Assets
Sources of Funds (STFTA) Customer & Short-term Funding / Total Assets
Overhead (OTTA) Overhead Expenses -Tax / Total Assets
Maturty of Loans (STL) Short-term Loans (maturity less than 1 year) /Totat Loans
Non Earnings Assets (CTA) Non Earnings Assets / Total Assets
Credit Risk A (LLTA) Loan Loss Provisions I Total Assets
Credit Risk B (LLLN) Loan Loss Provisions /Total Loans
Macroeconomic Factors
Inflation ( INF) Consumer Price Index Rate of Growth
GDP growth rate of growth of GDP, adjusted for inflation
Log(GDP/cap) Ln ( GDP/capita) (constant US $)
Budget Balance Central Govemment Budget Surplus (+) I Deficit (-) (% GDP)
Financial System Development
Credit to Private Sector (ec2) Credit to Pnvate Sector by Financial Intermediaries ( % GDP)
Stock Market Capitalization (ecl2) Stock Market Capitalization ( % GDP)
Stock Market Activity (ec19) Value Traded ( % GDP )
Turnover Ratio (TOR) Value Traded ( % Capitalization)
Contractual Sav/ngs Insitutions
CS Development (% GDP)
(csfaGOP or Log(csfaGDP)) Pension Funds + Life Insurance* Total Financial Assets ( % GDP)
Life + Non Life Insurance for Argentina and Brazil
-Table 3: Summary Statistics (period average)
Country ErA LTA STFTA NiM OTTA CTA Profit STL ec2 ec12 ec19 TOR csoaGDp Bud Bal. LLTA
% 34 % -% % % 34--3 W. Y. % 34 % 34 % % 34DP % Argentina 14.62 54.59 75.62 3.99 6.50 3.06 1.18 NA 28.06 16.34 4.25 30.27 2.61 -1.1o 1.56 Aust 6.45 66.91 71.80 2.36 2.26 0.76 1.38 NA 83.61 7869 31.46 38.95 s8.8 4.99 0.34 Austria 5.86 43.81 67.39 1.35 1.26 170 0.51 NA 125.62 13.87 7.16 54.12 18.70 -3.52 0.10 Bellun 3.64 3814 85.52 1.42 1.38 0.32 0.60 20.65 138.97 49.77 10.09 18.15 24.53 -4.35 0.21 Brad 8.18 33.95 62.55 6.55 9.17 1.94 0.88 NA 74.84 23.47 13.69 5627 8.15 4.67 1.15 Canada 5.69 59.81 81.09 2.05 1.91 1.17 0.96 NA 96.59 73.17 37.40 48.85 60.84 -3.80 0.53 Swterand 5.48 44.78 67.75 1.05 2.02 2.31 0.61 62.25 180.83 156.85 121.95 71.71 96.69 -1.22 0.34 Chile 6.31 49.68 59.74 2.69 2.26 7.76 -0.02 NA 64.89 96.73 9.27 9.37 42.23 1.84 0.34 G many 3.65 55.73 62.22 1.46 1.08 1.09 0.56 38.04 126.58 32.96 35.10 105.37 21.82 -1.78 0.06 Drmwk 7.15 65.34 45.49 2.18 1.18 0.69 0.78 26.16 57.62 40.56 18.41 46.56 52.06 -0.93 o.as Spdn 6i15 48.96 76.81 2.70 1.99 2.84 1.16 NA 105.55 41.13 46.35 86.99 1298B 4.78 0.49 Flniand 5.52 48.80 74.03 1.73 1.76 0.94 0.05 31.73 72.74 69.25 24.62 33.08 43.56 -8.00 0.75 Francs 4.74 41.53 70.24 1AO 1.53 0.59 0.41 NA 103.35 46.29 24.34 51.16 29.79 -4.47 0.51 United Kingdom 5.32 52.54 75.55 2.03 2.01 1.91 1.07 26.74 122.62 135.96 54.89 39.50 132.21 -3.71 0.42 Groom 4.80 40.51 77.95 1.65 1.74 7.51 1.21 92.53 95.00 38.26 25.71 41.54 845 68.37 0.31 Hunguy 4.41 38.15 55.58 2.35 2.61 16.53 -0.81 54.94 80.26 1359 9.62 39.94 2.41 4.35 2.36 Indla 614 41.13 64.27 3.46 1.80 OA1 1.78 NA 47.98 31.60 11.15 36.48 7.23 -2.63 0.28 Ireland 7.27 56.06 77.58 2.09 1.62 1.75 1.17 27.20 69.98 28.57 3zs1 106.46 53.66 -1.33 0.24 Ilaiy 6.16 49.35 66.48 2.30 2.05 0.53 0.69 57.05 97.33 26.21 15.77 49.67 10.16 -7.75 0.47 Japan 4.44 62.32 7Z46 122 1.19 0.70 0.05 44.05 251.86 74.17 26.78 36.61 29.59 0.16 0.80 Korea 5.22 52.25 72.74 1.56 1.68 2.24 0.07 NA 73.93 38.29 59.69 165.79 22.05 -0.29 0.40 SrlLanka 6.80 44.86 54.15 3.05 2.63 7.46 1.40 NA 35.20 16.57 2.22 12.87 156.87 -6.77 049 MexIco 6.25 60.15 73.91 2.39 2.23 3.14 0.48 NA 36.96 34.12 12.37 36.82 0.63 0.63 0.62 Malaysa 7.57 52.83 85.34 215 0.88 4.28 1.02 NA 130.25 207.07 108.41 53.91 21.33 1.60 0.78 NewZealand 4.77 72.66 83.17 2.82 2.37 0.34 1.33 NA 98.74 54.38 16.52 3029 19.31 1.62 0.11 Netherlands 5.19 55.79 67.75 1.60 1.76 1.01 0.86 NA 113.14 96.18 72.92 64.23 132.58 -2.25 024 Norway 6.91 63.79 65.90 2.47 1.97 1.01 1.00 NA 79.07 30.67 18.51 57.08 29.78 -1.82 0.66 pogal 5.63 41.46 80.59 2.58 2.02 3.92 0.75 2741 89.05 27.44 14.24 42.32 10.40 NA NA Singapore 11.18 43.60 82.27 1.33 0.47 2.30 1.24 63.79 81.66 159.46 76.88 46.79 94.06 11.63 028 Sweden 5.15 68.54 46.94 1.63 1.11 0.55 0.44 21.80 125.93 64.09 48.84 52.53 39.84 -7.41 1. 9 Thailand 6.30 66.77 78.43 2.31 1.64 z38 -0.35 NA 130.67 57.43 38.43 72.10 3.86 1.22 1.18 Turkey 10.31 37.68 74.91 7.71 4.83 2.70 3.56 79.64 33.03 21.38 22.22 115.83 0.24 -5.67 0.41 SouthAira 7.67 86.79 82.68 3.04 2.91 1.02 1.53 NA 134.17 157.36 22.21 13.95 102.69 -5.45 6.52 UnitdStates 6.35 37.44 63.82 2.18 2.72 3.43 1.43 NA 133.24 109.05 91.32 77.08 86.99 -2.38 0.28
Gregorio Impavido, Alberto R. Musalem, and Thierry Tressel
Table 4: Pairwise Correlations
ETA LTA STFTA NIM Profit OTTA CTA
ETA 1 LTA -0.0161 1 0.7717 STFTA 0.0801 0.0164 1 0.1502 0.7693 NIM 0.4629 -0.1108 0.0448 1 0 0.0455 0.4218 Profit 0.4304 -0.0825 -0.0181 0.4237 1 0 0.1386 0.7448 0 OTTA 0.4622 -0.2043 0.0368 0.6905 0.1428 1 0 0.0002 0.5092 0 0.0101 CTA -0.0217 -0.2578 -0.1733 -0.0088 -0.0065 0.0316 1 0.6976 0 0.0017 0.8744 0.9069 0.5704 STL 0.2065 -0.6058 0.2039 0.2517 0.1798 0.3336 0.2593 0.0214 0 0.0231 0.0048 0.0457 0.0002 0.0036 LLTA 0.14 0.0795 0.0554 0.193 -0.4666 0.2647 0.0095 0.0133 0.1612 0.3308 0.0006 0 0 0.8678 LLLN 0.1376 -0.0939 0.0408 0.2244 -0.4432 0.3275 0.0516 0.015 0.0979 0.4744 0.0001 0 0 0.3651 ec2 -0.3393 0.1425 0.1167 -0.3363 -0.1954 -0.2887 -0.1226 0 0.0171 0.0515 0 0.001 0 0.0407 ec12 0.0212 0.0587 0.1681 -0.2161 0.1188 -0.247 -0.0459 0.7182 0.3185 0.0041 0.0002 0.0433 0 0.4363 ecIg -0.0116 -0.0683 0.0392 -0.2017 0.1271 -0.205 -0.0315 0.8441 0.2462 0.5067 0.0005 0.0307 0.0005 0.5935 TOR -0.0383 -0.0591 -0.0606 0.0028 0.1148 -0.0373 -0.0961 0.5154 0.3161 0.3048 0.962 0.0513 0.5272 0.1032 LogCSfa,%GDP -0.2026 0.2006 0.0259 -0.5857 -0.2577 -0.434 -0.253 0.0032 0.0035 0.7095 0 0.0002 0 0.0002 Csfa,%GDP 0.0204 0.1166 0.1019 -0.2648 0.0233 -0.187 -0.1611 0.7691 0.092 0.1413 0.0001 0.7375 0.0066 0.0195
STL LLTA LLLN *c2 *c12 ec19 TOR
STL 1 LLTA -0.046 1 0.6123 LLLN 0.0419 0.9613 1 0.6442 0 ec2 -0.1445 -0.024 -0.066 1 0.1413 0.6949 0.2809 *c12 0.0761 -0.19 -0.1967 0.3627 1 0.4297 0.0014 0.0009 0 Oc19 0.2208 -0.1593 -0.1462 0.3224 0.7544 1 0.021 0.0076 .0144 0 0 TOR 0.1792 -0.1032 -0.0878 0.0203 -0.0204 0.4393 1 0.0622 0.0849 0.1429 0.7352 0.727 0 LogCSfa,%GDP -0.4895 -0.1504 -0.2295 0.3929 0.571 0.3587 -0.2162 0 0.0327 0.001 0 0 0 0.0017 Csfa,%GDP -0.2067 -0.1795 -0.2355 0.2947 0.7248 0.5148 -0.1285 0.0592 0.0106 0.0007 0 0 0 0.0644
note: p-values are in italic
-Figure 1: Maturity of Loans and Contractual Savings ° STL Fdted values 96.0695-.00062- * .. -7.48757 .517491 LOgCS-fa,%GDP(-1 )
Regression Line: STL =-6.03 (4.58) * Log(Csfa,%GDP)+37.5 (R2=0.18)
Figure 2: Net Interest Margin and Contractual Savings
o NIM Fitted values
11.8842- ,
_~~~~~~~~~~~~~~~~~~~ 0
.565787--7.48757 .517491
LogCSf-,%GDP(-1)
Gregorio Impavido, Alberto R. Musalem, and Thierry Tressel
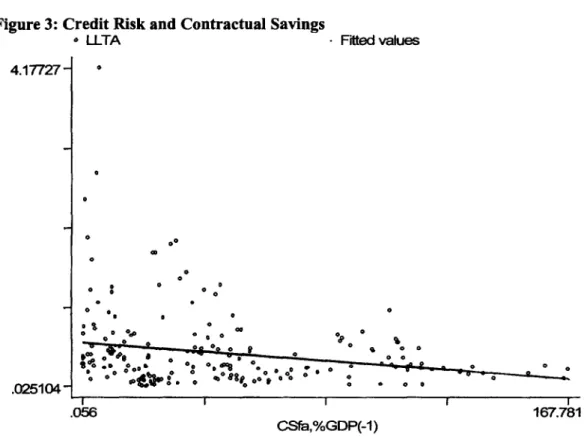
Figure 3: Credit Risk and Contractual Savings
o
LLTA
Fited values4.17727-00 G 0 0 ° ° 0~~~~~~~~~~ 0~~~~~~~~~
.025104
-
,
0.0
.056 167.781 CSfa,%GDP(-1)Regression Line: LLTA = -2.8 E-3 (-3.23) * Csfa,%GDP + 0.6 (R2 = 0.043)
-Table 5: Contractual Savings Institutions
and Bank Net Interest Margins
Pooled and Panel Estimates
Dependent Variable: Net Interest Margin
Explanatory Variables: OLS Fixed Effects
CS variable dated t-1 IV dated t-1 IV
Banks' Characteristics:
Capitalization (ETA) 0.112 0.106** 0.15w 0.153*
607 5.85 9.99 10.61
Structure of Assets ( LTA) 0.031 ** 0.0307 **C 0.038 * 0.039
13.53 12.75 10.69 10.82
Sources of Funds (STFTA) 0.008 ** 0.007 0.005 0.006 *
3.33 3.02 1.69 1.91
Non Earnings Assets (CTA) -0.007 -0.014 0.027 *** 0.012
-0.53 -1.72 295 0.60 Overhead (OTTA) 0.377 *** 0.388 0.533 0.526 9,01 8.50 8.77 8.91 Macroeconomic Factors: Inflation 0.038 ** 0.043 ** -0.028 *** -0.032 5.46 6.55 -2.82 -3.03 GDP growth 0.035** 0.048 -0.016 -0.021 ** 2.33 3.61 -1.55 -1.85 Log (GDP/Capita) -0.03 -0.05 -0.12 -0.09 -0.47 -0.72 -0.54 0.42
Government Budget Balance (% GDP) -0.03 * -0.031 -0.016 * -0.021 **
-3.71 -3.88 -1.63 -2.17
Financial System Development:
Credit to Private Sector -0.0010 -0.0007 -0.005 ** -0.008
.1.00 -0.68 -2.18 -2.83
Stock Market Capitalization -0.0008 -0.0016 0.0008 0.0010
-0.57 -1.12 0.55 0.72
Stock Market Activity 0.0023 0.0030 0.0037 ** 0.0034
1,28 1.64 2.69 2.57
Stock Market Liquidity -0.0026 ** -0.0032 *** -0.0029 ** -0.0027
(Turnover Ratio) .2.16 -2.64 -3.39 .3.01
Contractual Savings Development -0.171 * -0. 17 *** 0.061 0.189
( Log of financial assets, % GDP) -4.26 -4.27 0.47 1.39
Year Dummies Yes Yes Yes Yes
Wald Test 1140.75 (20) 1162 (20) 3660.1 (48) 3865 (48)
Nb of Observations 156 153 156 153
Nb of Years 7 7 7 7
Nb of Countries 30 30 30 30
Method of estimation:
GLS, with heteroscedastic error structure and no autocorrelation within panel; no cross-sectional correlation.
Instruments dated t-1 for contractual savings variable:
dependent variable, real GDP per capita growth, rate of change of M2/GDP, rate of change of real effective exchange rate, volatility of inflation, volatility of interest rate, openness, share of the population over 64, bank credit, market capitalization and liquidity
Gregorio Impavido, Alberto R. Musalem, and Thierry Tressel
Table 6: Contractual Savings Institutions
and Bank Profitability
Pooled and Panel Estimates
Dependent Variable: Profitability (Profit before Tax I Total Assets)
Explanatory Variables: OLS Fixed Effects
CS variable dated t-1 IV dated t-1 IV
Banks' Characteristics:
Capitalization (ETA) 0.126 *** 0.127 0.281 0.289
6.06 5.96 10.19 10.11
Structure of Assets ( LTA) 0.021 0.0205 * -0.013 -0.012 **
7.11 6.94 -2.41 -210
Sources of Funds (STFTA) 0.016 0.017 * 0.0048 0.0056
5.65 5.54 0.86 0.93
Non Earnings Assets (CTA) 0.022 0.024 0.012 -0.006
Z85 2.88 2.45 -.29 Overhead (OQUA) 0.033 0.035 -0.219 -0.246 0.58 0.60 -2.59 -293 Macroeconomic Factors: Inflation 0.056 0.056 0.0195 0.033 ** 7.57 7.51 1.42 2.05 GDP growth 0.066 0.065 0.038 0.056 3.924 3.89 2596 3.218
Log (GDP/Capita) 0.27 *** 0.308 1.18 1** i.12 ***
2.663 2.894 a319 3.202
Govemment Budget Balance (% GDP) -0.013 -0.015 -0.008 -0.014
-1.351 -1.525 -0.586 -0.967
Financial System Development:
Credit to Private Sector 0.0036 *** 0.0037 -0.0139*** -0.0138***
3.39 3.40 -3.88 -3.09
Stock Market Capitalization -0.00076 -0.00024 -0.00066 -0.00027
-0.46 40.144 -0.371 40.138
Stock Market Activity 0.0029 0.0025 0.0020 0.0013
1.47 1.28 1.19 0.74
Stock Market Liquidity -0.002 *** -0.0019 -0.0011 -0.001
(Tumover Ratio) -2.61 -2.26 -1.19 -0.64
Contractual Savings Development 0.313 -0.239 0.31 * 0.316
( Log of financial assets, % GDP) 0.096 -0.478 1.87 1.61
Year Dummies Yes Yes Yes Yes
Wald Test 418.9 (20) 405.46 (20) 1202 (48) 1117.85 (48)
Nb of Observations 156 153 156 153
Nb of Years Included 7 7 7 7
Nb of Countries 30 30 30 30
Method of estimation:
GLS, with hetemscedastic error stivcture and no autocorrelation within panel; no cross-sectional correlation.
Instruments dated t-1 for contractual savings variable:
contractual savings variable, real GDP per rapita growth, rate of change of M2VGDP, rate of change of real effective exchange rate,
volatlity of inflabon, volatility of interest rate, openness, share of the populabon over 64, bank credit market capitalizabon and liquidity
-Table 7: Contractual Savings Institutions
and Bank Loan Maturity
Pooled and Panel Estimates
Dependent Variable: Loan Maturity (Short-term Loans I Total Loans)
Explanatory Variables: OLS Fibed Effects
CS variable dated ti- rIv dated t1 IV
Banks' Characteristics:
Capitalization (ETA) -0.727 -0.822 0.776 1.414
-0.66 -0.71 0.99 1.82
Structure of Assets ( LTA) -0.026 0.169 -1.024 *** -1.305
-0.05 0.32 -2.74 -3.23
Sources of Funds (STFTA) 0.577 * 0.496 0.259 0.503
1.82 1.33 0.93 1i70
Non Eamings Assets (CTA) -0.046 -0.570 -0.725 0.665
-0.07 -0.66 -2.33 1.05 Overhead (OTTA) -3.61 -2.38 -11.19* -11.81 -0.85 -0.55 -3.07 -2.86 Macroeconomic Factors: Inflation -0.543 -1.059 -1.96*** -1.82 -1.04 -1.62 -4.81 -3.34 GDP growth -0.334 -0.707 -1.48*** -1.35 -0.42 -0.83 -2.84 -1.93 Log (GDP/Capita) -10.34 -30.96 ** -32.59 - -30.28 -0.92 -1.86 -2.59 -2.29
Govemment Budget Balance (% GDP) 0.727 1.237 1.738 - 2.108
1.04 1.52 3.04 141
Financial System Development:
Credit to Private Sector -0.033 -0.003 0.208 0.258
-0.45 -0.03 1.46 1.23
Stock Market Capitalization -0.100 -0.217 -0.068 -0.090
-0.82 -1.49 -0.64 -0.82
Stock Market Activity 0.544 ** 0.676 0.315*** 0.311
347 3.97 2.82 270
Stock Market Liquidity -0.081 -0.106 -0.104 -0.135
(Tumover Ratio) -0.86 -1.08 -2.87 -3.39
Contractual Savings Development -11.98 --- -10.86 ** -8.123 -11.9 ( Log of financial assets, % GDP) -2.94 -2.19 -1.48 -1.84
Year Dummies Yes Yes Yes Yes
Wald Test 193.73 (19) 165 (23) 4660.5 (32) 2329 (33) Log Likelihood -237.36 -235.13 -154.5 -153.51 Nb of Observations 67 65 67 65 Nb of Years 6 6 6 6 Nb of Countries 14 14 14 14 Method of estimatiorr
GLS, with heteroscedastic error structure and no autocorretation within panel; no cross-sectional correlation.
Instruments dated t-1 for contractual savings variable:
dependent variable, real GDP per capita growth, rate ot change of M2/GDP, rate ot change of real effective exchange rate,