The Relationship between Oil Price, Exchange Rate and Islamic
Stock Market in Malaysia
Mohd Yahya Mohd Hussin1* Fidlizan Muhammad1 Mohd Fauzi Abu @ Hussin2 Azila Abdul Razak1 1. Department of Economics, Faculty of Management and Economics, Sultan Idris Education University,
35900 Tanjong Malim, Perak, Malaysia.
2. Faculty of Islamic Civilization, University of Technology, Malaysia, 81310 Skudai, Johor, Malaysia *E-mail of the corresponding author: yahya@fpe.upsi.edu.my
Abstract
This research discusses the relationship between oil price, macroeconomic variables and Islamic stock market in Malaysia. The objective of this research is to analyze the dynamic effects of oil price and macroeconomic variables changes on Islamic stock market in Malaysia using an estimation of Vector Auto Regression (VAR) method. The variables involved in this research are Crude Oil Price (COP), Foreign exchange rates of Ringgit Malaysia - United States Dollar (MYR) and FTSE Bursa Malaysia Emas Shariah Index (FBMES). Using monthly data over the period January 2007 - December 2011, the study applies the co-integration analysis, multivariate Granger causality test, Impulse Response Function (IRF) and Variance Decomposition (VDC) analysis. The findings showed that Islamic stock prices are co-integrated with oil price and exchange rate variables. Based on cointegration relationship analysis, the Islamic stock price is positively and significantly related to the oil price variable but inversely and not significantly related to the exchange rate variable. Using Granger causality test, only oil price variable is Granger-caused by the Islamic stock return in Malaysia. Therefore, oil price shock will affect the Islamic stock return in the short and long run in Malaysia.
Keywords: Malaysian, expenditure on education, economic growth, vector error correction model.
1. Introduction
The past few years have seen a surge into research pertaining to oil price, partially due to the recent increase in the price of this strategic commodity which plays vital roles in the global economy. Oil, one of the most traded commodities in the world, has observed numerous price fluctuations which have not only been associated with major world development but also believed as a trigger for economic inflation or recession.
The rise in oil prices may affect the economy in a various ways particularly in the rise in the cost of production of goods and services, which in turn may affect the rate of inflation, consumer confidence, as well as financial markets. In relation to this matter, an earlier study conducted by Hamilton (1983) shows that higher oil prices contributed to the U.S recessions particularly after World War II. Later on, Hamilton’s basic findings were extended by several researchers (such as Burbridge and Harrison, 1984; Gisser and Goodwin; 1986, Park and Ratti; (2008), Kilian and Park (2009) and Narayan and Narayan (2010) by utilizing different set of data and estimation procedures.
On the other hand, establishing the relationship between stock prices and exchange rates is important for a few reasons. First, it may affect economic decisions in terms of monetary and fiscal policy. According to Gavin (1989), booming stock market has a positive effect on aggregate demand and if the stock market booming is large enough, monetary expansion or fiscal policies contraction that focus on interest rate and the real exchange rate will definitely be neutralized. Several policy-makers have suggested that in order to boost the export sector there is a need to reduce currency exchange, and at the same time they should be aware whether such policy might discourage the stock market activities. Second, it is argued that, by understanding the relationship of stock prices and exchange rate it will assist to predict the possibility of financial downturn. As argued by Khalid and Kawai (2003), Ito and Yuko (2004), the link between the stock and currency markets helped propagate the Asian Financial Crisis that occurred in 1997. The sharp depreciation of Thai Baht is believed to be the factor that triggers Thailand’s neighboring countries’ currency depreciation, which also led to stock markets collapse. It is clear that, knowledge on the relationship between the two markets would be helpful in preventing the spread of an economic crisis.
Gogineni, 2007; Kilian and Park, 2009; Lin et al., 2010; Miller and Ratti, 2009; Narayan and Narayan, 2010; Papapetrou, 1999, 2001; Sadorsky, 2001; and Yurtsever and Zahor, 2007). However, there is almost non-existent research on the relationship between oil price, exchange rate, and stock market. Our paper, thus, aims to fill this gap, examines the dynamic relationships between the prices of oil, exchange rate, and the Islamic stock market and taking Malaysia as a case study to be examined.
Islamic stock market is a suitable place for investors to avoid the threat of inflation and at the same time is an indicator towards the development of a nation in term of economics (Mohd Hussin and Borhan 2009). In other words, The FTSE Bursa Malaysia Emas Shariah (FBMES), which is a weighted-average index with its components established by the Main Board companies and designated as Shariah approved securities by the Shariah Advisory Council of the Securities Commission, is indeed related to the movement of oil price growth in Malaysia. Evidence of this in the history of the FBMES can be seen from as far back as 2008 in which the movement of the Syariah Index witnessed a decrease of about 43%. The decrease occurred simultaneously to a -61% movement in Malaysia’s crude oil price in 2008. Nevertheless, in 2009, crude oil prices increased by 99% with the FBMES witnessing an incredibly positive growth of 43%. In 2010, Malaysia experienced a positive growth of 18.2% in the FBMES that was in line with the low positive growth (11%) of crude oil price. In 2011, however, when oil prices recorded a high percentage of 30% growth, the Islamic stock market grew by only 1.8%. These results proved the general correlation between the growths of crude oil price in relation to the growth of the Islamic stock market in Malaysia. As a result of this, fund managers and investors must consider all economic factors, including the crude oil price in Malaysia which is liable to influence their Islamic stock, before making any investment decisions.
Many studies have also been carried out on the relationship between stock returns and macro variables, with the exception of oil price. Regional stock markets, such as Malaysia, have also been left unexplored due to their small sizes and geographic locations. In this paper, we examined the relationships between the FBM Emas Shariah Index (FBMES) with crude oil price and exchange rate from January 2007 to December 2011 using vector autoregressive (VAR) model.
The rest of the paper is organized as follows. Section 2 reviews previous research on the relationships between crude oil price and exchange rate variables with stock returns. Section 3 provides an overview of the Islamic Stock Market in Malaysia and Section 4 will describe the data used in the research. The econometric methods/methodology and results will be discussed in Sections 5 and 6, respectively. The paper will be concluded in Section 7.
2. Literature Review
The dynamic relationship between share returns and macroeconomic variables have been extensively studied in the past empirical literature. The share return is determined by the macroeconomic variables using the expected discounted cash flow model. It can be said, then, that share return determinants are the required rate of return and expected cash flows (Elton and Gruber, 1991). Thus, economic variables such as oil prices and exchange rate which give an impact on required returns and future cash flows, can therefore be expected to affect share prices. Hence, it can be concluded that there existed a stable relationship between stock prices and related macroeconomic variables and strategic commodity variables.
Specifically, the relevant literature generated mixed views on the effects of such oil price shocks on asset prices, stock prices are being an example of this. Stock price and oil price relationships can exist either positively or negatively. Sadorsky (1999) studied the relationship between shocks that occurred in oil prices in the U.S.A and the stock exchange. The results of the study using the data from 1947-1996, where the VAR and GARCH analyses were applied and interest rate and industrial production output were included, revealed that oil-price volatility had a negative effect on stock prices. Additionally, Papapetrau (2001) in his study investigated the dynamic relationship between oil price shocks, the stock exchange (stock prices) and economic activities (interest rate and work force) in Greece. His research discovered that oil price shocks negatively impacted the stock, seeing as they negatively affected output and employment growth.
Nandha and Faff (2008) examined how oil prices changes affected equity price and also explored the existence of an asymmetric impact of oil price towards equity returns. Their results suggest that oil prices negatively impacted real output and adversely affected corporate profits when oil was used as an input. However, when the asymmetry of the price effect was tested they found that the effect of oil price change on equity price was symmetric and not asymmetric as expected. O’Neil et al. (2008) and Park and Ratti (2008) showed that oil price shocks statistically and significantly had a negative effect on stock prices for an extended sample of 13
developed markets. This was further expanded by Miller and Ratti’s (2009) investigation on the long term relationship between international crude oil prices and international stock exchanges. According to their study performed within the period 1971-2008 (separated based on periods) and within the scope of the OECD countries and in which the VECM model was used, it was found that there was a long term relationship between variables between periods 1971-1980 and 1988-1999, and that the stock exchange responded negatively to long term increases in oil prices.
On the other hand, Sadorsky (2001), who uses a multifactor market, which takes into account the presence of several risk premiums, identifies factors such as exchange rate and interest rate alongside the actual price of oil itself as the main determinants of oil and gas stock returns. His study also found a significantly positive relationship between the price of oil and the stock returns from gas and oil firms. These findings are concurrent with Arouri and Julien (2009) who found that the stock market in GCC countries reacted mostly positively to oil and price increases. Lin et al. (2010) also proved that oil prices had a positive relationship with stock returns in China based upon the positive expectation effect. Furthermore, the studies of Gogineni (2007), and Yurtsever and Zahor (2007) also helped provide statistical support for a number of hypotheses. For example, one of these was that oil prices were positively associated with stock prices if oil price shocks reflected changes in aggregate demand, but they were negatively associated with stock price if they reflected changes in supply.
On the other side, there are also attempts among the economist to predict stock prices and its returns in the financial market. Madura (2008) for example argued that stock prices are possibly affected by three factors, namely the economic factor (interest rate and foreign exchange rate), market related factor, and firm-specific factor. On the other hand, exchange rates are highly responsive to the stock market changes and global portfolio investments as compared to the past. Therefore, it is suggested that there is a need to evaluate the relationship between stock prices and exchange rates since the results would be able to bring some impact on monetary and fiscal policies.
An empirical study by Aggarwal (1981) concerning on the influence of exchange rate changes on U.S. stock prices. By using monthly data for the floating rate period from 1974 to 1978, the study revealed that stock prices and exchange rates are positively correlated. Tsoukalas (2003) evaluated the relationship between stock prices and macroeconomic factors in Cyprus. Similarly, there is strong relationship between stock prices and exchange rates. This is due to Cypriot economy dependency on services (import sector) such as tourism, off shore banking
etc.
In the case of Turkey, Sevuktekin and Nargelecekenler (2007) utilized monthly data from 1986 to 2006 and concluded there was a positive and bidirectional causality between these two financial variables. Furthermore, Sohail and Hussain (2009) examined the long & short run relationship between macroeconomic variables and Lahore stock exchange in Pakistan. The result revealed that real effective exchange rates had a significant positive impact on stock returns in long run.
On the other hand, Ajayi and Mougoue (1996) investigated the relationship between exchange rates and stock indices in eight advanced economies. By using daily data from 1985 to 1991, they found that, in the short run, there are negative effects in the rise of stock price and positive long-run effects on domestic currency value. They also concluded that, currency depreciation has negatively affected the stock market in both short-run and long-run. Meanwhile, Kim (2003) employed monthly data between 1974:01 and 1998:12 periods in the USA and suggested that S&P’s common stock price is negatively related to the exchange rate.
Furthermore, by using Malaysia’s monthly data over the period of 1977 – 1998, Ibrahim and Aziz (2003) analyzed dynamic linkages between stock prices and four macroeconomic variables in Malaysia. The study revealed that there is an inverse relation between exchange rate and stock prices. In examining dynamic relationship between stocks and exchange rates among six Asian countries (Indonesia, Malaysia, Philippines, South Korea, Thailand, and Taiwan), Doong et al. (2005) employed the data between 1989 and 2003 from these countries. The study exhibited that, the stock return is negatively correlated with the contemporaneous change in the exchange rates for all countries except Thailand. Moreover, study on the effect of exchange rate fluctuations and their impact on the Ghana stock exchange by Adjasi and Harvey (2008) concluded similar result where there is negative relationship between exchange rate volatility and stock market returns.
In relation with a study among the more developed countries, Nieh and Lee (2001) obtained data from G-7 countries for the period from October 1, 1993 to February 15, 1996 to examine the relationship between stock prices and exchange rate. They found that, there is no long-run equilibrium relationship between stock prices and exchange rates for each G-7 countries. This finding is also consistent with a study by Smyth and Nandha (2003) that investigated similar relationship among the South Asian countries which include India, Bangladesh, Sri
Lanka, and Pakistan over the period of 1995-2001. It was concluded that, there is no long run relationship between exchange rates and stock prices in those countries. Meanwhile, similar study was conducted in USA by using quarterly data from 1960 to 2004. Ozair (2006) in his study shows that there is no causal linkage and no co-integration between these two financial variables in United States economy.
By using different approach, Aurangzeb and Asif (2012) investigated the effect of time on time on stock prices, short term interest rates, and exchange rate on stock exchange with respect to Pakistani economy. They utilized Pakistani monthly data between 2005 and 2010 and concluded that, the time has significantly influenced stock prices and exchange rates.
Based on the literature reviews, it is generally concluded that there are no uniformity of the relationship between stock price and exchange rate. The findings from the previous studies vary depending on the country’s economic status and methodology used in the analysis.
3. Islamic Stock Market in Malaysia
The Islamic stock market can be considered one of the important branches of the Islamic capital market whereby its components and activities are based on Islamic law, which is based on venerable sources and approved by the Fiqh Ulama (Mohd Hussin and Muhammad; 2011). The Islamic stock market has been established based on 5 main principles of operation: preventing any practice of usury, sharing risks, preventing widespread speculation, compliance of the akad with the stated contract and the activity implemented must be legal in the Syariah aspect (Bacha; 2002).The guidelines governing the Islamic stock markets are derived from the main sources of Islam, namely the holy Quran and sunnah (traditions of Prophet Muhammad). In applying the relevant guidelines to the concrete context of the stock market, Islamic scholars embark on a comprehensive assessment of the appropriate guidelines from these sources and establish basic doctrine that govern the rights and obligations of the players in the Islamic stock markets. Besides the main sources, ijtihad (exertion or logical deduction) is also involved in the shari’ah rulings (Kassim, 2010).
The Kuala Lumpur Syariah Index (KLSI) was launched by the Kuala Lumpur Stock Exchange, now Bursa Malaysia in April 17, 1999. This was the first step infacilitating participation in equity investments that are well-matched with the Islamic principles of Shariah. The KLSI provides a benchmark for investors seeking to make investments based on Shariah principles and this helps them to make better informed decisions.
The first move in facilitating the development and innovation of Islamic financial products in Malaysia was to establish the Shariah Advisory Council (SAC) at the Security Commission (SC) soon after SC's own establishment in 1993. This provided the most important gateway for the development of KLSI and other Islamic capital market products and services that followed. Since then, Malaysia has established itself as a key player in the global Islamic sphere, where the Islamic capital market is specifically recognized as a hallmark of international financial success. Mohd Hussin and Muhammad (2011) reported in 2009 that there were over 88 percent of total listed Islamic equity companies in Malaysia. In the latest development, Bursa Malaysia, in co-operation with FTSE, introduced a new series of tradable equity indices called FTSE-Bursa Malaysia Emas Shariah Index (FBMES) and FTSE-Bursa Malaysia Hijrah Shariah Index (FBMHS). This development helped to create more opportunities for investors seeking Shariah investments to benchmark their portfolios, and the asset managers to create new products serving the investment community.
The selection of Shariah-compliant companies takes place through a screening process based on qualitative and quantitative parameters. Therefore, in the qualitative criteria, The SAC has applied a standard criterion in focusing on the activities of the companies listed on Bursa Malaysia. The companies whose activities are not contrary to the Shariah principles will be classified as Shariah-compliant securities (Mohd Hussin and Borhan, 2009).
4. Data Description
A total of two macroeconomic variables and FBMES indices had been used in the analysis. The definitions of each variable and time-series transformation are described in Table 1.
5. Methodology
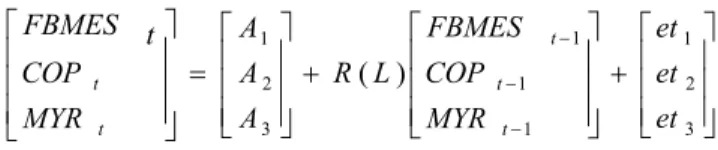
We adopted a vector autoregressive (VAR) model to examine the relationship between oil price and exchange rate variables on Islamic stock market index in Malaysia. Model developed and applied in this study is as follow:
t t t t
COP
MYR
FBMES
:
α
0+
α
1+
α
2+
µ
(1)It aims to examine the relationship between Islamic stock market variables, namely FBM Emas Shariah Index (FBMES) with two macroeconomic variables, namely the Crude Oil Price (COP) Foreign Exchange Rates of Ringgit Malaysia - United States Dollar (MYR) based on discounted cash flow model (Kearney and Daly (1998). Based on the VAR regression method, the above-mentioned model has seven variables and can be written as:
+ + = − − − 3 2 1 1 1 1 3 2 1 ) ( et et et MYR COP FBMES L R A A A MYR COP t FBMES t t t t t (2)
Where R is 3 x 3 matrix polynomial parameter estimators, (L) is lag length operators,A is an intercept and et is Gaussian error vector with mean zero and Ω is a Varian matrix.
To properly specify the VAR model, we followed the standard procedure of time series analyses. First, we applied the commonly used augmented Dickey-Fuller (ADF) and Phillips-Perron (PP) unit root tests to determine the variables' stationarity properties or integration order. Briefly stated, a variable is said to be integrated of order d, written 1(d), if it requires differencing d times to achieve stationarity. Thus, the variable is non-stationary if it is integrated of order 1 or higher. Classification of the variables into stationary and non-stationary variables is crucial since standard statistical procedures can handle only stationary series. Moreover, there also exists a possible long-run co-movement, termed cointegration, among non-stationary variables having the same integration order. In this study, the lag length is determined based on Akaike Information Criterion (AIC) which is commonly used for the VAR model.
Accordingly, in the second step, we implemented a VAR-based approach of cointegration test suggested by Johansen (1988) and Johansen and Juselius (1990). Appropriately, the test provides us information on whether the variables, particularly measures of oil price and macroeconomic variables with Islamic stock market and are tied together in the long run. Then the study proceeded with a Granger causality test in the form of vector error correction model (VECM). Granger causality test is performed to identify the existence and nature of the causality relationship between the variables. This is appropriate to identify relationships between variables because multiple causes simultaneously, especially if the variables involved in the created model more than two variables. Next, this study conducts Impulse Response Function (IRF) to ascertain how each variable responds over time to a shock in itself and in other variable by using the innovation technique. The IRF essentially maps out the dynamic response path of a variable to a change in one of the variable’s innovations. Finally, the Variance Decomposition (VDC) is adopted to indicate the degree of exogeneity between variables outside of the sampling period. The VDC shows the percentage of forecast error variance for each variable that may be attributed to its own shocks and to fluctuations in the other variables in the system.
6. Empirical Results
Table 2 presents the results for the unit-root tests using Phillips-Perron (PP) and Augmented Dickey-Fuller (ADF) tests for the order of integration of each variable. For the level of the series, the null hypothesis of the series having unit roots cannot be rejected at even 10% level except IIR. However, it is soundly rejected for each differenced series. This implies that the variables are integrated of order I(1).
Having established that the variables are stationary and have the same order of integration, we proceeded to test whether they are cointegrated. To achieve this, Johansen Multivariate Cointegration test is employed. The results of the Johansen’s Trace and Max Eigenvalue tests are shown in Table 3. At the 5% significance level, the Trace test suggested that the variables are cointegrated with r ≤ 0 while Maximum Eigen test suggested the variables are not cointegrated. Therefore, Cheung and Lai (1993) suggested the rank will be dependent on the Trace test results because Trace test showed more robustness to both skewness and excess kurtosis in the residual, which implied that there are at least 1 cointegration vectors found in this model.
These values represent long-term elasticity measures, due to logarithmic transformation of FBMES, COP and MYR in Table 3. Thus the cointegration relationship can be re-expressed as Table 4:
The values of FBMES in the long-term equation indicate that they are statistically significant and positively correlated with the crude oil prices. The finding is consistent with studies by Sadorsky (2001), Arouri and Julien (2009) and Lin et al. (2010) in the case of USA, GCC countries and China respectively. It is believed that, the
positive relationship are based on few factors: 1) the positive expectation effect which means that the expectation on the Malaysian economic performances and continuation of capital flow during the higher oil price period are very strong among the investors, 2) the oil prices were positively associated with stock prices, by this it means that any shocks in oil price will reflect changes in aggregate demand, 3) Islamic stock indices consist from gas and oil firms.
With regards to the the foreign exchange rate (MYR) with the Islamic share price (FBMES), the finding from the analysis indicate that these two variables have had negative long-term relationship, but, they were statitistically insignficant. This finding is supported by previous studies on the similar issue. These for example, studies by Kim (2003) for U.S.A., Ibrahim and Aziz (2003) for the Malaysian stock market, Doong et al. (2005) for the Six Asian countries and Adjasi and Harvey (2008) for Ghana. Ibrahim and Wan (2001) argued that the negative relationship between the variables could possibly due to the status of the nation which depends on export value (international trade) The declining value of the currency would also encourage more exports. Nevertheless, devaluation of currency value would increase the production costs which were caused by the rise of domestic prices as regards to capital goods and imported mediators. Thus, it would in turn minimize firm’s profit margin and in consequence decrease firm’s share prices.
Long term Granger Causal Relationship can be seen based on the value of ECT-1 for every variable in Table 5. Based on the result ofVECM test, it is found that the value of ECT-1 for FBMES variable is significant. This proves that the variables of oil price and exchange rate are the long term Granger cause for Islamic stock returns in Malaysia. In other words, FBMES variable in the equation bear the burden of dispersed error correction of short term balance to achieve long term equailbrium as much as 18.5 percent in one period and demonstrates endogenuinity towards the formed model.
Short term Granger Causal relationship can be observed through wald test (chi square statistics) on a group of related coefficients. Based on Table 5, it is proven that only variable of COP is the short term Granger cause for FBMES. This means, the Islamic share market return in short term is only influenced by growth of oil price but not exchange rate. The pattern of this short term Granger causal relationship can be summarised as in figure 1. As shown in Figure 2, the IRF results show that Islamic stock returns responded significantly and positively to oil prices for the first 4 months, and then responded negatively after 4 months, lasting for approximately 24 months. This result confirmed the co-movement between the variables and is consistent with the granger causality results. The result has an important implication in the significant relationship, particularly to the impact of oil prices on Islamic stock returns which indicated the exposure of the Islamic stock market to external macroeconomic variables in Malaysia.Furthermore,the IRF results also show that Islamic stock returns respond negatively to exchange rate for the first 5 months and after that responded positively but not significant lasting for approximately 24 months. This finding is in line with cointegration and Granger causality tests.
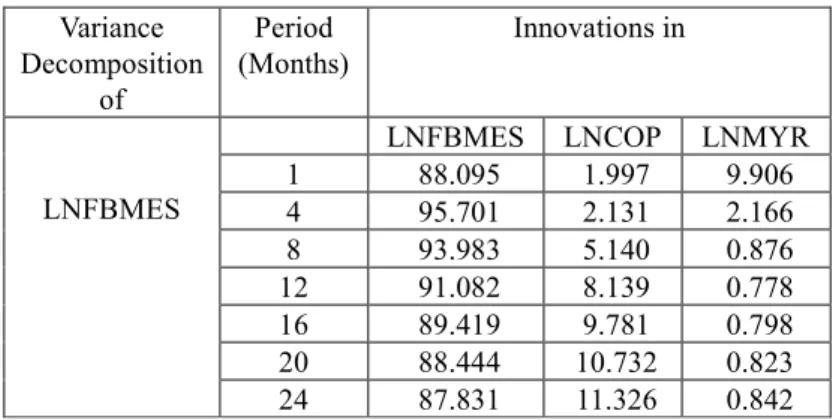
Results of the VDC analysis are presented in Table 6. Similar to IRF, the results are reported for a 24-month horizon. The ordering of the variables for VDC in this study is based on the Cholesky decomposition method which suggests the following order of the variables: LNMYR, LNCOP, and LNFBMES.
According to Table 6, in the case of Islamic stock return, 12.17 percent of the variations are contributed by other variables. Among all the variations, crude oil price is the most significant variable, explaining about 11.32 percent of the Islamic stock return forecast error variance. This result is consistent with that of Granger causality tests. Interestingly, only 0.84 percent of the variations in Islamic stock return are explained by exchange rate. This finding suggests that exchange rate variable not affecting changes in Islamic stock return in Malaysia.
7. Conclusions
The main objective of this study is to investigate the relationship between oil price, exchange rate and the Islamic stock market in Malaysia. From the analysis above, it can be concluded that the Islamic share prices (FBMES) share a positive and significant relationship with the crude oil price (COP) but has a negative and not significant relationship with foreign exchange rate (MYR). Meanwhile, in the short run, only oil price variable Granger cause for Islamic stock returns. This finding proves that only oil price is valid variable for the purpose of predicting changes in Islamic share prices in Malaysia. Therefore, exchange rate variable does not affect Islamic stock return in the short and long run in Malaysia.
References
Journal of Accounting, Finance and Banking Research , 3(3), 28-47.
Aggarwal, R., (1981), “Exchange Rates And Stock Prices: A Study Of The United States Capital Markets Under Floating Exchange Rates”, Akron Business and Economic Review 12 (Fall), 7-12.
Ajayi, R. A. & Mougoue, M. (1996), “On The Dynamic Relation Between Stock Prices and Exchange Rates”,
Journal of Financial Research19(2), 193-207.
Arouri, M. E & Julien, F (2009), “On the Short-Term Influence of Oil Price Changes on Stock Markets in GCC Countries: Linear and Nonlinear Analyses”, Economics Bulletin29(2), 795-804.
Aurangzeb & Asif (2012), “Effect of Time on Interest Rate, Exchange Rate and Stock Prices”, International Research Journal of Finance and Economics, 86, 63-70.
Bacha, O. I. (2002), “New Issues in Islamic Capital Market Development: Risk Management and Islamic Capital Markets”, Islamic Capital Markets Conference, Securities Commission, March 2002, Kuala Lumpur, Malaysia. Burbridge, J. & A. Harrison, (1984), “Testing for the Effects of Oil-Price Rises Using Vector Autoregressions”,
International Economic Review25, 459-484.
Cheung, Y. W. & Lai, K. (1993), “A Fractional Cointegration Analysis of Purchasing Power Parity”, Journal of Business & Economic Statistics11, 103-112.
Doong, Shuh-Chyi, Yang, Sheng-Yung and Wang, Alan T., (2005), “The Dynamic Relationship and Pricing of Stocks and Exchange Rates: Empirical Evidence from Asian Emerging Markets”, Journal of American Academy of Business, Cambridge 7, (1), pp. 118-123.
Elton, E. J. & M. Gruber. (1991), Modern Portfolio Theory and Investment Analysis, Fourth Edition, New York: John Wiley & Sons.
Gisser, M. & T. H. Goodwin (1986), “Crude Oil and the Macroeconomy: Tests of Some Popular Notions”,
Journal of Money Credit and Banking18, 95-103.
Gogineni, S. (2007), “The Stock Market Reaction to Oil Price Changes”, Working Paper, University of Oklahoma.
Hamilton J. D. (1983), “Oil and the Macroeconomy since World War II”, Journal of Political Economy 92, 228-248.
Ibrahim, M. H. & Aziz, H. (2003), “Macroeconomic Variables and the Malaysian Equity Market: A View through Rolling Subsamples”, Journal of Economic Studies30(1), 6-27.
Ibrahim, M. & Wan, S. W. Y (2001), “Macroeconomic Variables, Exchange Rate and Stock Price: A Malaysian Perspective”, IIUM Journal of Economics and Management 9(2), 141-163.
Ito, T & Yuko, H. ( 2004), "Microstructure of the Yen/Dollar Foreign Exchange Market: Patterns of Intra-day Activity Revealed in the Electronic Broking System," NBER Working Papers 10856, National Bureau of Economic Research, Inc.
Johansen, S. (1988), “Statistical Analysis of Cointegration Vectors”, Journal of Economic Dynamic Control12, 231-254.
Johansen, S. & K. Juselius (1990), “Maximum Likelihood Estimation and Inferences on Cointegration with Application to the Demand for Money”, Oxford Bulletin of Economics and Statistics52, 169-210.
Kassim, S. H. (2010), “Financial Crisis and Integration of Islamic Stock Markets in Developed and Developing Countries”, VRF Working Paper, Institute of Developing Economies-Japan External Trade Organization (IDE-JETRO)
Khalid, A. M. & Kawai, M. (2003). “Was Financial Market Contagion The Source Of Economic Crisis in Asia? Evidence Using A Multivariate VAR Model”. Journal of Asian economics14(1), 131-156.
Kilian, J & Park, C (2009), “The Impact of Oil Price Shocks on The U.S. Stock Market”, International Economic Review, 50(4), 1267-1287.
Kim, K., (2003), “Dollar Exchange Rate and Stock Price: Evidence from Multivariate Cointegration and Error Correction Model”, Review of Financial Economics 12, 301-313.
Lin, C. C., Fang, C. R. & Cheng, H. P. (2010), “Relationships between Oil Price Shocks and Stock Market: An Empirical Analysis from the Greater China”, China Economic Journal3(3), 241-254.
Madura, J. (2008). International Financial Management (9th ed.). Ohio: Cengage Learning.
Miller, J. I. & Ratti, R. A. (2009), “Crude Oil and Stock Markets: Stability, Instability and Bubbles”, Energy Economics 31(4), 559-568.
Mohd Hussin, M. Y and Borhan, J. T, (2009). “Analisis Perkembangan Pasaran Saham Islam di Malaysia”.
Jurnal Syariah, Vol. 17 No. 3, pp. 431-456.
Mohd Hussin, M. Y. & Muhammad, F. (2011), “Analisis Perkembangan Bursa Malaysia dan Pasaran Saham Islam di Malaysia”, Jurnal Teknologi56, 65-80.
Nandha, M. & Faff, R. (2008), “Does Oil Move Equity Prices? A Global View”, Energy Economics30(3), 986-997.
Narayan, P.K. & Narayan, S. (2010), “Modelling the impact of oil prices on Vietnam’s Stock Prices”, Applied Energy87, 356-361.
Nieh, Chien-Chung & Lee, Cheng-Few, (2001), “Dynamic Relationship Between Stock Prices and Exchange Rates for G-7 Countries”, The Quarterly Review of Economics and Finance 41, pp. 477–490.
O’ Neil, T. J., J. Penm & R. D. Terrell (2008), “The Role Higher Oil Prices: A Case of Major Developed Countries”, Research in Finance 24, 287-299.
Ozair, Amber, (2006), “Causality Between Stock prices and Exchange Rates: A Case of The United States”, Florida Atlantic University, Master of Science Thesis.
Papapetrou, E. (2001), “Oil Price Shocks, Stock Market, Economic Activity and Employment in Greece,”
Energy Economics 23, 511-532.
Park, J. & Ratti, R. A. (2008), “Oil Price Shock Markets in the U.S. and 13 European Countries,” Energy Economics30, 2587-2608.
Sadorsky, P. (1999), “Oil Price Shocks and Stock Market Activity”, Energy Economics21, 449-469.
Sadorsky, P. (2001), “Risk Factors in Stock Returns of Canadian Oil and Gas Companies,” Energy Economics
23, 17-28.
Sevuktekin, M. and Nargelecekenler, M. (2007), “Turkiye'de IMKB ve Doviz Kuru Arasındaki Dinamik Đlişkinin Belirlenmesi”, 8. Turkiye Ekonometri ve Istatistik Kongresi, Inonu Universitesi, Malatya.
Smyth, R. and Nandha, M., (2003), “Bivariate Causality between Exchange Rates and Stock Prices in South Asia”, Applied Economics Letters 10, 699–704.
Sohail, N. & Hussain, Z. (2009), “Long-Run and Short-Run Relationship between Macroeconomic Variables and Stock Prices in Pakistan: The Case of Lahore Stock Exchange”, Pakistan Economic and Social Review, 47(2), 183-198.
Tsoukalas, Dimitrios, 2003. “Macroecomoic Factors And Stock Prices In The Emerging Cypriot Equity Market”,
Managerial Finance 29(4), pp. 87-92.
Yurtsever, C. & T. Zahor (2007), “Oil Price Shocks and Stock Market in the Netherlands”, Working Paper, University of Groningen.
Table.1. Definitions and Transformation of Variables
No Variable Description Duration Time Series Data Transformation Variable Source
1 FBMES FBMES used as the proxy for Islamic stock market in Malaysia Monthly data (January 2007 to December 2011) ( ) ( ) = ∆ −1 t t FBMES FBMES Log LNFBMES Bloomberg
2 COP COP used as the proxy for world crude oil price.
Monthly data (January 2007 to December 2011) ( ) ( ) = ∆ −1 t t COP COP Log LNCOP Monthly Statistical Bulletin, Bank Negara Malaysia 3 MYR Foreign exchange
rates of Ringgit Malaysia - United States Dollar (MYR) used as the benchmark for foriegn exchange rate in Malaysia. Monthly data (January 2007 to December 2011) ( ) ( ) = ∆ −1 t t MYR MYR Log
LNMYR Monthly Statistical
Bulletin, Bank Negara Malaysia
Table 2. Unit Root Test-Summary Statistics
Variables Level First Difference
ADF PP ADF PP
LNFBMES -1.591 (1) -1.636 (4) -5.500 (0)* -5.551 (3)* LNCOP -2.501 (1) -2.096 (3) -4.827(0)* -4.819 (3)* LNMYR -1.689 (0) -1.725 (3) -7.454 (0)* -7.452 (2)* * Denote significance at 1% respectively
Table 3. Johansen-Juselius Cointegration Test Model Null Hypothesis Statistical Trace Critical Value (5%) Maximum Eigen Statistical Trace Critical Value (5%) Variable Long-term Coefficient Elasticity Results Lag Length =2# r ≤ 0 31.566* 29.797 20.124 21.131 LNFBMES 1.00000 Statistical Trace showed a one cointegration vectors r ≤ 1 11.441 15.494 8.937 14.264 LNCOP -0.622 r ≤ 2 2.504 3.841 2.504 3.841 LNMYR 0.897 C -6.632
* :Denote significance at 5% respectively, Critical Value obtained from Osterwald-Lenum (1992) #: lag length based on AIC
Table 4. Cointegration Relationship Dependent variable (LNFBMES) Independent Variables LNCOP LNMYR C Coefficient 0.622* -0.897 6.632 t Value 4.941 -1.777
Note: * Significance at a degree of freedom 1 percent.
Table 5. Vector Error Correction Model (VECM) Dependent
Variables
Independent Variables Chi-Square (Wald Test)
T-Statistic
∆LNFBMES ∆LNCOP ∆LNMYR Ect-1 ∆LNFBMES 7.189** (0.027) 1.856 (0.395) -0.185* [-2.732] ∆LNCOP 2.493 (0.287) 1.815 (0.403) 0.342* [2.375] ∆LNMYR 1.401 (0.496) 4.629*** (0.089) -0.109* [-4.035] *, ** and ***: Denote significance at 1%, 5% and 10% respectively ( ) probability, [ ] t value LNFBMES LNMYR LNCOP Indicator: uni-directional causality bi-directional causality
Figure 1. Analysis on Short Term Granger Causal Relationship
Table 6. Results of Variance Decompositions Analysis Variance Decomposition of Period (Months) Innovations in LNFBMES
LNFBMES LNCOP LNMYR 1 88.095 1.997 9.906 4 95.701 2.131 2.166 8 93.983 5.140 0.876 12 91.082 8.139 0.778 16 89.419 9.781 0.798 20 88.444 10.732 0.823 24 87.831 11.326 0.842 -.04 -.02 .00 .02 .04 .06 .08 .10 2 4 6 8 10 12 14 16 18 20 22 24
Response of LNFBMES to LNFBMES
-.04 -.02 .00 .02 .04 .06 .08 .10 2 4 6 8 10 12 14 16 18 20 22 24
Response of LNFBMES to LNCOP
-.04 -.02 .00 .02 .04 .06 .08 .10 2 4 6 8 10 12 14 16 18 20 22 24
Response of LNFBMES to LNMYR
Response to Cholesky One S.D. Innovations