Tanya Mark, Rakesh Niraj, Niraj Dawar Using Customer Relationship Trajectories to Segment Customers and Predict Profitability RM/07/014
Maastricht research school of Economics of TEchnology and ORganizations Universiteit Maastricht
Faculty of Economics and Business Administration P.O. Box 616
Using Customer Relationship Trajectories to Segment Customers and Predict Profitability
By: Tanya Mark Rakesh Niraj Niraj Dawar
Tanya Mark is a doctoral candidate in Marketing and Niraj Dawar is the Barford Professor in Marketing Communications, both at Richard Ivey School of Management, University of Western Ontario, London, Ontario, Canada. Rakesh Niraj is an Assistant Professor of Marketing at USC Marshall School of Business, Los Angeles, CA. Please direct comments or other correspondence to Rakesh Niraj at 213-740-9844 or by email at [email protected]; or to Tanya Mark by email at [email protected]
Using Customer Relationship Trajectories to Segment Customers and Predict Profitability
Abstract
A central premise of relationship marketing theory is that economic benefits flow from retaining customers. However, the early research focus on the duration of the relationship may obscure other important aspects of the interactions with the customer that drive profitability. Borrowing from the branding literature, where different types of customer relationships have been described (but not empirically examined), we study the patterns of business customers’ buying behavior, or trajectories that characterize customer-firm relationships over time, and their impact on profitability. We develop a finite mixture model relating customer relationship trajectories to profitability over a three year period. Our analysis yields five segments, or types of customer-firm relationships, for this dataset. We find key determinants of profitability vary across types of customer relationship. Interestingly, in none of these segments does duration predict profitability.
Introduction
Long-term customers are said to be more profitable than short term ones for a number of reasons. Long-term customers may be more willing to pay premium prices to avoid the costs and risks of switching, and ensure continuity of supply; they may also buy more and be less costly to serve; and they are more likely to accept new products through cross-selling. Not surprisingly, firms are exhorted to establish long term relationships with their customers in the conviction that such relationships yield a positive return when they endure (Morgan and Hunt 1994; Sheth and Parvatiyar 1995; Bendapudi and Berry 1997). For example, it has been suggested that avoiding customer defections, and thereby increasing the average customer lifetime, contributes substantially to the bottom line (Reichheld and Sasser 1990). Yet recent research suggests that a more nuanced perspective on the effects of customer lifetime on
profitability may be called for (Reinartz and Kumar 2000; Dowling 2002). Reinartz and Kumar (2000) show, for example, that in a non-contractual setting, profitable segments are to be found among both short- and long-term customers. Importantly, they also show that customer
profitability does not increase monotonically over customer lifetime. Although the correlation between customer lifetime and profitability was found to be significant, it was weak, suggesting that other determinants might also account for profitable relationships. Similarly, Dowling (2002) makes a strong conceptual argument questioning the link between customer relationships and profitability. He argues that relationships are costly and time consuming for both firms and customers, and that many customers have neither the time nor desire to engage in relationships with every company from which they buy.
This recent line of inquiry and argument suggests that the early research focus on the duration of the relationship with the customer may obscure other important aspects of the
relationship that drive profitability. Types of relationship between firms and their customers have been described, but not empirically examined in the marketing literature. Fournier (1998), for example, proposes and labels six different forms of trajectory, based on different patterns of transactions. She describes one of the relationship types as a short-term engagement with high involvement, but lacking commitment and feelings of reciprocity. Adopting terminology from interpersonal relationship theory, she labels this type of relationship a passing fling. Profitability may well be better explained as a function of buying behavior that is characteristic of different types of relationships, such as the amount purchased on each purchase occasion, the time interval between purchases, the number of purchases over a period of time, the breadth of purchases, and even the proportion of goods returned. To date, there has been no rigorous empirical research that examines the effects of relationship trajectories on managerially important dependent variables such as profitability (Dowling 2002).
We classify customers into different relationship trajectories on the basis of the characteristics of their buying behavior through a semi-parametric group-based modeling approach (Wedel and Kamakura 1998). Our results suggest that the customer base that we examine can be grouped into five segments. These five segments, or relationship types, are distinguished by their buying behavior and their relative profitability to the firm. For example, one of the five segments consists of customers that are characterized as variety seekers because of their cross-buying behavior while another segment is better described by a large number of orders and a correspondingly large number of returns. Despite these behavioral differences, both segments are highly profitable to the firm. Our findings provide insight into the importance of understanding a portfolio of different customer-firm relationship types and their relative profitability to the firm. In addition, this research provides managers with a method to allocate
resources across customer segments that are identifiable by using readily available transactional data.
The remainder of this paper is organized as follows. In the next section we review relevant literature on relationship marketing and customer equity, and develop testable research propositions. The following section lays out our research methodology. Besides providing a description of the research site and our unique dataset, this section also presents our methods of analysis, namely customer profitability analysis based on Activity Based Costing (ABC) and latent class modeling to identify and analyze segment-wise profitability trajectories. This section is followed by the section on empirical results. In the final section we conclude with a
discussion of findings, implications and limitations of this research, and areas of further investigation.
Relationships: Length or Pattern of Buying Characteristics?
Relationship marketing theory has had a profound effect on various streams of research in marketing including inter-organizational buyer-seller relationships (Anderson and Narus 1990), customer satisfaction (Garbarino and Johnson 1999; Oliver 1999), the marketing of services (Berry 1995; Zeithaml, Berry et al. 1996), retailing (De Wulf, Odekerken-Schroder et al. 2001), and more recently on customer equity and customer lifetime value studies (Reinartz and Kumar 2000; Hogan, Lemon et al. 2002). Relationship marketing refers to “all marketing activities directed toward establishing, developing, and maintaining successful relational exchanges” (Morgan and Hunt 1994). A central premise of the theory is that economic benefits flow from retaining customers. Reichheld and Sasser (1990) suggested, for example, that a reduction in customer defections of 5 percent could increase profits between 25 and 85 percent.
The increase in profits is a result of reduced acquisition costs and an increase in revenues from committed and loyal customers.
Recent research, however, suggests that short-term customers can also be valuable to organizations (Reinartz and Kumar 2000). Some short-term customers, for example, may spend more per transaction and demand less interaction with employees than long-term customers. Exchanges characterized by large revenues and low service costs, regardless of the duration of the relationship, contribute significantly to a company’s profitability. Reinartz and Kumar reported a weak correlation (r = 0.2) between lifetime duration and profitability in a typical non-contractual setting, suggesting that other determinants might contribute to a fuller explanation of profitable relationships. This finding is certainly interesting when seen in light of the emphasis on relationship duration. But it also perpetuates the duration debate, without delving into other aspects of the transaction that could explain profitability.
Several scholars acknowledge the existence of different types of customer-firm
relationships (Dwyer, Schurr et al. 1987; Bendapudi and Berry 1997; Fournier 1998; Zeithaml, Rust et al. 2001). Fournier (1998) developed a characterization of brand-consumer relationships based, in part, on the pattern of their buying characteristics. See figure 1 for an illustration of the trajectories adapted from Fournier (1998). A comparison of these trajectories illustrates the existence of markedly different relationship patterns than the prototypical monotonic long-term relationship. Fournier suggests that “Variability in the temporal patterning of brand relationship development cycles suggests value in identifying factors that encourage strength across
relationship forms.” (pg. 363).
Johnson and Selnes (2004) adopt a similar typology of customer-firm relationships to argue that customers should be viewed as a portfolio in which different types of customers play different roles. In a later article, they describe customer portfolio management as “a process of creating value across a company’s customer relationships – from arm’s-length transactions to strategic partnerships – with an emphasis on balancing closer customer relationships with weaker ones” (Johnson and Selnes 2005). Their typology consists of three types of customers which they refer to as acquaintances, friends, and partners. The authors emphasize the importance of acquiring a diverse set of customers for two reasons: first, in industries with economies of scale, even customers that have a negative value in the current period may contribute by absorbing excess capacity or overhead costs; and second, a portion of these customers will become profitable, loyal customers over time.
Reichheld (1996) argues for recognizing heterogeneity in a firm’s customer base. He emphasizes the benefits of retaining customers belonging to segments of loyal customers since they are highly profitable to the firm. In their conceptualization of customer relationship management (CRM), Reinartz, Krafft, and Hoyer (2004) further emphasize the importance of recognizing different types of customer-firm relationships. For successful CRM initiatives, they argue, it is imperative to first recognize customers’ relationship preferences and second to build the “right” type of relationship with the customer. To date, no empirical research has examined the moderating effects of these types of customer segments on profitability (Bolton 1998; Bolton and Lemon 1999; Zeithaml 2000). Given the importance of different types of relationship between firms and customers, there is a need to move beyond the existing typologies of exchange that focus on the longevity of relationships to ones that empirically distinguishe
customer-firm relationships by the pattern of interactions between the customer and firm over time.
Grouping Customers by Relationship Trajectory
Despite theoretical support for and reference by scholars to different types of customer-firm relationships, little empirical research has explicitly investigated the nature of such
relationships, and their impact on marketing related dependent variables. Given the speculation in the literature about the impact of the pattern of relationship trajectories on profitability, we propose to examine whether customers with differing patterns of relationships with the firm are also differentially profitable. We define relationship trajectory as the set of encounters that occurs between customers and firms over time, including purchases, returns, and marketing communications. For this research, customer buying behavior over time describes the patterns of the trajectories. Furthermore, we refer to groups of customers, or segments, as distinct
relationship types characterized by their relationship trajectory. As a first step, we propose to group customers based on their relationship trajectory with the firm over time.
Proposition 1: Customers can be classified into distinct groups on the basis of their relationship
trajectory with the firm over time.
Relationship Trajectories and Profitability
Various measures of the economic value of customers have been proposed in the literature. Profitability and Lifetime Value are two such measures. The first looks primarily at the profits derived from a given customer or group of customers within a well defined time
period, generally an accounting period such as a year or a quarter. Lifetime Value, on the other hand, examines the expected total value of a customer over the life of the customer’s relationship with the firm. Here, the emphasis is on predicting which customers are likely to yield greatest returns over the entire duration of the relationship. For a review of Lifetime Value models, refer to Mulhern (1999). Venkatesan and Kumar (2004) compare various metrics of customer lifetime value and customer profitability to determine how well each metric identifies most profitable customers. Their findings suggest that customer profitability, as we define it, produces similar results to their forward looking customer lifetime value metric. In addition, they found these two metrics to be superior to other metrics such as the popular recency, frequency, and monetary value (RFM) analysis often employed by practitioners to prioritize customers.
Reinartz and Kumar (2003) estimate one set of regression parameters across all
observations to predict the effect of buying characteristics on profitable lifetime duration. One possibility is that their parameter estimates of profitable lifetime duration may be biased if the customers are a heterogeneous group with different relationship trajectories and for whom the coefficients differ. Building on Reinartz and Kumar’s (2003) research and incorporating diversity of relationship trajectories, we expect to improve predictions of profitability by using customer-firm relationship types as a moderator.
Existing research typically computes customer-level profitability by multiplying the total purchase amount for each customer by a fixed factor to account for cost of goods sold. This assumes a constant margin across all products and all customers. A more rigorous approach to calculating customer profitability allocates costs to each customer on the basis of their actual usage of activities that generate those costs. One such method is Activity Based Costing (Niraj,
Gupta and Narasimhan 2001). We employ this more refined method for assessing the costs associated with each purchase for each customer.
Proposition 2: Customer groups with different relationship trajectories display distinct patterns
of profitability over time.
Buying Characteristics and Profitable Customer Groups
Duration has been the focus of much past research because of its role as a proxy for buying characteristics such as cross-buying, cost to serve, and so on. Longer term customers are said to buy a wider range of products, and may be less costly to serve. But if it is indeed merely a proxy for these behavioral characteristics, then if direct measures of these variables are
available, the proxy should become redundant. Recent research has begun to focus on understanding the antecedents of customer-level profitability. Reinartz and Kumar (2003) investigate the economic value of customers by examining the determinants of customer lifetime duration. In a non-contractual setting, they find that over 65% of the variance in profitable lifetime duration of customers can be explained by basic buying characteristics such as number of products purchased across and within departments, length of relationships, and dollar amount of purchases. These antecedents are common metrics used in the direct marketing literature for predicting customer’s responses to marketing efforts (Allenby, Leone, and Lichung 1999), for developing an optimal resource allocation strategy (Venkatesan and Kumar 2004), and in conceptual frameworks of customer asset management (Bolton, Lemon, and Veroef 2004). We illustrate how these direct measures may be used to predict profitable customer groups. The
following paragraphs explain our twounique propositions for buying characteristics on
profitable customer groups. See table 1 for a summary of all the variables included in our model. A potentially important aspect of profitable relationships is cross-buying behavior, or breadth of purchases. This buying characteristic, defined as the number of product categories in which customer makes purchases, is a measure of the depth of relationship between customers and firms. Research has demonstrated a positive relationship between cross buying behavior and profitable lifetime duration (Reinartz and Kumar, 2003) and purchase frequency (Venkatesan and Kumar, 2004). Thus, we expect to find a positive relationship between cross buying behavior and customer profitability for each of the relationship trajectories.
Proposition 3: Cross-buying behavior will have a positive effect on customer profitability.
Customers who return large numbers of products signal their dissatisfaction with the firm. Reinartz and Kumar (2003) argue that customers who are dissatisfied with a firm should have shorter relationships with the firm. Their empirical results, however, suggest a positive relationship between the proportion of returns and profitable duration. In a direct marketing context, this finding emphasizes the importance of a good return policy since customers who are more comfortable with the seller’s policies buy more products over time. However,
Venkatesan and Kumar (2004) find an inverted U shape best explains the relationship between number of returns and purchase frequency. They argue that a threshold exists between the number of returns and purchase frequency. Customers who return few products signal a healthy relationship with the firm whereas customers who return many products signal a weak
relationship. Building on this stream of research, we expect to find that number of returns will vary across customer groups with different relationship patterns.
Proposition 4: Relationship trajectories will moderate the relationship between number of
returns and customer profitability.
INSERT TABLE 1 ABOUT HERE
Research Methodology
To determine the different types of relationship trajectories over time, we first allocate company wide costs to each customer to determine their profitability using Activity Based Costing. Then, we estimate a finite mixture model to determine the effect of customer buying characteristics on profitability. Finally we analyze the relationships between customer
characteristics within different trajectories and assess support for our research propositions.
Research Site and Data
All transaction data from 4,266 customers of a computer parts distributor were collected for the 4 year period beginning in December 1999 and ending in November 2003. Typical customers for this distributor are system integrators, retailers, government agencies, and Internet retailers. To avoid left-censoring, only observations from customers whose first purchase was made after November 2000 were retained for the analysis. Each observation consists of purchase order specifics such as number of SKUs, product category, unit price, total purchase amount, and date. The corresponding costs for this period include company wide costs relating to purchasing,
warehousing, marketing, customer service, and fulfillment. Unique to this research is the allocation of all marketing costs to determine customer profitability.
Two data cohorts were created for our analysis. The first cohort consists of customers, who first bought during the first quarter (between December, 2000 and February, 2001). The second cohort contains information from customers, who placed their first purchase order during the second quarter (between March, 2001 and May, 2001). The first cohort consists of 248 customers who purchased products worth a mean amount of $280 per transaction, placed a mean of 33 orders, made cross-buys from a mean of 4 different categories, and have a mean observed length of relationship with the firm of 814 days. Similarly, the second cohort consists of 213 customers with a mean purchase amount of $280 per transaction, a mean of 25 orders per customers, products purchased from an average of 4 different categories, and a mean observed length of relationship of 750 days. The first cohort is used to calibrate the model while the second cohort is used to validate the results. See Table 2 for a descriptive summary of the data. Notice that most variables show fairly large variance, indicating that the customer base is diverse and that we may find different segments within the cohorts.
PLACE TABLE 2 HERE.
Customer Profitability Analysis
The first step is to build detailed customer profitability models over multiple periods. Consistent with prior literature in customer profitability models (Niraj et al. 2001) and our own hypothesis of relationship between profitability and buying characteristics, we assess customer profitability by allocating costs using Activity Based Costing (ABC) methodology. The goal is to
build an accurate picture of profitability at the customer level rather than at the product or category level. In its essence, the ABC approach allocates costs of activities related to serving a customer back to the customer. An attempt is made to trace most costs incurred by the firm and most activities undertaken by the firm, with the possible exceptions of costs associated with excess capacities, inefficiencies, and activities truly associated with long term product- or customer-base-development, to individual customers. The traditional accounting treatment of most of these costs (Sales and General Administrative costs) is to allocate them on the basis of revenue. This approach, also common to prior relationship marketing literature, ignores heterogeneity in customer service costs and may obscure the role of buying characteristics in customer profitability. Since typical accounting systems do not provide enough detail and tend to lump together costs that are driven by different activities, our ABC exercise involved looking at the firm’s internal documents, a study of the firm’s operations, and discussion with managers about cost budgets for individual activities.
Initially, the approach consists of dividing periodic costs incurred by the firm into cost pools. Appropriate cost drivers are identified based on a detailed study of actual operations of the firm. These drivers are then used to derive cost rates for individual activities, including those seemingly far removed from a customer contact point, such as maintaining relationships with new vendors or placing orders for maintaining inventories. Finally, these costs are allocated to individual customers based on the nature and extent of activities the firm undertakes on behalf of the customer. In this step, we built a detailed ABC model that identified suitable cost pools and cost drivers based on our study of the operations of the firm, and then computed customer profitability for individual customers for each of the twelve quarters between December 2000 and November 2003.
On the revenue side our model identified the actual price paid by each customer, net of effective discounts sometimes given especially to bigger customers, and netted out the cost of goods sold through careful matching of the inventory records. Thus besides total revenue,
customer gross profits could vary because of the mix of items bought – some items are inherently high margin while others are low-margin. It could also vary because different customers were given different effective prices for the same item. For example, a large customer may be given a greater volume discount, and result in an effectively lower price and gross margin. On the cost side, our ABC model identified and tracked costs associated with identifying vendors, placing orders, maintaining stocks of different items including capital and space cost of warehousing, slow-moving items, cost of customizing some aspect of the product, processing customer orders, marketing costs (such as costs of mailing promotional flyers etc.) besides inbound and outbound shipping and physical handling costs.
Some of these costs could be directly traced to activities with customers, for example order processing cost allocated to different customers would be directly proportional to number of orders placed by the customers. Thus a customer who buys one hundred units of an item in one order will be allocated a lower cost of order processing than a customer who buys the same hundred units spread over ten orders. Similarly, if different types of customers were sent more or less promotional flyers, then the costs would also be allocated directly in proportion to the costs incurred. However, warehousing costs and other inbound logistics costs may first need to be traced to individual items and then allocated to customers based on the number of units of different items they actually buy. Thus a customer who buys a unique item purchased only by that customer is allocated a higher share of costs compared to customers who buy more generic
items purchased by many other customers. See Table 3 for a summary of customer profitability analysis using Activity Based Costing.
PLACE TABLE 3 HERE.
Finite Mixture Regression Model and Estimation
The second step of our analysis consists of regressing customer profitability on purchasing and customer characteristics. Because we are interested in modeling patterns of transactions over time across different types of customer-firm relationships, we develop a finite mixture regression model. The objective is to obtain a probabilistic classification of units of analysis (customers, in our case) into segments of unknown proportions based on a sample of observations, while simultaneously estimating a linear regression model for each segment (Wedel and Kamakura 2002, Ch. 7). Finite mixture regression models are also referred to as latent class regression models because the number of segments is unknowna priori. Latent class
modeling has been widely adopted in marketing for customer choice modeling (Kamakura and Russell 1989), direct marketing applications (Wedel, DeSarbo et. al 1993), and pricing strategies (Lewis 2005). This method has been applied in criminology to model the determinants of criminal career development (Roeder, Lynch et al. 1999). The principal advantage of this method over other segmentation methods is that no assumption is made regarding the underlying distributions. In addition, the method allowspost-hoc classification of customers into segments
which allows us to study buying characteristics that unite customers into a segment. While the model is general, since we are interested in estimating separate linear
we briefly describe the specific model below (Wedel and Kamakura 2002, Ch. 7). Let the entire data be a mixture ofS segments in proportions 1… S. AssumingP predictors, within each
segments, we specify a linear regression with segment-specificP-dimensional parameter vector
θs. Thus the linear regression equation can be written as
1 , P it it s p y X θ = =
∑
where yitis the profitability of customeri in quartert, which is assumed to be a linear function of
the vector ofP predictors given asXitand segment specific parameter vectorθs. Notice that the
parameter vectors (θs) of the segment-wise regressions and the segment proportions ( 1… S) are
unknown to be estimated using sample information. The finite mixture regression model estimates all the segment-wise regression parameters and the segment proportions jointly conditional on the total number of segments,S. This model is similar to a random-effects model
such that the random effects (or mixed regression) term addresses dependence of error terms across observations for each customer.
We use theLatent GOLD computer program to estimate the finite mixture regression
model. This software package uses an Expectation-Maximization algorithm to maximize the relevant likelihood function with respect to all the unknown parameters. To minimize the problem of convergence to a local optimum instead of a global maximum, we perform the estimation procedure using ten randomized starting values (Wedel and DeSarbo 2002). As mentioned above, the model is specified for a given number of segments, therefore the
estimation can proceed assuming different values ofS. It is standard practice to first estimate the
model assumingS=1,2,3,… and later to determine the number of segments on a criterion such as
statistic because it penalizes in proportion to the number of parameters estimated and sample size (Wedel and DeSarbo 1994). Once the total number of segments is determined, the posterior probability of customeri belonging to classs can be obtained using Bayes rule.
Results Significance of Relationship Trajectories
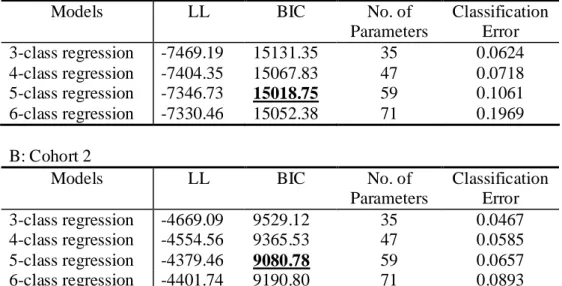
Our proposition 1 states that customers could be meaningfully assigned to segments, or relationship types, based on their buying behavior. As predicted, customers can be differentiated by the variability in their buying patterns over time. For our dataset, a five segment model best fit the data and provides the most parsimonious model according to the smallest Bayesian Information Criterion (BIC) of all estimated models. See Table 4 for log-likelihood and BIC values for each model. We find a five segment model increases R2 from 0.49 for the 1 class model to 0.68. Using the second cohort as a holdout sample, we confirm that the five segment model best fits the data for this company. Thus, we find five distinct relationship types in the firm’s customer base.
PLACE TABLE 4 HERE.
Our second proposition suggested that groups of customers, segmented on the basis of their buying behavior, would differ in their profitability pattern over time. To explain the different relationship trajectories and predict their impact on profitability, we performed a finite mixture regression model. We find each relationship type is characterized by a different set of
regression parameters describing their buying behavior over time, and each relationship type has a different pattern of profitability. See Table 4 for the regression parameters of the five segment
model. In the first relationship type, the number of orders and cross-buying behavior emerge as the most important determinants of customer profitability (significant at p<0.05). For this relationship type, time has a negative effect on profitability, the effect diminishes over time as time-squared has a positive effect on profitability (significant at p<0.05). Purchase amount has a marginal effect of 0.39 on profitability (significant at p<0.05). The remaining predictors have no effect on profitability. The second relationship type consists of customers who place a large number of orders ( =57.99, p<0.05), as demonstrated by the high beta coefficient for this predictor. In this relationship type, the number of returns is also a significant predictor of
profitability ( =-18.57, p<0.05). Similar to the first type of relationship, purchase amount has an effect on profitability ( =16.42, p<0.05). The third relationship type is characterized by the negative effect of the number of orders ( =-21.18, p<0.05) on profitability. Though time has a negative effect on profitability ( =-2.22, p<0.05), time squared coefficient is positive,
diminishing the effect of time on profitability ( =2.9, p<0.05). For this relationship type, only purchase amount has a positive significant effect on profitability ( =7.02, p<0.05). In the fourth relationship type, the number of orders is a significant predictor of customer profitability
=30.93, p<0.05), as well as purchase amount ( =2.01, p<0.05). In addition, the fourth relationship type also includes a positive effect of number of returns on customer profitability
=21.86, p<0.05). The final relationship type is characterized by cross buying as an important predictor of customer profitability ( =57.03, p<0.05). For this fifth relationship type, number of returns ( =-33.78, p<0.05) and average inter purchase time ( =-10.59, p<0.05) have a negative effect on customer profitability. Finally, purchase amount has a significant positive effect on customer profitability for segment 5 ( =0.92, p<0.05). Interestingly, in none of the five relationship types is the relationship between duration of customer-firm relationships and
customer profitability significant. In addition, there is no relationship between focus buy, measured as a binary variable to identify customers that purchased products from a single category over the observation period, representing the extent to which the customer comes back just for a specific need, and customer profitability for any of the five segments.
PLACE TABLE 5 HERE.
For insight into the different patterns of profitability over time, we graphed average profitability over time for each relationship type1. See Figures 2-6. Because of the accounting practices employed by the company and our use of Activity Base Costing to determine each customer’s profitability, the graphs depict downward trends at the end of each fiscal year (e.g., quarters 4, 8, and 12). Beyond these downward trends, each trajectory has a markedly different pattern. The first relationship type’s trajectory is characterized mostly by a decreasing pattern, other than a brief upward trend in the final quarter of the observation period. This group of customers has an average profitability of -$27. For relationship type two, the pattern of the trajectory is relatively flat for the entire observation period, fluctuating around its mean
profitability of $160. Relationship type 3 has a trajectory with an upward trend over time. This relationship type begins with an average profitability of $37, but by the 9th quarter, the average profitability increases to $158. Both relationship type 4 and 5 are highly profitable to the firm over time, but have distinct trajectories. Relationship type 4 has a growth-decline plateau pattern whereas relationship type 5 has a pattern best characterized as cyclical resurgence. Relationship type 5’s pattern begins with a steep increasing trend, but decreases for four consecutive periods
1 Though the average change in profitability for each relationship type may not reflect the shape of individual
only to resurge with another steep increasing trend. In addition, relationship type 4 has mean profitability of $512 compared with relationship type 5’s $729. These graphs depict the varied patterns in profitability over time for each of the five relationship types. The results of the finite mixture regression model and these graphs provide support for our second proposition that customer groups with different relationship trajectories have different levels of profitability.
PLACE FIGURES 2-6 HERE. Impact of Buying Characteristics on Customer Profitability
For our third proposition, we expected to find a positive effect of cross-buying on profitability for each of our segments. For each of the five segments, we indeed find a positive effect of cross-buying on profitability; however, only two of the five coefficients are significant predictors of profitability (relationship type 1 has =4.68, p<0.05; relationship type 5 has
=57.03, p<0.05). In addition, we find variation in the size of the beta coefficients for relationship types 1 and 5. Thus, we find marginal support for proposition 3.
Finally, our fourth proposition predicted both positive and negative relationships between the number of returns and profitability. For this predictor, we indeed find both positive and negative effects of number of returns on profitability. For relationship type 1, number of returns has a negative impact on profitability, though it is not significant. Relationship types 2 and 5 have significant negative coefficients for number of returns (relationship type 2 has =-18.57, p<0.05; relationship type 5 has =-33.78, p<0.05). In contrast, relationship types 3 and 4 have positive coefficients for number of returns and its impact on profitability, though only
relationship type 4 has a significant coefficient (relationship type 4 has =21.86, p<0.05). Therefore, proposition 4 is supported by our results.
Discussion
We adopted a rigorous empirical approach to mapping different types of customer-firm relationship trajectories, examined their patterns of profitability over time, and assessed the impact of buying characteristics on customer profitability. Our first step was to group customers into relationship trajectory types based on buying behavior over a three year period and to visually examine the various patterns of profitability. We proceeded with a finite mixture regression to empirically test the effect of buying behavior on a refined measure of customer profitability. Finally, we evaluated the moderating effect of different relationship trajectories on the relationship between buying behavior and customer profitability.
Our analysis suggests that grouping customers into trajectory types yields interesting insights. We find five different relationship patterns best represent the company’s customer base. Each customer-firm relationship type is characterized by a different set of buying patterns. While some relationship types are distinguished by the value of their purchases, others are best described by their long purchasing cycles. Furthermore, grouping customers by their
relationship type enables firms to assess the impact of different buying patterns on profitability of customers. This finding is tested on the hold-out sample and demonstrates the robustness of the model.
Our results also illustrate the importance of recognizing patterns of buying behavior over time. Earlier research on relationship marketing focused on examining the benefits of building long-term committed relationships with customers. Our results demonstrate that buying characteristics other than duration explain profitable relationships. For example customers
belonging to relationship type two (Flat Liners) do not exhibit an increase in profitability over time. Instead, this group of customers has a profitability pattern over time that remains level over the observation period. These customers are habitual shoppers who buy specific but limited number of items from the company. This relationship trajectory type does not increase in
profitability over time yet it represents 22% of the firm’s total profitability for the three year period. Thus, our results demonstrate the importance of recognizing behavioral patterns over time as predictors of profitable customer-firm relationships. Future research on customer
relationship management should move beyond duration as an indicator of profitable relationships to recognizing patterns of buying behavior that define different groups of customers.
A contribution of this research to the literature on customer profitability is the importance of employing refined measure of individual customer-level profitability. Using Activity Based Costing, we allocate company wide costs to customers based on customers’ actual service costs instead of assuming a constant factor across customers. A refined measure of customer
profitability provides a more rigorous test of the relationship between buying characteristics and customer profitability. By incorporating actual service costs into our measure of profitability, we find that cross-buying has a positive effect on profitability but is only significant for two of the five relationship types. We find relationship type 5 is best characterized by cross-buying
behavior whereas relationship type 1 has a significant coefficient for cross-buying but this group is better characterized by number of orders, regardless of the different categories these customers buy from. Despite the positive association between cross-buying and profitability for
relationship type 1, this trajectory remains the least profitable over the three periods. Therefore, it is desirable for a company to understand which relationship type should be encouraged to buy across departments.
A refined model of customer profitability also helps resolve contradictory findings in the literature regarding the relationship between number of returns and profitability. Our results are partially consistent with those of Reinartz and Kumar (2003) in that one of the five trajectories has a positive association between number of returns and profitability. This result emphasizes the importance of companies having simple return procedures because for some customers this encourages them to buy more and results in more profitable relationships. However, we also find two of the five relationship trajectories have a negative association between number of returns and profitability. One possible explanation is that when actual service costs are
incorporated into individual level profitability, it is correctly recognized as more expensive for a company to serve customers that order few products across categories. When these costs are allocated to customers based on their buying patterns, the burden on a select few of the
relationship types becomes evident. This finding is in line with the satisfaction literature which argues that customer dissatisfaction is related to increasing number of returns.
Finally, we contribute to research on relationship marketing by incorporating customer dynamics and heterogeneity into our model of customer profitability using a finite mixture model. This method enables us to discern different relationship patterns and their relative profitability over a discrete time period. The advantages of this method are twofold. First, no assumption is made regarding the underlying distributions; and second, the method allows us to analytically determine the number of relationship types and simultaneously examine their moderating effects on profitability.
Implications for Research in Relationship Marketing
The objective of this research is to examine boundary conditions for a central premise of relationship marketing theory: economic benefits flow from customer longevity. Long-term,
committed customers were portrayed as more profitable than short-term customers. Grouping customers on the basis of their relationship patterns, and using a more refined measure of profitability, we found duration was not a significant predictor of profitable relationships. Our research suggests that groups of customers, segmented by their buying patterns, are differentially profitable. The most profitable groups of customers exhibited markedly different patterns of behaviors. While one of the relationship types is better characterized by the number of orders placed within a specific time period, another relationship type is better characterized by cross-buying behavior. This finding suggests that early research which focused on duration of
customer-firm relationships may have under estimated the value of some groups of customers – those that are better defined by their pattern of buying over time.
Relatedly, it is worth asking what, if any, are the consequences of allocating resources to build and maintain long-term, committed relationships, or loyal customers, for marketing? Firms will continue to benefit from loyal customers; these customers are committed and willing to pay a premium to buy from the firm. But questions remain. For example, what proportion of customers at any given time can be converted to being loyal customers over time? What is the best approach for firms to maximize their return on marketing expenditures across different customer trajectory types? Should firms prioritize their marketing resources to build and maintain loyal customers or should firms recognize customers’ behavioral preferences and customize service offerings accordingly? In our opinion, a segmented approach is likely to be most effective as customers appear to vary in their relationship preferences, as reflected in their buying patterns. While some customers may be converted to loyal customers, others should be managed with a view to maximizing the value of each interaction. Understanding differences in
customer buying patterns enables marketing managers to make effective and efficient resource allocation decisions.
Limitations and Directions for Future Research
One of the limitations of this study is the use of a historic or current period measure versus a future looking measure to value customers. Although both measures are based on past behavior, the profitability measure adopted for our analysis does not take a probabilistic approach to assessing customer likelihood of remaining with the firm. Instead, our measure takes an in-depth approach to allocating all service costs to each customer, based on actual behavior, with the goal of understanding which customers have been most profitable to the firm. In line with recent research suggesting that CLV and customer profitability measures perform well in predicting the most valuable customers to a firm (Venkatesan and Kumar 2004), we believe that our approach successfully exploits an additional dimension of data to understand firm-customer relationship. In fact to the extent our research adds to the understanding of how customer characteristics link with stable patterns of customer profitability over time they can also prove to be a tool to predict future profitability.
One way to improve our study could be to pair our historical transaction and cost data with corresponding cross-sectional data on attitudinal measures such as customer satisfaction and loyalty. First, attitudinal measures can be used as covariates to improve the prediction of profitable customer-firm relationships. Second, attitudinal measures can be used to corroborate statistical models based on transactional data. Furthermore, these data would provide insight into whether customers’ attitudes toward a brand and/or firm correspond to their actual buying behavior.
An avenue for future research on customer-firm relationships is in developing dynamic models aimed at explaining customers’ migration patterns between relationship types over time. From a customer portfolio management perspective, there is a need to understand the different types of customer-firm relationships, how these relationships evolve, and how they contribute to the overall value of a firm. This may be accomplished by segmenting a firm’s customer base, using profitability as a basis, and assessing the change in segment membership over time. In addition, dynamic models which incorporate life cycle factors and marketing expenditures would contribute to this emerging stream of research (Netzer, Lattin, and Srinivasan 2005; Du and Kamakura, 2006) focusing on such issues.
TABLE 1
Summary of Independent Variables and Propositions
Variable Type of
Variable
Measured as Proposition
Focus buy Time
invariant
- 0 if purchases are from same product category over 3 year period. - 1 if purchases are from
different product categories over 3 year period.
Positive association with customer profitability
Length of relationship
Time invariant
Total number of days beginning with first purchase and ending with last purchase.
Positive association with customer profitability
Returns Time
invariant
Total number of purchases returned
Both positive and negative associations with customer profitability Average interpurchase time Time invariant
Average number of days between purchases for each quarter
Positive association with customer profitability
Cross buy Time
varying
Number of product categories purchased from during a quarter.
Positive association with customer profitability Purchase
amount
Time varying
Average total dollar amount of purchases for each quarter
Positive association with customer profitability Number of
orders
Time varying
Number of orders during each quarter
Positive association with customer profitability
Time Time
varying
A number ranging from 1 to 12 representing each sequential quarter starting from December, 2000 to November, 2003.
TABLE 2
Cohort Descriptives A) Cohort 1 Profile
Item Mean Median Range
Total Number of product categories per customer
4 4 1 to 12
Number of orders placed per customer
33 10 1 to 4,108
Purchase amount per order
$280* $137 $1 to $15,641
Inter-order time 44 days 9 days 0 to 1,094 days
Length of relationship
814 days 922 days 0 to 998 days
* All dollar amounts are in Canadian $. B) Cohort 2 Profile
Item Mean Median Range
Total Number of categories per customer
4 4 1 to 12
Number of orders placed per customer
25 10 1 to 1,730
Purchase amount per order
$280 $138 $1 to $8,605
Inter-order time 44 days 8 days 0 to 1,094 days
Length of relationship
TABLE 3
Customer Profitability Analysis Using Activity Based Costing Total Revenue
Total Costs of Goods Sold Gross Profit
Customer Service Costs Customer Profitability
p= price paid by customer i for product q in period t;
m= demand of number of units of product q from customer i in period t; c = costs of product q to the distributor ordered by customer i in period t; U= all upstream costs of product q purchased by customer i in period t; D= all downstream costs allocated directly to customer i in period t.
x : iqt s S S iqt it p m TR It
∑
∈ = x : iqt s S S iqt it c m CGS It∑
∈ = it it it TR - CGS GP = it it it GP - CSC CP = it iqt it CSC =∑
Ucosts +DcostsTABLE 4 Model Comparisons A: Cohort 1
Models LL BIC No. of
Parameters Classification Error 3-class regression -7469.19 15131.35 35 0.0624 4-class regression -7404.35 15067.83 47 0.0718 5-class regression -7346.73 15018.75 59 0.1061 6-class regression -7330.46 15052.38 71 0.1969 B: Cohort 2
Models LL BIC No. of
Parameters Classification Error 3-class regression -4669.09 9529.12 35 0.0467 4-class regression -4554.56 9365.53 47 0.0585 5-class regression -4379.46 9080.78 59 0.0657 6-class regression -4401.74 9190.80 71 0.0893
Note: In both the cohorts, the five class solution leads to the minimum value of BIC, which is highlighted as the best fitting model.
TABLE 5
5 Class Model Results for Cohort 1 Predictors Relationship Type 1 Relationship Type 2 Relationship Type 3 Relationship Type 4 Relationship Type 5 Focus buy -10.31 (-0.64)ab -32.17 (-0.66) -21.21 (-0.17) 73.67 (0.17) -7.21 (-0.03) Length of time 0.01 (0.47) 0.03 (0.50) -0.06 (-0.85) -0.065 (-0.37) 0.47 (1.18) Number of Returns -2.99 (-1.64) -18.57 (-2.03) 8.10 (1.22) 21.86 (4.21) -33.78 (-2.77) Average interpurchase time 0.03 (1.54) 0.05 (0.56) -0.01 (-0.05) 0.18 (0.46) -10.59 (-3.03) Cross buy 4.68 (2.64) 4.81 (1.14) 6.85 (1.40) 2.69 (0.68) 57.03 (4.55) Purchase amount 0.39 (20.24) 0.73 (16.42) 0.17 (7.02) 2.01 (20.97) 0.92 (6.77) Number of orders 15.28 (4.05) 57.99 (6.22) -21.18 (-2.49) 30.93 (3.38) -16.91 (-0.97) Time -18.27 (-3.97) -20.29 (-1.43) -36.05 (-2.22) -8.34 (-0.30) -57.39 (-0.70) Time squared 2.47 (5.66) 1.99 (1.67) 4.01 (2.90) 0.25 (0.11) 3.35 (0.49) a
Beta coefficients with z statistics given in parentheses.
b
FIGURE 1
Alternative Brand Relationship Development Trajectories
Panel A Biological Life Cycle Panel B Growth-Decline-Plateau Panel C Passing Fling Panel D Approach Avoidance Panel E Cyclical Resurgence Panel F Stable Maturity
FIGURE 2
Average Profitability Growth Trajectories2
Relationship Type 1
Irregulars
-200
-100
0
100
200
300
1
2
3
4
5
6
7
8
9 10 11 12
Time (Quarters)
Ave. Net
Pr
o
fit
ab
ilit
y (
Cn
d
)
2 Trajectory names were adopted from Fournier’s (1998) relationship development trajectories wherever the
FIGURE 3
Average Profitability Growth Trajectories
Relationship Type 2
Flat Liners
-200
-100
0
100
200
300
1
2
3
4
5
6
7
8
9 10 11 12
Time (Quarters)
A
v
e.
N
et
Pr
o
fit
ab
ilit
y (
C
n
d
)
FIGURE 4
Average Profitability Growth Trajectories
Relationship Type 3
Challengers
-200
-100
0
100
200
300
1
2
3
4
5
6
7
8
9 10 11 12
Tim e (Quarters)
A
ve.
N
et
Pr
o
fit
ab
ilit
y
(C
nd)
FIGURE 5
Average Profitability Growth Trajectories
Relationship Type 4
Grow th-Decline Plateau
0
500
1000
1500
2000
2500
3000
1
2
3
4
5
6
7
8
9 10 11 12
Tim e (Quarters)
A
ve.
N
et
Pr
o
fit
ab
ilit
y (
C
n
d
)
FIGURE 6
Average Profitability Growth Trajectories
Relationship Type 5
Cyclical Resurgence
0
500
1000
1500
2000
2500
3000
1
2
3
4
5
6
7
8
9 10 11 12
Tim e (Quarters)
A
ve.
Net
P
ro
fit
ab
ilit
y (
Cn
d
)
References:
Allenby, Greg, Robert Leone, and Lichung Jen (1999), "A Dynamic Model of Purchase Timing with Application to Direct Marketing,"Journal of the American Statistical Association, 94,
(June), 365-374.
Anderson, James C. and James A. Narus (1990), "A Model of Distributor Firm and Manufacturer Firm Working Partnerships,"Journal of Marketing, 54, (January) 42-58.
Buendapudi, Neeli and Leonard Berry (1997), "Customers' Motivations for Maintaining Relationships With Service Providers,"Journal of Retailing, 73,(Spring), 15-37.
Berry, Leonard (1995), "Relationship Marketing of Services - Growing Interest, Emerging Perspectives,"Journal of the Academy of Marketing Science, 23, 236-245.
Bolton, Ruth (1998), "A Dynamic Model of the Duration of the Customer's Relationship with a Continuous Service Provider: The Role of Satisfaction,"Marketing Science, 17, 45-65.
---- and Katherine Lemon (1999), "A Dynamic Model of Customers' Usage of Services: Usage as an Antecedent and Consequence of Satisfaction,"Journal of Marketing Research, 36,(May),
----, ----, and Peter Verhoef (2004), “The Theoretical Underpinnings of Customer Asset Management: A Framework and Propositions for Future Research,”Academy of Marketing
Science, 32, 3, 271-282
De Wulf, Kristof, Gaby Odekerken-Schroder, and Dawn Iacobucci (2001), "Investments in Consumer Relationships: A Cross-Country and Cross-Industry Exploration,"Journal of
Marketing, 65, (October), 33-50.
Dowling, Grahame (2002), "Customer Relationship Management: In B2C Markets, Often Less is More,"California Management Review, 44, (Spring), 87-104.
Du, Rex and Wagner Kamakura (2006), "Household Life Cycles and Lifestyles in the United States",Journal of Marketing Research, XLIII (February), 121-132.
Dwyer, Robert, Paul Schurr, and Sejo Oh (1987), "Developing Buyer-Seller Relationships,"
Journal of Marketing, 51, (April), 11-27.
Fournier, Susan (1998), "Consumers and Their Brands: Developing Relationship Theory in Consumer Research,"Journal of Consumer Research, 24, (March), 343-373.
Garbarino, Ellen and Mark S. Johnson (1999), "The Different Roles of Satisfaction, Trust, and Commitment in Customer Relationships,"Journal of Marketing, 63, (April), 70-87.
Hogan, John E., Katherine N. Lemon, and Roland T. Rust (2002), "Customer Equity Management Charting New Directions for the Future of Marketing,"Journal of Service
Research, 5, 4-12.
Johnson, Michael D. and Fred Selnes (2004), "Customer Portfolio Management: Toward a Dynamic Theory of Exchange Relationships,"Journal of Marketing, 68, (April), 1-17.
---- and ---- (2005), "Diversifying Your Customer Portfolio,"MIT Sloan Management Review,
46, (Spring), 11-14.
Kamakura, Wagner and Gary Russell (1989) "A Probabilistic Choice Model for Market Segmentation and Elasticity Structure"Journal of Marketing Research, XXVI, (November),
379-390.
Lewis, Michael (2005) "Research Note: A Dynamic Programming Approach to Customer Relationship Pricing"Management Science, 51, (June), 986-994.
Morgan, Robert M. and Shelby D. Hunt (1994) "The Commitment-Trust Theory of Relationship Marketing"Journal of Marketing, 58, (July), 20-38.
Netzer, Oded, James Lattin, and V. Srinivasan (2005) A Hidden Markov Model of Customer Relationship Dynamics, Working Paper, Columbia University.
Oliver, Richard L. (1999) "Whence Consumer Loyalty"Journal of Marketing, 63, (Special
Issue), 33-44.
Reichheld, Frederick F. and W. Earl Sasser, Jr. (1990) "Zero Defections: Quality Comes to Services"Harvard Business Review, 68, (October), 105-111.
Reinartz, Werner and V. Kumar (2000) "On the Profitability of Long-Life Customers in a Noncontractual Setting: An Empirical Investigation and Implications for Marketing."Journal of
Marketing, 64, (October), 17-35.
---- and ---- (2003) “The Impact of Customer Relationships on Profitable Lifetime Duration.”
Journal of Marketing, 67, (January), 77-99.
Roeder, Kathryn, Kevin G. Lynch, and Daniel S. Nagin (1999) "Modeling Uncertainty in Latent Class Membership: A Case Study in Criminology"Journal of the American Statistical
Association, 94, 766-776.
Sheth, Jagdish N. and Atul Parvatiyar (1995) "Relationship Marketing in Consumer Markets: Antecedents and Consequences."Journal of the Academy of Marketing Science, 23, (September),
255-271.
Singer, Judith D. and John B. Willett (2003)Applied Longitudinal Data Analysis: Modeling
Venkatesan, Rajkumar and V. Kumar (2004) "A Customer Lifetime Value Framework for Customer Selection and Resource Allocation Strategy"Journal of Marketing, 68, (October),
106-125.
Wedel, Michel and Wayne S. DeSarbo (1994) “A Review of Recent Developments in Latent Class Regression Models,” inAdvanced Methods of Marketing Research, Richard Bagozzi, ed.
Cambridge, MA: Blackwell Business.
---- and ---- (2002) "Market Segment Derivation and Profiling Via a Finite Mixture Model Framework"Marketing Letters, 13, (February), 17-25.
---- and Wayne Kamakura (1998)Market Segmentation Conceptual and Methodological
Foundations Norwell, Massachusetts: Kluwer Academic Publishers.
Zeithaml, Valarie A. (2000) "Service Quality, Profitability, and the Economic Worth of Customers: What we Know and What we Need to Learn"Journal of Academy of Marketing
Science, 28, 67-85.
----, Leonard L. Berry, and A. Parasuraman (1996) "The Behavioral Consequences of Service Quality"Journal of Marketing, 60, (April), 31-46.
----, Roland Rust, and Katherine N. Lemon (2001) "The Customer Pyramid: Creating and Serving Profitable Customers"California Management Review, 43, (July), 118-142.