arXiv:physics/0505087 v1 12 May 2005
Fifteen Minutes of Fame: The Dynamics of Information Access on the Web
Z. Dezs˝o1, E. Almaas1, A. Luk´acs2, B. R´acz2, I. Szakad´at3, A.-L. Barab´asi11.Center for Complex Network Research and Department of Physics, University of Notre Dame, Notre Dame, IN 46556 2. Computer and Automation Research Institute, Hungarian Academy of Sciences MTA SZTAKI, Budapest, Hungary
3.Axelero Internet Provider Inc., 1364 Budapest, Hungary
(Dated May 13, 2005)
While current studies on complex networks focus on systems that change relatively slowly in time, the structure of the most visited regions of the Web is altered at the timescale from hours to days. Here we investigate the dynamics of visitation of a major news portal, representing the prototype for such a rapidly evolving network. The nodes of the network can be classified into stable nodes, that form the time independent skeleton of the portal, and news documents. The visitation of the two node classes are markedly different, the skeleton acquiring visits at a constant rate, while a news document’s visitation peaking after a few hours. We find that the visitation pattern of a news document decays as a power law, in contrast with the exponential prediction provided by simple models of site visitation. This is rooted in the inhomogeneous nature of the browsing pattern characterizing individual users: the time interval between consecutive visits by the same user to the site follows a power law distribution, in contrast with the exponential expected for Poisson processes. We show that the exponent characterizing the individual user’s browsing patterns determines the power-law decay in a document’s visitation. Finally, our results document the fleeting quality of news and events: while fifteen minutes of fame is still an exaggeration in the online media, we find that access to most news items significantly decays after 36 hours of posting.
The recent interest in the topological properties of complex networks is driven by the realization that under-standing the evolutionary processes responsible for net-work formation is crucial for comprehending the topolog-ical maps describing many real systems [1–9]. A much studied example is the WWW, whose topology is driven by its continued expansion through the addition of new documents and links. This growth process has inspired a series of network models that reproduce some of the most studied topological features of the Web [10–17]. The bulk of the current topology driven research focuses on the so called publicly indexable web, which changes only slowly, and therefore can be reproduced with rea-sonable accuracy. In contrast, the most visited portion of the WWW, ranging from news portals to commercial sites, change within hours through the rapid addition and removal of documents and links. This is driven by the fleeting quality of news: in contrast with the 24-hour news cycle of the printed press, in the online media the non-stop stream of new developments often obliterates an event within hours. But the WWW is not the only rapidly evolving network: the wiring of a cell’s regulatory network can also change very rapidly during cell cycle or when there are rapid changes in environmental and stress factors [7]. Similarly, while in social networks the cumu-lative number of friends and acquaintances an individual has is relatively stable, an individual’s contact network, representing those that it interacts with during a given time interval, is often significantly altered from one day to the other. Given the widespread occurrence of these rapidly changing networks, it is important to understand their topology and dynamical features.
Here we take a first step in this direction by studying as a model system a news portal, consisting of news items
that are added and removed at a rapid rate. In particu-lar, we focus on the interplay between the network and the visitation history of the individual documents. In this context, users are often modeled as random walk-ers, that move along the links of the WWW. Most re-search on diffusion on complex networks [18–26] ignores the precisetimingof the visit to a particular web docu-ment. There are good reasons for this: such topological quantities as mean free path or probability of return to the starting point can be expressed using the diffusion time, where each time step corresponds to a single dif-fusion step. Other approaches assume that the difdif-fusion pattern is a Poisson process [27], so that the probabil-ity of an HTML request in adt time interval is pdt. In contrast, here we show that the timing of the browsing process is non-Poisson, which has a significant impact on the visitation history of web documents as well.
I. DATASET AND NETWORK STRUCTURE
Automatically assigned cookies allow us to reconstruct the browsing history of approximately 250,000 unique visitors of the largest Hungarian news and entertainment portal (origo.hu), which provides online news and maga-zines, community pages, software downloads, free email and search engine, capturing 40% of all internal Web traf-fic in Hungary. The portal receives 6,500,000 HTML hits on a typical workday. We used the log files of the portal to collect the visitation pattern of each visitor between 11/08/02 and 12/08/02, the number of new news docu-ments released in this time period being 3,908.
From a network perspective most web portals consist of a stable skeleton, representing the overall organization
of the web portal, and a large number of news items that are documents only temporally linked to the skeleton. Each news item represents a particular web document with a unique URL. A typical news item is added to the main page, as well as to the specific news subcategories to which it belongs. For example, the report about an important soccer match could start out simultaneously on the front page, the sports page and the soccer subdi-rectory of the sports page. As a news document “ages”, new developments compete for space, thus the document is gradually removed from the main page, then from the sports page and eventually from the soccer page as well. After some time (which varies from document to docu-ment) an older news document, while still available on the portal, will be disconnected from the skeleton, and can be accessed only through a search engine. To fully understand the dynamics of this network, we need to dis-tinguish between the stable skeleton and the news docu-ments with heavily time dependent visitation.
The documents belonging to the skeleton are charac-terized by an approximately constant daily visitation pat-tern, thus the cumulative number of visitors accessing them increases linearly in time. In contrast, the visita-tion of news documents is the highest right after their release and decreases in time, thus their cumulative vis-itation reaches a saturation after several days. This is illustrated in Fig. 1, where we show the cumulative visi-tation for the main page (www.origo.hu/index.html) and a typical news item.
0 1000 2000 3000 Time (103s) 0 2e+06 4e+06 6e+06 Number of visits 0 500 1000 1500 2000 Time (103s) 0 2000 4000 6000 8000 10000 12000 (a) (b)
FIG. 1. The cumulative number of visits to a typical skele-ton document (a) and a news document (b). The difference between the two visitation patterns allows us to distinguish between news documents and the stable documents belonging to the skeleton.
The difference between the two visitation patterns al-lows us to distinguish in an automated fashion the web-sites belonging to the skeleton from the news documents. For this we make a linear regression to each site’s cumu-lative visitation pattern and calculate the deviation from the fitted lines, documents with very small deviations being assigned to the skeleton. The validity of the algo-rithm was checked by inspecting the URL of randomly selected documents, as the skeleton and the news
docu-ments in most cases have a different format. But given some ambiguities in the naming system, we used the vis-itation based distinction to finalize the classification of the documents into skeleton and news.
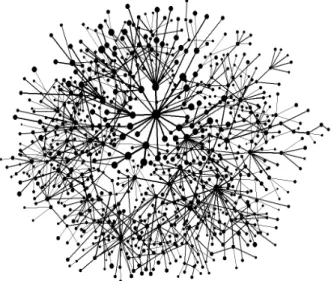
When visiting a news portal, we often get the impres-sion that it has a hierarchical structure. As shown in Fig. 2 the skeleton forms a complex network, driving the visitation patterns of the users. Indeed, the main site, shown in the center, is the most visited, and the docu-ments to which it directly links to also represent highly visited sites. In general (with a few notable exceptions, however), the further we go from the main site on the network, the smaller is the visitation. The skeleton of the studied portal has 933 documents with an average degree close to 2 (i.e. it is largely a tree, with only a few loops, confirming our impression of a hierarchical topol-ogy), the network having a few well connected nodes (or hubs), while many are linked to the skeleton by a single link [16,17].
FIG. 2. The skeleton of the studied web portal has 933 nodes. The area of the circles assigned to each node in the figure is proportional with the logarithm of the total num-ber of visits to the corresponding web document. The width of the links are proportional with the logarithm of the to-tal number of times the hyperlink was used by the surfers on the portal. The central largest node corresponds to the main page (www.origo.hu/index.html) directly connected to several other highly visited sites.
II. THE DYNAMICS OF NETWORK VISITATION
Given that the difference between the skeleton and the news documents is driven by the visitation patterns, next we focus on the interplay between the visitation pattern of individual users and the overall visitation of a doc-ument. The overall visitation of a specific document is
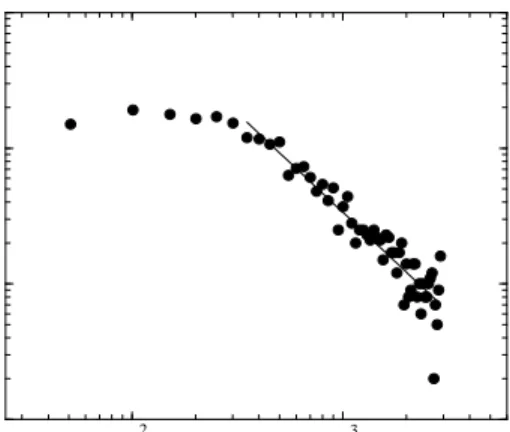
expected to be determined both by the document’s posi-tion on the web page, as well as the content’s potential importance for various user groups. In general the num-ber of visitsn(t) to a news document follows a dampened periodic pattern: the majority of visits (28%) take place within the first day, decaying to only 7% on the second day, and reaching a small but apparently constant visi-tation beyond four days (Fig 3a). Given that after a day or two most news are archived, the long-term saturation of visitation corresponds to direct search or traffic from outside links. 100 101 102 103 104 105
Time(10
3units) 100 1010
10 20 30 40 50
Time (10
5units)0
2
4
6
8
Visitation 0 5 10 0 20 40 60 Visitation(a)
(b)
(c)
Time (days)FIG. 3. (a) The visitation pattern of news documents on a web portal. The data represents an average over 3,908 news documents, the release time of each being shifted to day one, keeping the release hour unchanged. The first peak indicates that most visits take place on the release day, rapidly decaying afterward. (b) The same as plot (a), but to reduce the daily fluctuations we define the time unit as one web page request on the portal. (c) Logarithmic binned decay of visitation of (b) shown in a log-log plot, indicating that the visitation follows n(t) ∼ (t+t0)−β, with t0 = 12 and β = 0.3±0.1
shown as a continuous line on both (b) and (c).
To understand the origin of the observed decay in visi-tation, we assume that the portal hasNusers, each read-ing the news document of direct interest for him/her. Therefore, at every time step each user reads a given document with probability p. Users will not read the same news more than once, therefore the number of users which have not read a given document decreases with time. We can calculate the time dependence of the num-ber of potential readers to a news document using
dN(t)
dt =−N(t)p (1)
whereN(t) is the number of visitors which have not read the selected news document by time t. The probability
that a new user reads the news document is given by N(t)p. Equation (1) predicts that
N(t) =Nexp(−t/t1/2) (2) wheret1/2= 1/p, characterizing the halftime of the news item. The number of visits (n) in unit time is given by
n(t) =−dN
dt =
N t1/2
exp(−t/t1/2). (3) Our measurements indicate, however, that in contrast with this exponential prediction the visitation does not decay exponentially, but its asymptotic behavior is best approximated by a power law (Fig 3c)
n(t)∼t−β (4)
withβ = 0.3±0.1, so that while the bulk of the visits takes place at smallt, a considerable number of visits are recorded well beyond the document’s release time.
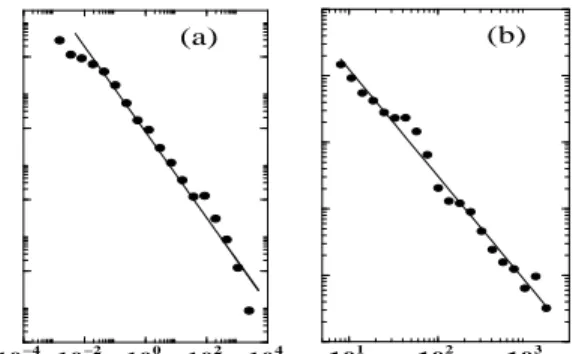
Next we show that the failure of the exponential model is rooted in the uneven browsing patterns of the individ-ual users. Indeed, Eqs. (1) and (2) are valid only if the users visit the site in regular fashion such that they all notice almost instantaneously a newly added news document. In contrast, we find that the time interval between consecutive HTML requests by the same visi-tor is not uniform, but follows a power law distribution,
P(τ)∼τ−α, withα= 1.2±0.1 (Fig 4a).
10−4 10−2 100 102 104 τ (103 s) 10−3 10−1 101 103 105 P ( τ) 101 102 103 T1/2 (10 3 s) 10−2 10−1 100 101 102 103 P (T 1/2 ) (a) (b)
FIG. 4. (a) The distribution of time intervals between two consecutive visits of a given user. The cutoff for high τ (τ ≈106
) captures finite size effects, as time delays over a week are undercounted in the month long dataset. The con-tinuous line has slopeα= 1.2 (b) The halftime distribution for individual news items, following a power-law with expo-nent−1.5±0.1.
This means that for each user numerous frequent downloads are followed by long periods of inactivity, a bursting, non-Poisson activity pattern that is a generic feature of human behavior [28] and it is observed in many natural and human driven dynamical processes [29–40]. In the following we show that this uneven user visitation pattern is responsible for the slow decay in the visitation
of a news document and that n(t) can be derived from the browsing pattern of the individual users.
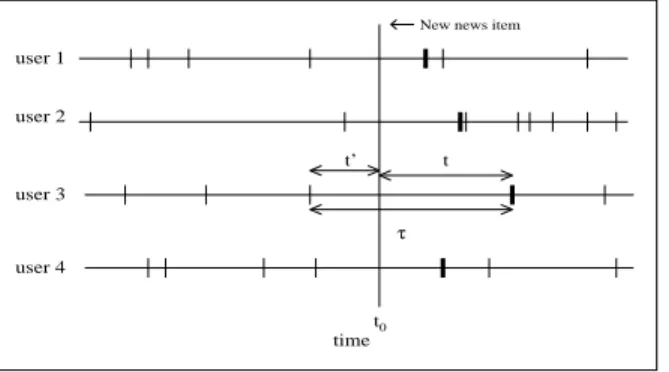
Let us assume that a given news document was released at timet0 and that all users visiting the main page after the release read that news. Because each user reads each document only once, the visitation of a given document is determined by the number of new users visiting the page where the document is featured.
user 1 user 2 user 3 user 4 t time0 t’ τ t
New news item
FIG. 5. The browsing pattern of four users, every vertical line representing the time of a visit to the main page. The time a news document was released on the main page is shown att0. The thick vertical bars represent the first time the users visit the main page after the news document was released, i.e. the time they could first visit and read the article.
In Fig. 5 we show the browsing pattern for four differ-ent users, each vertical line represdiffer-enting a separate visit to the main page. The thick lines show for each user the first time they visit the main pageafter the studied news document was released at t0. The release time of the news (t0) divides the time interval τ into two con-secutive visits of length t′
and t, where t+t′
=τ. The probability that a user visits at timetafter the news was released is proportional to the number of possible τ in-tervals, which for a giventis proportional to the possible values of t′
given by the number of intervals having a length larger thant,
P(τ > t) =
Z ∞
t
τ−αdτ ∼t−α+1
. (5)
If we haveN users, each following a similar browsing statistics, the number of new users visiting the main page and reading the news item in a unit time (n(t)) follows
n(t)∼N P(τ > t)∼N t−α+1
. (6)
Equation (6) connects the exponent α characterizing the decay in the news visitation to β in Eq. (4), char-acterizing the visitation pattern of individual users, pro-viding the relation
β=α−1. (7)
This is in agreement with our measurements within the error bars, as we find thatα= 1.2±0.1 andβ = 0.3±0.1.
To further test the validity of our predictions we stud-ied the relationship betweenα and β for the more gen-eral case, when a user that visits the main page reads a news item with probabilityp. We numerically generated browsing patterns for 10,000 users, the distribution for the time intervals between two consecutive visits,P(τ), following a power-law with exponent α = 1.5 (Fig. 6 inset). 100 101 102 103 104 105 Time (103units) 10−2 10−1 100 101 102 Number of visits p=1 p=0.7 p=0.5 p=0.3 100 102 104 100 102 104 106 108 β=1.5
FIG. 6. We numerically generated browsing patterns for 10,000 users, the distribution of the time intervals between two consecutive visits by the same user following a power-law with exponentα = 1.5. We assume that users visiting the main page will read a given news item with probability p. The number of visits per unit time decays as a power-law with exponentβ= 0.5 for four different values ofp(circles for p= 1, squares forp= 0.7, diamonds forp= 0.5 and triangle for p = 0.3). The empty circles represent the visitation of a news item if the users follow a Poisson browsing pattern. We keep the average time between two consecutive visit of each user the same as the one observed in the real data. As the figures indicates, the Poisson browsing pattern cannot reproduce the real visitation decay of a document, predicting a much faster (exponential) decay.
In Fig. 6 we calculate the visits for a given news item, assuming that the users visiting the main page read the news with probability p, characterizing the ”stickiness” or the potential interest in a news item. As we see in the figure the value of β is close to 0.5 as predicted by (7). Furthermore, we find thatβis independent ofp, indicat-ing that the inter-event time distributionP(τ) character-izing the individual browsing patterns is the main factor that determines the visitation decay of a news document, the difference in the content (stickiness) of the news play-ing no significant role. As a reference, we also determined the decay in the visitation assuming that the users fol-low a Poisson visitation pattern [27] with the same inter-event time as observed in the real data. As Fig. 6 shows, a Poisson visitation pattern leads to a much faster decay in document visitation then the power-law seen in Fig. 3c. Indeed, using Poisson inter-event time distribution in (5) would predict an exponentially decaying tail forn(t).
It is useful to characterize the interest in a news doc-ument by its half time (T1/2), corresponding to the time frame during which half of all visitors that eventually ac-cess it have visited. We find that the overall half-time distribution follows a power law (Fig. 4b), indicating that while most news have a very short lifetime, a few continue to be accessed well beyond their initial release. The average halftime of a news document is 36 hours, i.e. after a day and a half the interest in most news fades. A similar broad distribution is observed when we inspect the total number of visits a news document receives (Fig. 7), indicating that the vast majority of news generate lit-tle interest, while a few are highly popular [41]. Similar weight distributions are observed in a wide range of com-plex networks [42–46]. 102 103 n visits 100 101 102 103 N(n vists )
FIG. 7. The distribution of the total number of visits dif-ferent news documents receive during a month. The tail of the distribution follows a power law with exponent 1.5.
The short display time of a given news document, com-bined with the uneven visitation pattern indicates that users could miss a significant fraction of the news by not visiting the portal when a document is displayed. We find that a typical user sees only 53% of all news items appearing on the main page of the portal, and downloads (reads) only 7% of them. Such shallow news penetration is likely common in all media, but hard to quantify in the absence of tools to track the reading patterns of in-dividuals.
III. DISCUSSION
Our main goal in this paper was to explore the inter-play between individual human visitation patterns and the visitation of specific websites on a web portal. While we often tend to think that the visitation of a given doc-ument is driven only by its popularity, our results offer a more complex picture: the dynamics of its accessibility is equally important. Indeed, while “fifteen minutes of
fame” does not yet apply to the online world, our mea-surements indicate that the visitation of most news items decays significantly after 36 hours of posting. The aver-age lifetime must vary for different media, but the decay laws we identified are likely generic, as they do not de-pend on content, but are determined mainly by the users’ visitation and browsing patterns [28]. These findings also offer a potential explanation of the observation that the visitation of a website decreases as a power law follow-ing a peak of visitation after the site was featured in the media [47]. Indeed, the observed power law decay most likely characterizes the dynamics of theoriginalnews ar-ticle, which, due to the uneven visitation patterns of the users, displays a power law visitation decay (see eq. (4)). These results are likely not limited to news portals. In-deed, we are faced with equally dynamic network when we look at commercial sites, where items are being taken off the website as they are either sold or not carried any longer. It is very likely that the visitation of the individ-ual users to such commercial sites also follows a power law interevent time, potentially leading to a power law decay in an item’s visitation. The results might be ap-plicable to biological systems as well, where the stable network represents the skeleton of the regulatory or the metabolic network, indicating which nodescouldinteract [45,7], while the rapidly changing nodes correspond to the actual molecules that are present in a given moment in the cell. As soon as a molecule is consumed by a reaction or transported out of the cell, it disappears from the sys-tem. Before that happens, however, it can take place in multiple interactions. Indeed, there is increasing experi-mental evidence that network usage in biological systems is highly time dependent [48,49].
While most research on information access focuses on search engines [50], a significant fraction of new informa-tion we are exposed to comes from news, whose source is increasingly shifting online from the traditional printed and audiovisual media. News, however, have a fleeting quality: in contrast with the 24-hour news cycle of the printed press, in the online and audiovisual media the non-stop stream of new developments often obliterates a news event within hours. Through archives the In-ternet offers better long-term search-based access to old events then any other media before. Yet, if we are not exposed to a news item while prominently featured, it is unlikely that we will know what to search for. The ac-celerating news cycle raises several important questions: How long is a piece of news accessible without targeted search? What is the dynamics of news accessibility? The results presented above show that the online media allows us to address these questions in a quantitative manner, offering surprising insights into the universal aspects of information dynamics. Such quantitative approaches to online media not only offer a better understanding of in-formation access, but could have important commercial applications as well, from better portal design to under-standing information diffusion [51–53], flow [54] and mar-keting in the online world.
[1] R. Albert and A.-L. Barab´asi, Rev. Mod. Phys. 74, 47 (2002).
[2] S. N. Dorogovtsev and J. F. F. Mendes, Evolution of Net-works: From Biological Nets to the Internet and WWW (New York: Oxford University Press, 2003).
[3] R. Pastor-Satorras and A. Vespignani, Evolution and Structure of the Internet: A Statistical Physics Approach (Cambridge University Press, February 2004).
[4] M. E. J. Newman, SIAM Review45, 167 (2003). [5] M. E. J. Newman, A.-L. Barab´asi and D. J. Watts, The
Structure and Dynamics of Complex Networks (Prince-ton University Press, Prince(Prince-ton, 2005).
[6] Eli Ben-Naim, H. Frauenfelder, Z. Toroczkai Complex Networks (Lecture Notes in Physics) (Springer Verlag: October 16, 2004).
[7] A.-L. Barab´asi and Z. N. Oltvai, Nature Rev. Gen. 5, 101-113 (2004).
[8] S. Bornholdt and H. G. Schuster, Handbook of Graphs and Networks: From the Genome to the Internet (Ger-many: Wiley-VCH 2003).
[9] S. H. Strogatz, Nature410, 268 (2001).
[10] R. Albert, H. Jeong, and A.-L. Barab´asi, Nature 401, 130 (1999).
[11] B. A. Huberman, L. A. Adamic, Nature401, 131 (1999). [12] J. Kleinberg, R. Kumar, P. Raghavan, S. Rajagopalan and A. Tomkins, The web as a graph: measurements, models and methods, Proc. Intl. Conf. on Combinatorics and Computing, 1-18, (1999).
[13] D. M. Pennock, G. W. Flake, S. Lawrence, E. J. Glover, C. L. Giles, PNAS99, 5207 (2002).
[14] S. N. Dorogovtsev, J. F. F. Mendes and A. N. Samukhin, Phys. Rev. Lett.85, 4633 (2000).
[15] B. Kahng, Y. Park and H. Jeong, Phys. Rev. E 66, 046107 (2002).
[16] A.-L. Barab´asi and R. Albert, Science286, 509 (1999). [17] A.-L. Barab´asi, R. Albert and H. Jeong, Physica A272,
173 (1999).
[18] J. D. Noh and H. Rieger, Phys. Rev. E69, 036111 (2004). [19] J. D. Noh and H. Rieger, Phys. Rev. Lett. 92, 118701
(2004).
[20] S. Jespersen, I. M. Sokolov and A. Blumen, Phys. Rev. E.62, 4405 (2000).
[21] J. Lahtinen, J. Kert´esz and K. Kaski, Phys. Rev. E.64, 057105 (2001).
[22] J. Lahtinen, J. Kert´esz and K. Kaski, Physica A 311, 571 (2002).
[23] S. A. Pandit and R. E. Amritkar, Phys. Rev. E. 63, 041104 (2001).
[24] E. Almaas, R. V. Kulkarni and D. Stroud, Phys. Rev. E 68, 056105 (2003).
[25] R. Monasson, Eur. Phys. J. B12, 555 (1999).
[26] B. A. Huberman, P. L. T. Pirolli, J. E. Pitkow and R. M. Lukose, Science280, 95 (1998).
[27] J. F. C. Kingman, Poisson Processes (Clanderon Press, Oxford, 1993).
[28] A.-L. Barab´asi, Nature (2005, in press).
[29] J. F. Omori, Sci. Imp. Univ. Tokyo7, 111 (1895). [30] S. Abe and N. Suzuki, cond-mat/0410123. [31] A. Vazquez and A.-L. Barab´asi, preprint.
[32] C. Dewes, A. Wichmann, A. Feldman, Proceedings of the 2003 ACM SIGCOMM Conference on Internet Measure-ment (IMC-03), Miami Beach, FL, USA, October 27–29 (ACM Press, New York, 2003).
[33] S. D. Kleban and S. H. Clearwater, Hierarchical Dynam-ics, Interarrival Times and Performance, Proceedings of SC’03, November 15-21,2003, Phonenix, AZ, USA. [34] V. Paxson and S. Floyd, IEEE/ACM Tansactions in
Net-working3, 226 (1995).
[35] V. Plerou, P. Gopikirshnan, L. A. N. Amaral, X. Gabaix and H. E. Stanley, Phys. Rev. E62, R3023 (2000). [36] J. Masoliver, M. Montero and G. H. Weiss, Phys. Rev. E
67, 021112 (2003).
[37] T. Henderson and S. Nhatti, Modelling user behavior in networked games, Proc. ACM Multimedia 2001, Ottawa, Canada, pp 212-220, 30 September–5 October (2001).
[38] U. Harder and M. Paczuski,
http://xxx.lanl.gov/abs/cs.PF/0412027.
[39] H. R. Anderson, Fixed Broadband Wireless System De-sign(Wiley, New York, 2003).
[40] P. Ch. Ivanov, B. Podobnik, Y. Lee, and H. E. Stanley Physica A 299, 154-160 (2001).
[41] F. Menczer, Proc. Natl. Acad. Sci.101, 5261 (2004). [42] K.-I. Goh, B. Kahng, and D. Kim, Phys. Rev. E 64,
051903 (2001); K.-I. Goh, E. Oh, H. Jeong, B. Kahng, and D. Kim, PNAS99, 12588 (2002).
[43] A. Barrat, M. Barthelemy, R. Pastor-Satorras and A. Vespignani, PNAS101, 3747 (2004).
[44] G. Szabo, M. Alava and J. Kert´esz Phys. Rev. E 66, 026101 (2002).
[45] E. Almaas, B. Kovacs, T. Vicsek, Z. N. Oltvai and A.-L. Barab´asi, Nature427, 839 (2004).
[46] S.H. Yook, H. Jeong, A.-L. Barab´asi and Y. Tu, Phys. Rev. Lett.86, 5835 (2001).
[47] A. Johansen and D. Sornette, Physica A276, 338 (2000). [48] J. Jing-Dong et al. Nature430, 88 (2004).
[49] N. M. Luscombe at al. Nature431, 308 (2004).
[50] S. Lawrence and C. L. Giles, Nature400, 107 (1999); S. Lawrence and C. L. Giles, Science280, 98 (1998). [51] R. Pastor-Satorras and A. Vespignani, Phys. Rev. Lett.
86, 3200-3203 (2001).
[52] S. Ciliberti and G. Caldarelli and De los Rios P. Pietronero and L. Zhang, YC. Phys. Rev. Lett.85, 4848 (2000).
[53] S. Havlin, and D. Ben-Avraham, Adv. Phys. 51, 187 (2002).