Red Bots Do It Better:
Comparative Analysis of Social Bot Partisan Behavior
Luca Luceri
∗University of Applied Sciences and Arts of Southern Switzerland, and University of Bern
Manno, Switzerland [email protected]
Ashok Deb
USC Information Sciences Institute Marina del Rey, CA
Adam Badawy
USC Information Sciences Institute Marina del Rey, CA
Emilio Ferrara
USC Information Sciences Institute Marina del Rey, CA
ABSTRACT
Recent research brought awareness of the issue of bots on social media and the significant risks of mass manipulation of public opin-ion in the context of political discussopin-ion. In this work, we leverage Twitter to study the discourse during the 2018 US midterm elections and analyze social bot activity and interactions with humans. We collected 2.6 million tweets for 42 days around the election day from nearly 1 million users. We use the collected tweets to answer three research questions:(i)Do social bots lean and behave according
to a political ideology?(ii)Can we observe different strategies among liberal and conservative bots?(iii)How effective are bot strategies in engaging humans?
We show that social bots can be accurately classified according to their political leaning and behave accordingly. Conservative bots share most of the topics of discussion with their human counter-parts, while liberal bots show less overlap and a more inflammatory attitude. We studied bot interactions with humans and observed different strategies. Finally, we measured bots embeddedness in the social network and the extent of human engagement with each group of bots. Results show that conservative bots are more deeply embedded in the social network and more effective than liberal bots at exerting influence on humans.
CCS CONCEPTS
•Networks→Social media networks; •Human-centered com-puting→Social network analysis.
KEYWORDS
social media; political elections; social bots; political manipulation ∗Also with USC Information Sciences Institute.
L. Luceri & A. Deb contributed equally to this work.
This paper is published under the Creative Commons Attribution 4.0 International (CC-BY 4.0) license. Authors reserve their rights to disseminate the work on their personal and corporate Web sites with the appropriate attribution.
WWW ’19 Companion, May 13–17, 2019, San Francisco, CA, USA
© 2019 IW3C2 (International World Wide Web Conference Committee), published under Creative Commons CC-BY 4.0 License.
ACM ISBN 978-1-4503-6675-5/19/05. https://doi.org/10.1145/3308560.3316735
ACM Reference Format:
Luca Luceri, Ashok Deb, Adam Badawy, and Emilio Ferrara. 2019. Red Bots Do It Better: Comparative Analysis of Social Bot Partisan Behavior. In
Companion Proceedings of the 2019 World Wide Web Conference (WWW ’19 Companion), May 13–17, 2019, San Francisco, CA, USA.ACM, New York, NY, USA, 6 pages. https://doi.org/10.1145/3308560.3316735
1
INTRODUCTION
During the last decade, social media have become the conventional communication channel to socialize, share opinions, and access the news. Accuracy, truthfulness, and authenticity of the shared content are necessary ingredients to maintain a healthy online discussion. However, in recent times, social media have been dealing with a considerable growth of false content and fake accounts. The resulting wave of misinformation (and disinformation) highlights the pitfalls of social media and their potential harms to several constituents of our society, ranging from politics to public health. In fact, social media networks have been used for malicious purposes to a great extent [11]. Various studies raised awareness about the risk of mass manipulation of public opinion, especially in the context of political discussion. Disinformation campaigns [2, 5, 12, 14–17, 22, 24, 26, 30] and social bots [3, 4, 21, 23, 25, 29, 31, 32] have been indicated as factors contributing to social media manipulation.
The 2016 US Presidential election represents a prime example of the significant perils of mass manipulation of political discourse. Badawy et al. [1] studied the Russian interference in the election and the activity of Russian trolls on Twitter. Im et al. [18] suggested that troll accounts are still active to these days. The presence of social bots does not show any sign of decline [10, 32] despite the attempts from social network providers to suspend suspected, mali-cious accounts. Various research efforts have been focusing on the analysis, detection, and countermeasures development against so-cial bots. Ferrara et al. [13] highlighted the consequences associated with bot activity in social media. The online conversation related to the 2016 US presidential election was further examined [3] to quantify the extent of social bots activity. More recently, Stella et al. [27] discussed bots’ strategy of targeting influential humans to ma-nipulate online conversation during the Catalan referendum for independence, whereas Shao et al. [25] analyzed the role of social bots in spreading articles from low credibility sources. Deb et al.
[10] focused on the 2018 US Midterms elections with the objective to find instances of voter suppression.
In this work, we investigate social bots behavior by analyzing their activity, strategy, and interactions with humans. We aim to answer the following research questions (RQs) regarding social bots behavior during the 2018 US Midterms election.
RQ1: Do social bots lean and behave according to a political ideology?
We investigate whether social bots can be classified based on their political inclination into liberal or conservative leaning. Further, we explore to what extent they act similarly to the corresponding human counterparts.
RQ2: Can we observe different strategies among liberal and conser-vative bots?We examine the differences between social bot strategies to mimic humans and infiltrate political discus-sion. For this purpose, we measure bot activity in terms of volume and frequency of posts, interactions with humans, and embeddedness in the social network.
RQ3: How effective are bot strategies in engaging humans?We in-troduce four metrics to estimate the effectiveness of bot strategies in involving humans in their conversation and to evaluate the degree of human interplay with social bots. We leverage Twitter to capture the political discourse during the 2018 US midterm elections. We collected 2.6 million tweets for 42 days around election day from nearly 1 million users. We then explore collected data and attain the following findings:
•We show that social bots are embedded in each political side and behave accordingly. Conservative bots abide by the topic discussed by the human counterpart more than liberal bots, which in turn exhibit a more provocative attitude.
•We examined bots’ interactions with humans and observed different strategies. Conservative bots stand in a more cen-tral social network position, and divide their interactions between humans and other conservative bots, whereas lib-eral bots focused mainly on the interplay with the human counterparts.
•We measured the extent of human engagement with bots and recognized the strategy of conservative bots as the most effective in terms of influence exerted on human users.
2
DATA
In this study, we use Twitter to investigate the partisan behavior of malicious accounts during the 2018 US midterm elections. For this purpose, we carried out a data collection from the month prior (October 6, 2018) to two weeks after (November 19, 2018) the day of the election. We kept the collection running after the election day as several races remained unresolved. We employed the Python moduleTwytonto collect tweets through the Twitter Streaming API using the following keywords as a filter:2018midtermelections,
2018midterms,elections,midterm, andmidtermelections. As a result, we gathered 2.7 million tweets, whose IDs are publicly available for download.1From this set, we first removed any duplicate tweet, which may have been captured by accidental redundant queries to the Twitter API. Then,we filtered out all the tweets not written in English language and those that were out of the context of this 1https://github.com/A-Deb/midterms
Table 1: Dataset statistics
Statistic Count # of Tweets 452,288 # of Retweets 1,869,313 # of Replies 267,973 # of Users 997,406
study. Overall, we retain nearly 2.6 millions tweets, whose aggregate statistics are reported in Table 1.
3
METHODOLOGY
3.1
Bot Detection
Nowadays, bot detection is a fundamental asset for understanding social media manipulation and, more specifically, to reveal ma-licious accounts. In the last few years, the problem of detecting automated accounts gathered both attention and concern [13], also bringing a wide variety of approaches to the table [7, 8, 20, 28]. While increasingly sophisticated techniques keep emerging [20], in this study, we employ the widely usedBotometer.2
Botometer is a machine learning-based tool developed by Indiana University [9, 29] to detect social bots in Twitter. It is based on an ensemble classifier [6] that aims to provide an indicator, namelybot score, used to classify an account either as a bot or as a human. To feed the classifier, the Botometer API extracts about 1,200 features related to the Twitter account under analysis. These features fall in six broad categories and characterize the account’s profile, friends, social network, temporal activity patterns, language, and sentiment. Botometer outputs a bot score: the lower the score, the higher the probability that the user is human. In this study we use version
v3of Botometer, which brings some innovations, as detailed in [32]. Most importantly, the bot scores are now rescaled (and not centered around 0.5 anymore) through a non-linear re-calibration of the model.
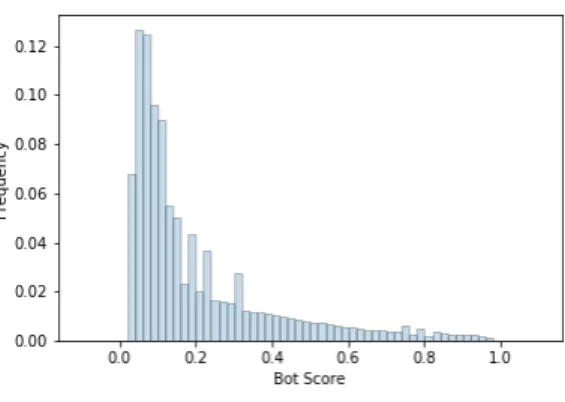
In Figure 1, we depict the bot score distribution of the 997,406 distinct users in our datasets. The distribution exhibits a right skew: most of the probability mass is in the range [0, 0.2] and some peaks can be noticed around 0.3. Prior studies used the 0.5 threshold to sep-arate humans from bots. However, according to the re-calibration introduced in Botometerv3[32], along with the emergence of in-creasingly more sophisticated bots, we here lower the bot score threshold to 0.3 (i.e., a user is labeled as a bot if the score is above 0.3). This threshold corresponds to the same level of sensitivity setting of 0.5 in prior versions of Botometer (cf. Fig 5 from [32]).
According to this choice, we classified 21.1% of the accounts as bots, which in turn generated 30.6% of the tweets in our data set. Overall, Botometer did not return a score for 35,029 users that corre-sponds to 3.5% of the accounts. We used the Twitter API to further inspect them. Interestingly, 99.4% of these accounts were suspended by Twitter, whereas the remaining percentage of users protected their tweets turning on the privacy settings of their accounts.
3.2
Political Ideology Inference
In parallel to the bot detection analysis, we examine the political leaning of both bots and humans in our dataset. To classify users based on their political ideology, we rely on the political leaning of 2https://botometer.iuni.iu.edu/
Figure 1: Bot score distribution
the media outlets they share. We make use of a list of partisan media outlets released by third-party organizations, such as AllSides3and Media Bias/Fact Check.4We combine liberal and liberal-center me-dia outlets into one list (composed of 641 outlets) and conservative and conservative-center into another (composed of 398 outlets). To cross reference these media URLs with the URLs in the Twitter dataset, we need to get the expanded URLs for most of the links in the dataset, as most of them are shortened. However, this process is quite time-consuming, thus, we decided to rank the top 5,000 URLs by popularity and retrieve the long version only for those. These top 5,000 URLs accounts for more than 254K, or more than 1/3 of all the URLs in the dataset. After cross-referencing the 5,000 extended URLs with the media URLs, we observe that 32,115 tweets in the dataset contain a URL that points to one of the liberal media outlets and 25,273 tweets with a URL pointing to one of the conservative media outlets.
To label Twitter accounts as liberal or conservative, we use a polarity rule based on the number of tweets they produce with links to liberal or conservative sources. Thereby, if an account has more tweets with URLs pointing to liberal sources, it is labeled as liberal and vice versa. Although the overwhelming majority of accounts include URLs that are either liberal or conservative, we remove any account that has equal number of tweets from each side. Our final set of labeled accounts includes 38,920 users.
Finally, we use label propagation to classify the remaining ac-counts in a similar way to previous work (cf.[1]). For this purpose, we construct a social network based on the retweets exchanged between users. The nodes of the retweet network are the users, which are connected by a direct link if one user retweeted a post of another user. To validate results of the label propagation algorithm, we apply a stratified cross (5-fold) validation to a set composed of 38,920 seed accounts. We train the algorithm using 80% of the seeds and we evaluate the performance on the remaining 20%. Finally, we compute precision and recall by reiterating the validation of the 5-folds. Both precision and recall scores show value around 0.89 with bounds from 0.88 to 0.90. Both the scores for liberals are about 0.87 with 0.85-0.88 bounds, while for conservatives the scores are around 0.93 with 0.92-0.93 bounds. To further validate the proposed approach, we use as a ground truth the political leaning of the media outlet that users shared in their profile, obtaining precision and recall scores in line with the previous approach.
3https://www.allsides.com/media-bias/media-bias-ratings 4https://mediabiasfactcheck.com/
Table 2: Users and tweets statistics
Liberal Conservative Humans 386,391 (38.7%) 122,761 (12.3%)
Bots 82,118 (8.2%) 49,488 (4.9%)
(a) Number (percentage) of users per group
Liberal Conservative Humans 957,726 (37.0%) 476,231 (18.4%)
Bots 288,659 (11.1%) 364,727 (14.1%)
(b) Number (percentage) of tweets per group
3.3
Human-Bot Interaction
We next introduce four metrics to estimate the effectiveness of bot actions in involving humans and, at the same time, measure to what extent humans rely upon, and interact with the content generated by social bots. Thereby, we propose the following metrics:
• Retweet Pervasiveness(RT P) measures the intrusiveness of bot-generated content in human-generated retweets:
RT P=no. of human retweets from bot tweets
no. of human retweets (1) • Reply Rate(RR) measures the percentage of replies given by
humans to social bots:
RR=no. of human replies to bot tweets
no. of human replies (2) • Human to Bot Rate(H2BR) quantifies human interaction with
bots over all the human activities in the social network: H2BR=no. of humans interaction with bots
no. of humans activity , (3) where the numerator counts for human replies/retweets to/of bots generated content, while the denominator is the sum of the number of human tweets, retweets, and replies. • Tweet Success Rate(T SR) is the percentage of tweets
gener-ated by bots that obtained at least one retweet by a human: T SR=no. of tweet retweeted at least once by a human
no. of bots tweets (4)
4
RESULTS
Next, we address the research questions discussed in the Intro-duction. We examine social bot partisanship and, accordingly, we analyze bots’ strategies and measure the effectiveness of their ac-tions in terms of human engagement.
4.1
RQ1: Bot Political Leaning
The combination of the outcome from the bot detection algorithm and the political ideology inference allowed us to identify four groups of users, namely Liberal Humans, Conservative Humans, Liberal Bots, and Conservative Bots. In Table 2a, we show the per-centage of users per group. Note that perper-centages do not sum up to 100 as either the political ideology inference was not able to classify every user, or Botometer did not return a score, as we pre-viously mentioned. In particular, we were able to assign a political leaning to 63% of bots and 67% of humans. We find that the liberal user population is almost three times larger than the conservative counterpart. This discrepancy is also present, but less evident, for the bot accounts, which exhibit an unbalance in favor of liberal
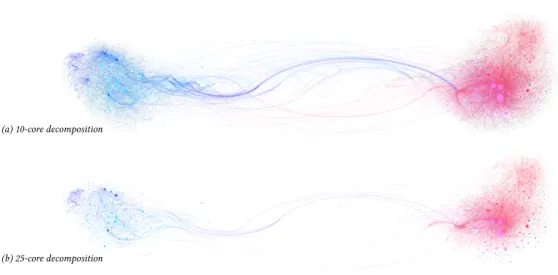
(b) 25-core decomposition (a) 10-core decomposition
Figure 2: Political discussion over(a)the 10-core, and(b)the 25-core decomposition of the retweet network. Each node repre-sents a user, while links represent retweets. Links with weight (i.e., frequency of occurrence) less than 2 are hidden to minimize visual clutter. Blue nodes represent liberal accounts, while red nodes indicate conservative users. Darker tones (blue and red) depict bots, while lighter tones (cyan and pink) relate to humans, and the few green nodes represent unclassified accounts. The link takes the same color of the source node (author of the retweet), whereas node size is proportional to the in-degree of the user.
Table 3: Top 20 hashtags generated by liberal and conserva-tive bots. Hashtags in bold are not present in the top 50 hash-tags used by the corresponding human group.
Liberal Bots Conservative Bots #MAGA #BrowardCounty #NovemberisComing #MAGA #TheResistance #StopTheSteal #GOTV #WalkAway #Florida #WednesdayWisdom #ImpeachTrump #PalmBeachCounty #Russia #Florida #VoteThemOut #QAnon #unhackthevote #KAG #FlipTheHouse #IranRegime #RegisterToVote #Tehran #Resist #WWG1WGA #ImpeachKavanaugh #Louisiana #GOP #BayCounty #MeToo #AmericaFirst #AMJoy #DemocratsAreDangerous #txlege #StopTheCaravan #FlipTheSenate #Blexit #CultureOfCorruption #VoteDemsOut #TrumpTrain #VoterFraud
bots. Further, we investigate the suspended accounts to inspect the consistency of this result. The inference algorithm attributed a political ideology to 63% of these accounts, which show once again the liberal advantage over the conservative faction (45% vs. 18%).
Figure 2 shows twok-core decomposition graphs of the retweet network. In ak-core, each node is connected with at leastkother nodes. Figures 2a and 2b capture the 10-core and 25-core decompo-sition, respectively. Here, nodes represent Twitter users and link represent retweets among them. We indicate assourcethe user that
retweeted the tweet of atargetuser. Colors represent the political ideology, with darker colors (red and blue) being bots and lighter colors (cyan and pink) being human users; size represents the in-degree. The graph is visualized using a force-directed layout [19], where nodes repulse each other, while edges attract their nodes. In our setting, this means that users are spatially distributed accord-ing to the amount of retweets between each other. The result is a network naturally split into two communities, where each side is almost entirely populated by users with the same political ideology. This polarization is also reflected by bots, which are embedded, with humans, in each political side. Two facts are worth noting:(i)
askincreases, the left k-core appears to disrupt, while the right k-core remains well connected; and,(ii)askincreases, bots appear to outnumber humans, suggesting that bots may populate areas of the retweet network that are more central and better connected.
Next, we examine the topics discussed by social bots and com-pare them with the human counterparts. Table 3 shows the top 20 hashtags utilized by liberal and conservative bots. We highlight (in bold) the hashtags that are not present in the top 50 hashtags used by the corresponding human group to point out the similar-ities and differences among the groups. In this table, we do not take into account hashtags related to the keywords used in the data collection (such as #elections, #midterms), and hashtags used to sup-port the political group (such as #democrats, #liberals, #VoteRed(or Blue)ToSaveAmerica) as(i)the overlap between bot and human hashtags is noticeable when these terms are considered (in the interest of space, we do not show this result in Table 3), and(ii) we aim to narrow the analysis to specific topics and inflammatory content, inspired by [27]. Moreover, we used an enlarged subset of hashtags for the human groups to further strengthen the dif-ferences and, at the same time, to better understand the objective of social bots. Although bots and humans share the majority of
Table 4: Average network centrality measures
Liberal Conservative Humans 2.66·10−6 4.14·10−6
Bots 3.70·10−6 7.81·10−6
(a) Out-degree centrality
Liberal Conservative Humans 2.52·10−6 4.24·10−6
Bots 2.53·10−6 6.22·10−6
(b) In-degree centrality
hashtags, two main differences can be noticed. First, conservative bots abide by the corresponding human counterpart more than the liberal bots. Second, liberal bots focus on more inflammatory and provocative content (e.g., #ImpeachTrump, #ImpeachKavanaugh, #FlipTheSenate) w.r.t. conservative bots.
4.2
RQ2: Bot Activity and Strategies
In this Section, we investigate social bot activity based on their political leaning. We explore their strategies in interacting with humans and the degree of embeddedness in the social network.
Table 2b depicts the number (and percentage) of tweets generated by each group. Despite the group composed of conservative bots is the smallest in terms of number of accounts, it produced more tweets than liberal bots and closely approaches the number of tweets generated by the human counterpart. The resultingtweet per user ratioshows that conservative bots produce 7.4 tweets per account, which is more than twice the ratio related to the liberal bots (3.5), almost the double of the human counterpart (3.9), and nearly three times the ratio of liberal humans (2.5).
To investigate the interplay between bots and humans, we con-sider the previously described retweet network. Figure 3 shows the interaction among the four groups. We maintain the same color mapping described before, with darker color (on the bottom) rep-resenting bots and lighter color (on top) indicating humans. Node size is proportional to the percentage of accounts in each group, while edge size is proportional to the percentage of interactions between each group. In Figure 3a, this percentage is computed considering all the interactions in the retweet network, while in Figure 3b we consider each group separately, therefore, the edge size gives a measure of the group propensity to interact with the other groups. Consistently with Figure 2, we observe that there is a limited amount of interaction between the two political sides. The majority of interactions are either intra-group or between groups of the same political leaning. From Figure 3b, we can observe that the two bot factions adopted different strategies. Conservative bots balanced their interactions by retweeting group members 43% of the time, and the human counterpart 52% of the time. On the other hand, liberal bots mainly retweeted liberal humans (71% of the time) and limited the intra-group interactions to the 22% of their retweet activity. Interestingly, conservative humans interacted with the conservative bots (28% of the time) much more than the liberal counterpart (16%) with the liberal bots. To better understand these results and to measure the extent of human engagement with bots, in the next Section we evaluate the four metrics introduced earlier in this paper.
Bots Humans
(a)Overall interactions (b)Group-based interactions Figure 3: Interactions according to political ideology
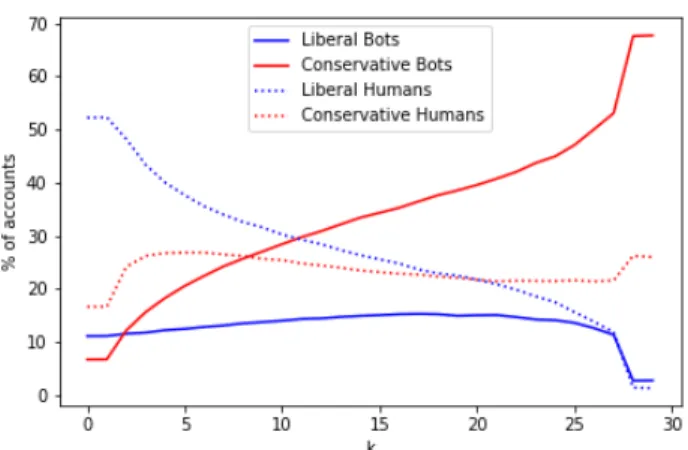
Figure 4: k-core decomposition, liberal vs. conservative users
Finally, we examine the degree of embeddedness of both hu-mans and bots within the retweet network. For this purpose, we first compute different network centrality measures, and then we adopt the k-core decomposition technique to identify the most central nodes in the graph. In Table 4, we show the average out-and in-degree centrality for each group of users. Out-degree cen-trality measures the quantity of outgoing links, while in-degree centrality considers the number of of incoming links. Both of these measures are normalized by the maximum possible degree of the graph. Overall, conservative groups have higher centrality mea-sures than the liberal ones. We can notice that conservative bots achieve the highest values both for the out- and in-degree centrality. To further investigate bots embeddedness in the social network, we use the k-core decomposition. The objective of this technique is to determine the set of nodes deeply embedded in a graph. The k-core is a subgraph of the original graph in which every node has a degree equal to or greater than a given valuek. We extracted the k-cores from the retweet network by varyingkin the range between 0 and 30. Figure 4 depicts the percentage of liberal and conservative users as a function ofk. We can notice that, askgrows, the fraction of conservative bots increases, while the percentage of liberal bots remains almost stationary. On the human side, the liberal fraction drops withk, whereas the conservative percentage remains approximately steady. Overall, conservative bots sit in a more central position in the social network and are more deeply connected if compared to the liberal counterpart.
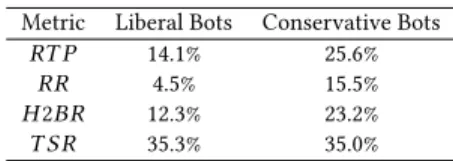
Table 5: Bot Effectiveness in Human Engagement
Metric Liberal Bots Conservative Bots
RT P 14.1% 25.6%
RR 4.5% 15.5%
H2BR 12.3% 23.2%
T S R 35.3% 35.0%
4.3
RQ3: Bot Effectiveness in Human
Engagement
In this Section, we aim to estimate the effectiveness of bot strategies in involving humans and measure to what extent humans rely upon, and interact with the content generated by social bots. We examine the effect of bot activities by means of the four metrics described in SectionHuman-Bot Interaction. We evaluate each political side sep-arately, thus, we compare the interaction between bots and humans with the same leaning. In Table 5, we depict the results for each group of bots. Diverse aspects are worthy of consideration. We can observe that conservative bots are significantly more effective in involving humans in their conversations than the liberal counter-part. Although theT SRs of theredandbluebots are comparable, the gap between the two groups, with respect to the other metrics, is significant. To carefully interpret this result, it should also be noticed that(i)theT SRis inversely proportional to the number of tweets generated by bots, and(ii)conservative bots tweeted more than the liberal counterpart, as depicted in Table 2b. Overall, conservative bots received a larger degree of interaction with (and likely trust from) human users. In fact, conservative humans inter-acted with the bot counterpart almost twice with retweets (RT P), and more than three times with replies (RR) if compared to the liberal group. Finally, theH2BRhighlights a remarkable amount of human activities that involve social bots: almost one in four actions performed by conservative humans goes towards red bots.
5
CONCLUSIONS & FUTURE WORK
In this work, we conducted an investigation to analyze social bots activity during the 2018 US Midterm election. We showed that social bots are embedded in each political wing and behave accordingly. We observed different strategies between conservative and liberal bots. Specifically, conservative bots stand in a more central position in the social network and abide by the topic discussed by the human counterpart more than the liberal bots, which in turn exhibit an inflammatory attitude. Further, conservative bots balanced their interaction with humans and bots of the red wing, whereas liberal bots focused mainly on the interplay with the human counterpart. Finally, we inspected the effectiveness of these strategies in terms of human engagement and recognized the strategy of the conser-vative bots as the most effective. However, these results open the door to further interpretation and discussion. Are conservative bots more effective because of their strategy or because of the human ineptitude to distinguish their nature? This, and related analysis, will be expanded in future work.
Acknowledgements. The authors gratefully acknowledge support by the Air Force Office of Scientific Research (award #FA9550-17-1-0327). L. Luceri is funded by the Swiss National Science Foundation (SNSF) via the CHIST-ERA projectUPRISE-IoT.
REFERENCES
[1] Adam Badawy, Emilio Ferrara, and Kristina Lerman. 2018. Analyzing the Digital Traces of Political Manipulation: The 2016 Russian Interference Twitter Campaign. InInt. Conference on Advances in Social Networks Analysis and Mining. 258–265.
[2] Adam Badawy, Kristina Lerman, and Emilio Ferrara. 2019. Who Falls for Online Political Manipulation?Companion of the The Web Conference 2019(2019). [3] Alessandro Bessi and Emilio Ferrara. 2016. Social bots distort the 2016 US
Presidential election online discussion.First Monday21, 11 (2016).
[4] Olga Boichak, Sam Jackson, Jeff Hemsley, and Sikana Tanupabrungsun. 2018. Automated Diffusion? Bots and Their Influence During the 2016 US Presidential Election. InInternational Conference on Information. Springer, 17–26. [5] Alexandre Bovet and Hernán A Makse. 2019. Influence of fake news in Twitter
during the 2016 US presidential election.Nature communications10, 1 (2019), 7. [6] Leo Breiman. 2001. Random forests.Machine learning45, 1 (2001), 5–32. [7] Nikan Chavoshi, Hossein Hamooni, and Abdullah Mueen. 2016. DeBot: Twitter
Bot Detection via Warped Correlation.. InICDM. 817–822.
[8] Zhouhan Chen and Devika Subramanian. 2018. An Unsupervised Approach to Detect Spam Campaigns that Use Botnets on Twitter.arXiv:1804.05232(2018). [9] Clayton Allen Davis, Onur Varol, Emilio Ferrara, Alessandro Flammini, and
Filippo Menczer. 2016. Botornot: A system to evaluate social bots. InProceedings of the 25th International Conference Companion on World Wide Web. [10] Ashok Deb, Luca Luceri, Adam Badawy, and Emilio Ferrara. 2019. Perils and
Challenges of Social Media and Election Manipulation Analysis: The 2018 US Midterms.Companion of the The Web Conference 2019(2019).
[11] Emilio Ferrara. 2015. Manipulation and abuse on social media.ACM SIGWEB NewsletterSpring (2015), 4.
[12] Emilio Ferrara. 2017. Disinformation and Social Bot Operations in the Run Up to the 2017 French Presidential Election.First Monday22, 8 (2017).
[13] Emilio Ferrara, Onur Varol, Clayton Davis, Filippo Menczer, and Alessandro Flammini. 2016. The rise of social bots.Commun. ACM59, 7 (2016), 96–104. [14] Emilio Ferrara, Onur Varol, Filippo Menczer, and Alessandro Flammini. 2016.
Detection of promoted social media campaigns. InICWSM. 563–566. [15] Nir Grinberg, Kenneth Joseph, Lisa Friedland, Briony Swire-Thompson, and David
Lazer. 2019. Fake news on Twitter during the 2016 U.S. presidential election.
Science363, 6425 (2019), 374–378.
[16] Andrew Guess, Jonathan Nagler, and Joshua Tucker. 2019. Less than you think: Prevalence and predictors of fake news dissemination on Facebook. Science Advances5, 1 (2019), eaau4586.
[17] Philip N Howard, Gillian Bolsover, Bence Kollanyi, Samantha Bradshaw, and Lisa-Maria Neudert. 2017. Junk news and bots during the US election: What were Michigan voters sharing over Twitter.CompProp, OII, Data Memo(2017). [18] Jane Im, Eshwar Chandrasekharan, Jackson Sargent, Paige Lighthammer, Taylor
Denby, Ankit Bhargava, Libby Hemphill, David Jurgens, and Eric Gilbert. 2019. Still out there: Modeling and Identifying Russian Troll Accounts on Twitter.
arXiv:1901.11162(2019).
[19] Mathieu Jacomy, Tommaso Venturini, Sebastien Heymann, and Mathieu Bastian. 2014. ForceAtlas2, a continuous graph layout algorithm for handy network visualization designed for the Gephi software.PloS one9, 6 (2014), e98679. [20] Sneha Kudugunta and Emilio Ferrara. 2018. Deep Neural Networks for Bot
Detection.Information Sciences467, October (2018), 312–322.
[21] Bjarke Mønsted, Piotr Sapieżyński, Emilio Ferrara, and Sune Lehmann. 2017. Evidence of Complex Contagion of Information in Social Media: An Experiment Using Twitter Bots.Plos One12, 9 (2017), e0184148.
[22] Nathaniel Persily. 2017. The 2016 US Election: Can democracy survive the internet?Journal of democracy28, 2 (2017), 63–76.
[23] Iacopo Pozzana and Emilio Ferrara. 2018. Measuring bot and human behavioral dynamics.arXiv:1802.04286(2018).
[24] Dietram A Scheufele and Nicole M Krause. 2019. Science audiences, misinforma-tion, and fake news.PNAS(2019), 201805871.
[25] Chengcheng Shao, Giovanni Luca Ciampaglia, Onur Varol, Kai-Cheng Yang, Alessandro Flammini, and Filippo Menczer. 2018. The spread of low-credibility content by social bots.Nature communications9, 1 (2018), 4787.
[26] Kai Shu, Amy Sliva, Suhang Wang, Jiliang Tang, and Huan Liu. 2017. Fake news detection on social media: A data mining perspective.ACM SIGKDD Explorations Newsletter19, 1 (2017), 22–36.
[27] Massimo Stella, Emilio Ferrara, and Manlio De Domenico. 2018. Bots increase ex-posure to negative and inflammatory content in online social systems.Proceedings of the National Academy of Sciences115, 49 (2018), 12435–12440.
[28] VS Subrahmanian, Amos Azaria, Skylar Durst, Vadim Kagan, Aram Galstyan, Kristina Lerman, Linhong Zhu, Emilio Ferrara, Alessandro Flammini, Filippo Menczer, et al. 2016. The DARPA Twitter Bot Challenge.Computer49, 6 (2016). [29] Onur Varol, Emilio Ferrara, Clayton A Davis, Filippo Menczer, and Alessandro
Flammini. 2017. Online human-bot interactions: Detection, estimation, and characterization. InInt. AAAI Conference on Web and Social Media. 280–289. [30] Soroush Vosoughi, Deb Roy, and Sinan Aral. 2018. The spread of true and false
news online.Science359, 6380 (2018), 1146–1151.
[31] Samuel Woolley and Douglas Guilbeault. 2017. Computational propaganda in the United States of America: Manufacturing consensus online.CompProp(2017). [32] Kai-Cheng Yang, Onur Varol, Clayton A Davis, Emilio Ferrara, Alessandro
Flam-mini, and Filippo Menczer. 2019. Arming the public with artificial intelligence to counter social bots.Human Behavior and Emerging Technologies(2019), e115.