University of Huddersfield Repository
Alwodai, Ahmed, Shao, Y., Yuan, X., Ahmed, M., Gu, Fengshou and Ball, Andrew
Inter-Turn Short Circuit Detection Based on Modulation Signal Bispectrum Analysis of Motor
Current Signals
Original Citation
Alwodai, Ahmed, Shao, Y., Yuan, X., Ahmed, M., Gu, Fengshou and Ball, Andrew (2013)
Inter-Turn Short Circuit Detection Based on Modulation Signal Bispectrum Analysis of Motor Current
Signals. In: Proceedings of the 19th International Conference on Automation and Computing
(ICAC) 2013: Future Energy and Automation. ICAC 2013 . Brunel University, London, UK. ISBN
978-1908549082
This version is available at http://eprints.hud.ac.uk/18555/
The University Repository is a digital collection of the research output of the
University, available on Open Access. Copyright and Moral Rights for the items
on this site are retained by the individual author and/or other copyright owners.
Users may access full items free of charge; copies of full text items generally
can be reproduced, displayed or performed and given to third parties in any
format or medium for personal research or study, educational or not-for-profit
purposes without prior permission or charge, provided:
•
The authors, title and full bibliographic details is credited in any copy;
•
A hyperlink and/or URL is included for the original metadata page; and
•
The content is not changed in any way.
For more information, including our policy and submission procedure, please
contact the Repository Team at: [email protected].
Inter-Turn Short Circuit Detection Based on
Modulation Signal Bispectrum Analysis of Motor
Current Signals
A. Alwodai1, Y. Shao3*, X. Yuan2, M. Ahmed1, F. Gu1, A. D. Ball1
1Centre for Efficiency and Performance Engineering, University of Huddersfield, Huddersfield, UK 2.
Department of Vehicle Engineering, Taiyuan University of Technology, Shanxi, 030024, P.R. China 3State Key Laboratory of Mechanical Transmission, Chongqing University, P.R. China
Corresponding Email: [email protected]
Abstract—Motor current signature analysis (MCSA) is a common practice in industry for finding motor faults. However, because of small modulations caused by faults and high noise contamination, it is difficult to quantify the modulation in measured signals which is dominated by the supply frequency, higher order harmonics and noise. In this paper a modulation signal bispectrum (MSB) is investigated to detect stator winding faults. This type of fault can cause high winding temperatures which may effect on current signal so motor temperature will be considered in this paper. The results show that MSB has the capability to accurately estimate modulation degrees and suppress the random and non-modulation components. The test results show that MSB has a better performance in differentiating spectrum amplitudes due to stator faults, and hence produces better diagnosis performance, compared with that of conventional power spectrum analysis.
Keywords-Motor current signature; inter turn short circuit; power spectrum; bispectrum
I. INTRODUCTION
Stator winding faults such as the inter-turn short circuit are the most common source of breakdowns in induction motors. Early detection of any small inter-turn short circuit during motor operation will reduce subsequent damage to adjacent coils and the stator core, reducing then the repair cost. Consequently, many new techniques have been investigated to improve the performance of fault detection and diagnosis in motors. Motor current signature analysis (MCSA) is a conventional approach for monitoring motors. The foundation of this technique is widely researched and has been explored extensively by several authors [1-5]. Many of the authors deal with mechanical faults, especially with the effects of broken rotor bars and eccentricities. Thomson and Morrison [2] focused on stator fault diagnosis and presented good results and arguments. These works are a good introduction to MCSA condition-monitoring techniques and gives a clear overview of the analysis of faults.
Higher order spectra (HOS) are useful signal processing tools that have shown significant benefits over traditional spectral analyses because HOS have nonlinear system identifications, phase information retention and Gaussian noise elimination properties. The application of HOS techniques in condition monitoring has been
reported in [6, 7] and it is clear that multi-dimensional HOS measures can contain more useful information than traditional two-dimensional spectral measurement for diagnostic purposes. Specifically, Gu et al [7, 8] introduced a MS bispectrum which is more efficient in resolving the modulation process of current signals of downstream compressors and gearboxes, which is then used for diagnosing different common faults. In [9] the MS bispectrum was presented to diagnose open circuit stator fault, it was found out that MS bispectrum produces better diagnosis performance, compared with that of conventional power spectrum analysis. However, these techniques have not been examined for inter-turn short circuit fault.
This paper provides the details of applying a MS bispectrum analysis to current signals to enhance feature components for the detection and diagnosis of the stator faults, and then compares it with conventional power spectrum. Bispectrum signal processing tools are then developed to characterise the current signals for identifying both the presence and magnitude of the seeded faults under two different loads.
II. ELECTRICAL MOTOR CURRENT SIGNALS
There are four typical stator faults: winding short turn, open circuit, phase-to-phase short and phase-to-ground. These asymmetric stator faults are usually related to insulation failures which are resulted from different reasons such as overloading, poor connection etc. It has been reported in [1] that around 38% of all reported induction motor failures fall into these fault modes. Because of this high failure rate, stator fault diagnosis has been studied extensively and a range of papers have been published on the analysis of air gap, axial flux and terminal current signals to understand possible fault mechanisms, and for finding effective and reliable features in measured current signals.
In general, stator faults causes uneven distribution of the air-gap flux waveform around the stator cross section, which allows the stator currents to be modulated by rotor slot frequency, and the feature frequencies in current signals can be found at characteristic frequencies[10]:
[ [ ]] (1)
The authors are grateful for the financial support provided by the National Natural Science Key Foundation of China under Contract No. 51035008
Proceedings of the 19th International Conference on Automation & Computing, Brunel University,
To be convenient for field engineers, (1) can be expressed in terms of rotor frequency as
(2)
where fs is the supply frequency, fr the rotor speed, s the
motor slip, Nb the number of rotor bars, p the number of pole-pairs and m= 1, 2, 3… is the harmonic orders.
III. ANALYSIS TECHNIQUES
A. Power Spectrum
Power spectrum method is generally used to describe the power distribution of electrical current signal in the frequency domain for obtaining diagnostic information. Usually it is calculated using Fourier transform (FT) by:
( ) { ( ) ( )} (3)
where ( ) and its conjugate ( ) are the Fourier transform of the signal sequence ( ); and E{ } is the expectation operator[11].
B. Conventional Bispectrum
The bispectrum analysis is a type of higher order spectra (HOS), which has been used by a large number of research publications since 1980 in different fields such as communications and medicine [12]. Given a discrete time current signal x(n), its discrete Fourier transform (DFT), X(f) is defined to be
( ) ∑ ( )
(4)
Equation (4) can be written in term of magnitude | ( )|and phase as
( ) | ( )| (5)
According to [13] the conventional bispectrum can be defined as
( ) { ( ) ( ) ( )} (6)
where f1, f2 and f1+ f2indicate the individual frequency
components achieved from the Fourier series integral. Bispectrum analysis has a number of unique properties such as nonlinear system identification, phase information retention and Gaussian noise elimination when compared with power spectrum analysis. Moreover, bispectrum is a very effective tool for detecting quadratic phase coupling (QPC), which occurs when two waves interact non-linearly and generate a third wave with a frequency and phase equal to the sum (or difference) of the first two waves.
A summary of the various bicoherence estimators can be found in [14]. The definition of squared bicoherence used in (7) is chosen because it is bounded between 0 and 1, which is easy for comparing the degree of nonlinearity or coupling effect between different signals.
( ) | ( )|
{| ( ) ( )|} {| ( )|} (7)
A normalized form of the bispectrum or bicoherence is usually used to measure the degree of coupling between coupled components. The bicoherence is close to 1 if there are nonlinear interactions among frequency combinations f1, f2 and f1+ f2. On the other hand, a value of nearer 0
means an absence of interactions between the components. Therefore, based on the amplitude of bicoherence, the nonlinear interactions can be detected and the interaction degrees can be also measured between the coupling components.
If the frequency components at f1, f2 and f1+ f2 are
independent components, each frequency will be described by statistically independent random phases distributed over(-π, π). Upon statistical averaging denoted by the expectation operator E{ } in (6), the bispectrum will tend towards zero due to the random phase mixing effect. This way ensures that the random noise can be suppressed significantly
On the other hand, if the three spectral components: f1,
f2 and f1+ f2 are non-linearly coupled to each other, the
total phase of the three components will not be random, even though each of the individual phases are random, in particular, the phases have the following relationship:
( ) ( ) ( ) (8)
Consequently, the statistical averaging will not lead to a zero value in the bispectrum. This nonlinear coupling is indicated by a peak in the bispectrum at the bifrequency ( ).
C. Modulated MS Bispectrum
Even though conventional bispectrum representation of current signal permits the inclusion of phase information and the elimination of Gaussian noise, it produces unstable results due to random phase variation of the sideband components in the current signal.
Equation (6) includes only the presence of nonlinearity from the harmonically related frequency components: f1, f2
and f1+f2. It also overlooks the possibility that the
occurrence of f1-f2 might be due to the nonlinearity
between f1 and f2. Because of this, it is inadequate to
describe amplitude modulation (AM) signals as motor current signals.
To improve the performance of the conventional bispectrum in characterizing the motor current signals, a new variant of the conventional bispectrum, named as a modulation signal bispectrum (MSB) is examined in [7, 15] as (9)
( ) { ( ) ( ) ( ) ( )} (9)
Furthermore, to make a direct comparison with power spectrum in (3), a normalized version of (9) can be introduced as:
In (10) the amplitude of ( )
| ( )| which relates to carrier
component f2 is unity. Thus the amplitude of MS
bispectral peaks is determined purely by the magnitude effect of the sideband components. In other words, the resultant MS bispectral magnitudes are not influenced by the carrier component at supply frequency and hence the product of two symmetrical sidebands | (
) ( )| is equal to either | ( ) ( )| or | ( ) ( )| calculated by (3), because the two sidebands have the same amplitudes.
However, the phase information of the f2 component is
still maintained. Therefore, the normalized MS bispectrum also have the noise cancellation property of bispectrum. Because of this noise cancellation, it is more accurate in estimating modulation magnitude. In contrast the magnitude of power spectrum has the contributions from noise and leads to an overestimation of sidebands components and hence less accurate diagnosis results.
IV.EXPERIMENTALMETHODS
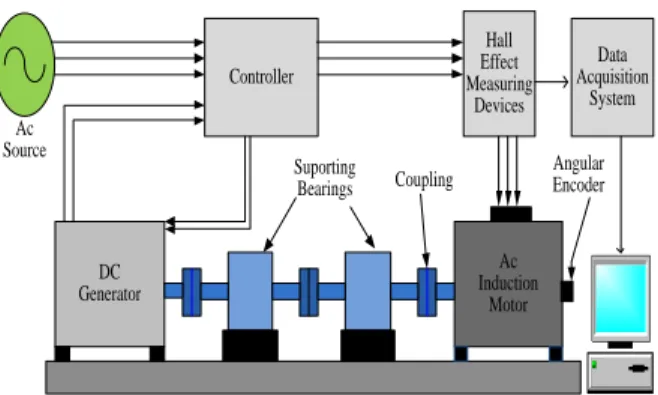
To show the performance of MS bispectrum in analyzing current signals, a dataset is acquired in a motor rig under different simulated fault cases and operating conditions. Fig. 2 shows the schematic diagram of the test facility employed to examine motor stator faults. The system consists of an induction motor, a variable speed controller, supporting bearings, couplings and a DC generator as the load. The test motor is a three-phase induction motor with rated output power of 4 kW at a speed of 1420 rpm (two-pole pairs), 28 rotor bars and 36 slots. To change the speed of the testing motor, a digital variable speed controller is attached to the test rig between the power line source and the motor. The controller can be programmed to any specific shaft rotation speed between 0 and 1500rpm. The induction motor is directly coupled with a loading DC generator. The field of the generator is connected to DC source through a controller while the generated power was fed back to the mains electrical grid, the load in the induction motor can be adjusted by changing the field resistance of the DC generator. The operating load can be varied from no load to full load via the control panel.
Ac Induction Motor DC Generator Computer Controller Hall Effect Measuring Devices Data Acquisition System Suporting Bearings Coupling Ac Source Angular Encoder
Figure 1. Schematic diagram of the induction motor test facility. A power supply measurement unit is designed to measure instantaneous AC voltages, currents and power, using hall-effect voltage and current transducers and a universal power cell. A shaft encoder mounted on the
shaft end, produces 100 pulses per revolution for measuring the motor speed.
During tests all the data was acquired using a GST YE6232B high speed data acquisition system. This system has 16 channels, each with a 24 bit analogue-to-digital converter at a maximum sampling frequency of 96 kHz, which allows the details of the 50Hz component, the high order supply harmonics, rotor bar pass frequency and stator bar pass frequency to be recorded for further analysis.
As shown in Fig. 2, motor stator winding configuration, there are three parallel coils in each phase. Each phase has 168 turns located in 12 slots and is divided into four coils, each coil is divided into two parts; the internal part contains 28 turns while the external part has 14 turns.
Figure 2. Schematic of stator winding connections To evaluate the performance of MSB analysis, current signals were collected under two different stator winding configurations, firstly a healthy motor, two inter turn short circuit in first coil in phase A under two successive load conditions: zero and 25% of full load. This allows the diagnostic performance to be examined at different loads and avoid any possible damages of the test system at the full load when the faults are simulated as shown in Fig 3.
Figure 3. Two-turn shorted in first coil of phase A first coil
V. RESULTS AND DISCUSSIONS
The dataset is processed off-line by using a Matlab program which implements FT calculation to obtain both power spectrum using (3) and MS bispectrum using (10) simultaneously. During the calculation it uses a rectangular FT window of the same size for both power spectrum and MS bispectrum, which results in a frequency resolution of 0.25Hz, with the same average times so that they can be compared directly in their performance of identifying fault characteristic frequencies and quantifying spectral peaks. In the meantime, only the current signal in phase A is examined as the fault is induced to this phase and it produces the most significant changes between the three phases. In addition, a MSB slice only at 50Hz is
A
28 turns 14 turns
A B C
presented for direct comparison because this slice provides the full information about the modulation characteristics.
A. Effect of motor temaprature on motor slip
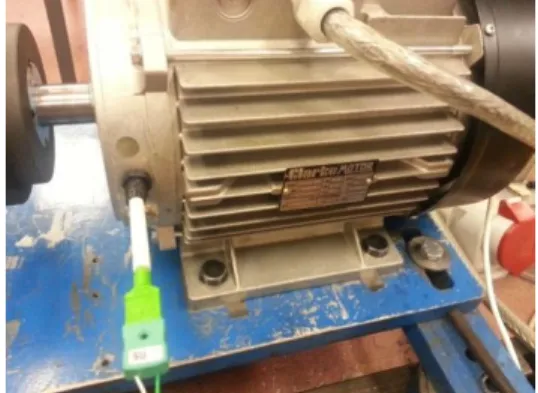
To show the motor temperature effects on motor slip, a k-type 100 mm long mineral insulated plug mounted probe is connected to the motor as shown in Fig 4.
Figure 4. Temprature sensor connected to the motor The temperature sensor measures the air temperature around the stator windings and the rotor bars.
The relationship between motor slip and motor temperature can be determined by [11]
( ( )) (11)
where ss is the slip corrected to specified stator
temperature ts, st is the slip measured at stator winding
temperature tt, ts is the specified temperature which is
based on the class of the insulation system (see [11] for more details), tt is the observed stator winding temperature
during load test, and the constant k1 is 225 for aluminum
rotor conductors.
Figure 5. Healthy motor temparature and slip under 50% full load To demonstrate the relationship between slip and temperature of the induction motor, motor temperature test was performed in the lab. The healthy motor ran at
full speed and 50% full load for ten minutes and data was collected each minute as shown in Fig (5).
Fig 5 (a) shows motor temperature collected under 50% load for the healthy motor in ten minutes. The temperature gradually increases during the test. The motor slip shown in Fig 5(b) increases as well.
B. Spectrum Characteristics
Fig. 6 shows a typical MS bispectrum for current signal under 25% load when the motor is healthy. It has been obtained by applying (9) to phase current signal with f2 =50Hz and f1 varying over the frequency range of
interest in (9) and with average of 100 times. As shown in Fig.6 (b) the 50Hz supply component in the power spectrum is eliminated completely in MSB. This makes it easier and more reliable to examine components that relate to motor heath conditions. For example, the sideband components: (50-24.73) Hz and (50+24.73) Hz around the 50Hz shown by power spectrum of Fig. 6(b), arisen by stator asymmetry, is now represented by a single component at 24.73 in MSB.
Figure 6. MSB and power spectrum characteristics Moreover, MSB shows very good performances in noise reduction. Comparing it with power spectrum shown in Fig.6 (a), it can be found that the spectrum noise floor is about 20dB lower than that of power spectrum. This makes spectral peaks such as that due to stator faults in the high frequency range to be estimated more accurately and hence, able to obtain more accurate and better diagnostic results.
C. Stator Fault Diagnosis by Power Spectrum
Fig. 7 shows typical power spectra for the current signals collected under different loads, namely zero load and 25% load. For the healthy case the characteristic frequency values shift lower and the peak amplitude goes higher with increasing in loads. The existence of the characteristic frequencies in the healthy case is due to inevitable manufacturing tolerances or inherent errors that lead to a clear asymmetric distribution between the three stator phases.
1 2 3 4 5 6 7 8 9 10
0 20 40
(a) Motor Temperature under Load=50(%)
Time (sec) T e m p e ra tu re ( oC) 1 2 3 4 5 6 7 8 9 10 2 2.05 2.1 2.15 Time (sec) s lip (% )
(b) Motor Slip under Load=50(%)
50 150 250 350 450 550 650 750 850 950 -150 -100 -50 0 50 Frequency(Hz) A m p lit u d e (d B )
(a) MSB and Power Spectum
MSB PS 0 50 100 150 -150 -100 -50 0 50 Frequency(Hz) A m p lit u d e (d B )
(b) MSB and Power Spectum in the Low Freqeuncy Range
MSB PS fsf=fs±28fr=50±692.42
Figure 7. Current power spectrum zoomed around lower sidebands of bar-pass-frrequency under different loads and stator cases However, as the asymmetry becomes worse due to the fault, the amplitude increases slightly and the frequency shifts also becomes slightly larger when comparing the results under different motor fault cases, which is consistent with the faults resulting in a weaker magnetic field and more rotor slip. Thus these changes may be used for separating different health cases.
Fig. 8 presents the diagnostic results based on the change in amplitude and frequency estimated from power spectrum using dataset from phase A. The modulation ratio used in Fig. 8(a) is calculated by normalizing the mean value of two sideband amplitudes with the root mean square (RMS) values of current signals, whereas the slip is estimated using the frequency values extracted from power spectrum based on (1). As shown in Fig. 8, the relative amplitude change increases with increasing loads and fault levels, whereas frequency change is due to a change in stator winding temperature, which is consistent with the operating principles of induction motors. As a result, one can see in Fig 8(b) that the slip is higher in the case of healthy motor under 25% load, whereas it identifies the turn shorted case and under zero-load. This is because of changes in the stator winding temperature.
Figure 8. Diagnosis by amplitude changes and slip changes from power spectrum
In addition, the amplitude changes can give a full separation under different load conditions when it has two coil removals on the stator, which shows that amplitude changes is less sensitive to loads and can be a useful feature for power spectrum based diagnosis.
D. Stator Fault Diagnosis by MS Bispectrum
Figure 9. Current MS bispectrum under different loads and stator health cases
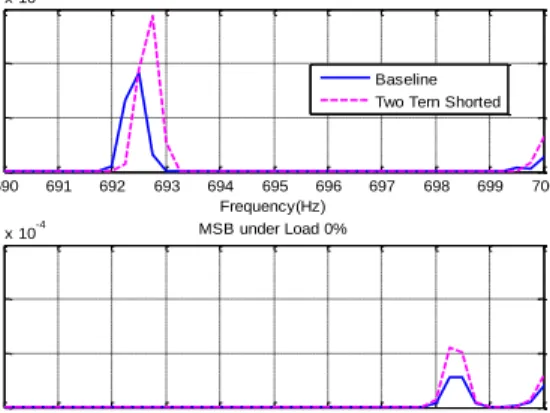
Typical stator current MS bispectra are shown in Fig.9 for the current signals from different loads and motor health cases. Similar to the characteristics observed from power spectra in Fig. 7, MSB peak amplitudes at the characteristic frequencies increases and the frequency value shifts lower as the load increases. However, the amplitude increases more significantly with progression in fault severity. In addition, bispectral peaks in Fig. 9 appear at frequency values that have a 50Hz difference from that of the power spectrum, showing the effect of MSB demodulation.
Figure 10. Diagnosis by amplitude changes and slip changes from MSB analysis
In the same way as that of power spectrum, the healthy case exhibits a frequency shift towards the lower value and an amplitude increase as the load increases. However, for the faulty cases, as the fault severity become higher, MSB amplitudes increase more significantly and the frequency shifts also becomes slightly larger. Moreover, the larger changes in amplitudes with fault cases 640 641 642 643 644 645 646 647 648 649 650 0 2 4 6 8 x 10⁻⁴ Frequency(Hz) A m p li tu d e (A 2) PS under Load 25% Baseline Two Turns Shorted
640 641 642 643 644 645 646 647 648 649 650 0 2 4 6 8 x 10⁻⁴ Frequency(Hz) A m p li tu d e (A 2) PS under Load 0% 0 5 10 15 20 25 0 2 4 6 8x 10 -3
(a) Modulation Ratio from Sidebands of Power Spectrum for Phase A
M o d u la ti o n R a ti o (% ) Load(%) Baseline Two Turns Shorted
0 5 10 15 20 25 0 0.5 1 1.5 S lip (% ) Load(%)
(b) Slip Change Estimated from Power Spectrum in Phase A
Baseline Two Turns Shorted
690 691 692 693 694 695 696 697 698 699 700 0 1 2 x 10⁻⁴ Frequency(Hz) A m p lit u d e (A 4) MSB under Load 25% Baseline Two Tern Shorted
690 691 692 693 694 695 696 697 698 699 700 0 1 2 x 10⁻⁴ Frequency(Hz) A m p lit u d e (A 4) MSB under Load 0% 0 5 10 15 20 25 0 1 2 3 4 5x 10
-3 (a) Modulation Ratio from Bispectral Peaks for Phase A
M o d u la ti o n R a ti o (% ) Load(%) Baseline
Two Turns Shorted
0 5 10 15 20 25 0 0.5 1 1.5 S li p (% ) Load(%)
(b) Slip Change Estimated from MSB Spectrum in Phase A
Baseline Two Turns Shorted
demonstrates that MSB has very effective noise reduction, which allows small amplitude to be estimated accurately and hence produce accurate modulation estimation.
To give an overall assessment of using MSB for fault diagnosis, results are presented in the same way as in power spectrum to show relative amplitude changes and frequency changes in Fig .10. Obviously, the frequency change based diagnosis of Fig.10 (b) shows the same results as that of power spectrum, this is because both MSB and bispectrum are calculated using the same frequency resolution and the same motor temperature which effects on motor slip. However, it can be seen that the amplitude change based diagnosis show nearly full separation results, demonstrating that MSB has a much better performance in diagnosing the stators faults.
VI. CONCLUSION
MSB has been applied to phase current signals for monitoring stator faults. From its spectrum presentation, it can be found that MSB shows a much simpler spectrum structure compared with conventional power spectrum. Moreover it has nearly 20dB noise reduction in the whole frequency range and hence produces more accurate amplitude estimation.
The stator fault causes the amplitude changes and frequency shifts at the characteristic frequency which can be represented by diagnostic features: modulation ratio and slip respectively. MSB modulation ratio produces a higher separation of different motor cases than power spectrum. This shows that MSB has a better performance in diagnosing stator faults. Simultaneously, both MSB slip and power spectrum slip values are the same because the motor slip is affected by motor temperatures only.
In the case of power spectrum, peaks appear at frequencies of (fs±Nb*fr) and increase as the load and fault
increases, as well as the sidebands shaft to the left as the fault severity increases because of changing in stator winding temperature.
In a similar way, the phase current bispectrum sidebands also increase in amplitude with load but they appear at (Nb*fr). Interestingly, MS bispectrum has no
modulation influences which show the faults much clearer, that makes it easier to identify and more accurate to quantify the characteristic frequency of inter-turn short circuit stator fault to produce more accurate diagnostic results.
REFERENCES
[1] W. T.Thomson and M. Fenger, "Current signature analysis to detect induction motor faults," IEEE Industry Applications Magazine pp. 26-34, 2001.
[2] W. T. Thomson and D. Morrison, "On-line Diagnosis of Stator Shorted Turns in Mains and Inverter Fed Low Voltage Induction Motors," Proceedings of IEEE Power Electronics Machines and Drives Conference, pp. 122-127, 2002.
[3] M. E. H. Benbouzid and G. B. Kliman, "What Stator Current Processing-Based Technique to Use for Induction Motor Rotor Fault Diagnosis?," IEEE Trans. Energy Convers, vol. 18, pp. 238-244., 2003.
[4] S. Nandi, H. AToliyat, and X. D. Li, "Condition Monitoring and Fault diagnosis of ElectricalMotors- A
Review," IEEE Trans. Energy Convers, vol. 20, pp. 719-729, 2005.
[5] A. Alwodai, F. Gu, and A. Ball, "Motor Current Signature Analysis of a Variable Speed Drive for Motor Fault Diagnosis," Proceedings of the 24th COMADEM2011, pp. 884–892, 2011.
[6] N.Arthur and J.Penman, "Induction machine condition monitoring with higher order spectra," IEEE Transactions on Industrial Electronics, vol. 47, pp. 1031–1041, 2000. [7] F. Gu, Y. Shao, N. Hu, and A. D. Ball, "Electrical motor
current signal analysis using a modified bispectrum for fault diagnosis of downstream mechanical equipment," Mechanical Systems and Signal Processing vol. 25, pp. 360–372, 2011.
[8] M. Haram, T. Wang, F. Gu, and A. Ball, "An Investigation of the Electrical Response of A Variable Speed Motor Drive for Mechanical Fault Diagnosis " Proceedings of the 24th International Congress on Condition Monitoring and Diagnostic Engineering Management (COMADEM 2011). pp. 867-874, 2011.
[9] A. Alwodai, X. Xia, Y. Shao, F. Gu, and A. D. Ball, "Modulation Signal Bispectrum Analysis of Motor Current Signals for Stator Fault Diagnosis," 18th International Conference on Automation & Computing (ICAC), pp. 1-6, 2012.
[10] J. Cusidó, L. Romeral, J. A. Ortega, A. Garcia, and J. Riba, "Signal Injection as a Fault Detection Technique," Sensors, vol. 11, pp. 3356-3380, 2011.
[11] "IEEE Standard Test Procedure for Polyphase Induction Motors and Generators," IEEE Std 112-2004 (Revision of IEEE Std 112-1996), pp. 0_1-79, 2004.
[12] G. C. Zhang, M. Ge, H. Tong, Y. Xu, and R. Du, "Bispectral analysis for on-line monitoring of stamping operation," Engineering Applications of Artificial Intelligence, vol. 15, pp. 97–104, 2002.
[13] W.B.Collis, P.R.White, and J.K.Hammond, "Higher-orderspectra:thebispectrum and trispectrum," Mechanical SystemsandSignalProcessing, vol. 12, pp. 375–394, 1998. [14] J. W. A. Fackrell, S. McLaughlin, and P. R. White,
"Bicoherence estimation using the direct method. Part 1: Theoretical considerations," Appl. Signal Process, vol. 3, pp. 155–168, 1995.
[15] J. R. Stack, R. G. Hartley, and T. G. Habetler, "An amplitude modulation detector for fault diagnosis in rolling element bearings," IEEE Transactions on Industrial Electronics vol. 51 pp. 1097–1102, 2004.