Bacterial concentrations of poultry
offal and in mechanically separated
meat products at the processing
plant
MAF Technical Paper No: 2011/59
Prepared for the Ministry of Agriculture and Forestry under project MFS/09/07 – Contamination of selected poultry products, as part of an overall contract for scientific services
by Dr Teck Lok Wong Dr Beverley Horn Christopher Graham Dr Susan Paulin ISBN 978-0-478-38469-7(online) ISSN 2230-2794 (online) May 2011
Disclaimer
This report or document (“the Report”) is given by the Institute of Environmental Science and Research Limited (“ESR”) solely for the benefit of the Ministry of Agriculture and Forestry (“MAF”), Public Health Services Providers and other Third Party Beneficiaries as defined in the Contract between ESR and MAF, and is strictly subject to the conditions laid out in that Contract. Neither ESR nor any of its employees makes any warranty, express or implied, or assumes any legal liability or responsibility for use of the Report or its contents by any other person or organisation.
Requests for further copies should be directed to: Publication Adviser
MAF Information Bureau P O Box 2526
WELLINGTON
Telephone: 0800 00 83 33 Facsimile: 04-894 0300
This publication is also available on the MAF website at
www.biosecurity.govt.nz/about-us/our-publications/technical-papers
© Crown Copyright, 2011 - Ministry of Agriculture and Forestry
Acknowledgements
The authors would like to thank:
The PIANZ members who took part in this project, with special acknowledgement for technical assistance from the quality assurance staff at the processing plants.
The staff of the Public Health Laboratory, ESR Christchurch, AsureQuality Auckland and Environmental Laboratory Services Ltd, Lower Hutt, for their technical support of the project.
Client Report FW10089
FINAL REPORT
Dr Stephen On
Food Safety Programme Leader
Dr Teck Lok Wong Maurice Wilson
TABLE OF CONTENTS
2.1. Product sampling ... 3
2.1.1. Whole Carcass Rinse Sampling ... 4
2.1.2. MSM sampling ... 4
2.1.3. Offal Sampling... 4
2.2. Sample preparation and microbiological analyses ... 5
2.2.1. MSM ... 5
2.2.2. Offal – hearts, gizzards and necks ... 5
2.2.3. Offal – livers ... 5
2.3. Analysis ... 7
2.4. Interpretation of enumeration results ... 7
3.1. Mechanically separated meats ... 8
3.1.1. Campylobacter spp. and coagulase-positive staphylococci counts ... 8
3.1.2. Comparison of Campylobacter spp. and coagulase-positive staphylococci counts with indicator bacterial counts. ... 12
3.2. Offal Products: Heart, liver, gizzard and neck ... 16
3.2.1. Campylobacter spp. contamination of heart, liver, gizzard and neck products before washing... 16
3.2.2. Comparison of Campylobacter spp. counts obtained from heart, liver, gizzard and neck rinsates with those from whole carcass rinsates. ... 19
3.2.3. Comparison of Campylobacter spp. counts with indicator bacterial E. coli counts in heart, liver, gizzard and neck rinsates. ... 22
3.3. Comparison of Campylobacter spp. counts from the internal matrix and external surfaces of livers ... 24
4.1. Objective ... 26
4.2. Mechanically separated meat... 26
4.3. Heart, liver, gizzard and neck products ... 27
LIST OF TABLES
Table 1: Number of sets of five samples from a flock analysed for each sample type and processor. ... 3 Table 2: Microbiological testing requirements ... 6 Table 3: Lowest limit of detection ... 7 Table 4: Summary statistics for Campylobacter spp. in whole carcass rinsates taken from
the three processors. ... 31 Table 5: Summary statistics for E. coli in whole carcass rinse samples taken from the
three processors... 31 Table 6: Summary statistics for bacteria in mechanically separated meat products for
three processors... 33 Table 7: Summary statistics for Campylobacter spp. counts from rinsates of poultry
hearts, gizzards, livers and necks from Processors A and B. ... 34 Table 8: Heart, gizzard, liver and neck sampled product weights. ... 34
LIST OF FIGURES
Figure 1: Histogram of counts of Campylobacter spp. and coagulase-positive
staphylococci (Log10 CFU/g) from samples of MSM. The first bar of each plot
represents not detected results, which may be negative or below the limit of detection. ... 9 Figure 2: Campylobacter spp.counts from MSM samples taken on each day for the three
processors. Not detected results (ND) are plotted in the grey band. ... 10 Figure 3: Coagulase-positive staphylococci counts from MSM samples taken on a given
sampling day at processors A and C. Not detected (ND) results are plotted in grey band... 11 Figure 4: Correlation between Campylobacter spp. and E. coli or Aerobic Plate Count
from samples of MSM from three processors; A, B and C. Solid diamonds represent counts for both microorganisms and the open circles represent counts for one of the microorganisms and not detected result for the other. The
Spearman rank correlation coefficient, r, of the counts is provided for Processors A and B. ... 13 Figure 5: Correlation between coagulase-positive staphylococci counts and E. coli or APC
counts from samples of MSM from Processors A and C. Solid diamonds represent counts for both microorganisms and the open circles represent counts for only one of the microorganisms. ... 15 Figure 6: Frequency of Campylobacter spp. counts (Log10 CFU/rinsate) from rinsates of
poultry heart, gizzard, neck and liver samples from two processors. The first bar in each plot represents not detected results, which may be negative or below the limit of detection. ... 17 Figure 7: Correlation between Campylobacter spp. counts from rinsates of heart, liver and
gizzard samples taken from the same bird. Solid diamonds represent samples with counts from both rinsates, the open circles represent samples with counts from only one of the rinsates, and the cross represents samples where neither rinsates produced counts. The Spearman rank correlation coefficient, r, and associated P value is given for each plot. ... 18 Figure 8: Comparison of Campylobacter spp. counts from five whole carcass rinsates
rinsates taken from samples from nine different cuts being processed at
Processor A. ... 20 Figure 9: Comparison of Campylobacter spp. counts from five whole carcass rinsates
(CFU/rinsate) with those obtained from five heart, gizzard, neck and liver rinsates taken from samples from 10 different cuts being processed at Processor B. ... 21 Figure 10: Comparison of Campylobacter spp. and E. coli counts from heart, gizzard, neck
and liver rinsates from Processors A and B. Solid diamonds represent rinsates where both Campylobacter spp. and E. coli could be enumerated, open circles where only one bacterial species could be enumerated and a cross represents a rinsate where neither bacterial species could be enumerated. The correlation coefficient, r, and associated P value is given in each plot. ... 23 Figure11: Countsof Campylobacter spp. (Log10 CFU/rinsate) from external liver rinsates
compared to counts from the internal tissues (Log10 CFU/liver). Solid diamonds
represent liver samples with non-zero counts for external and internal sampling, circles representing the livers with no Campylobacter spp. detected from
internal tissue and the cross representing a single liver where no Campylobacter
spp. was detected in either the internal or external sample. ... 25 Figure 12: Campylobacter spp. and E.coli counts (Log10 CFU/rinsate) in whole carcass
rinse samples taken from suspected positive flocks at three different processing plants. First column represents the frequency of not detected (ND) results. ... 32 Figure13: Correlation between sample weight and Campylobacter spp.concentration on
heart, gizzard, neck and liver products. Open diamonds represent products with not detected Campylobacter spp. counts and r is the Spearman rank correlation coefficient... 35
SUMMARY
Campylobacteriosis is the most frequently reported bacterial foodborne illness in New Zealand, and a major route of infection with Campylobacter spp. is contaminated food consumption. The New Zealand Food Safety Authority (NZFSA) introduced a mandatory
Campylobacter performance target (CPT) for poultry processing to reduce the reported incidence of foodborne campylobacteriosis by 50% by 2013.
Information is currently lacking on various high-risk poultry products at the processing plant, including offal (liver, heart, gizzard and neck), which are readily available at retail outlets, and mechanically separated meat (MSM) product.
This project has quantified the concentrations of Campylobacter, generic Escherichia coli, coagulase-positive staphylococci and Aerobic Plate Count (APC) in MSM, and
Campylobacter and generic E. coli contamination on heart, liver, gizzard and neck samples. Samples were collected over the period February to mid-August 2010 from processing lines that were known to be, or anticipated as highly likely to be, positive for Campylobacter. The results are summarised below.
Mechanically separated meat
A total of 145 MSM samples were collected from three different processing plants.
Campylobacter was countable in 87%, 66% and 33% of the three processors’ samples, while coagulase-positive staphylococci were countable in 44%, 2% and 36% of the processors’ samples. These values show that Campylobacter spp. can persist through processing and be detectable in the MSM product, and that coagulase-positive staphylococci can also be present in the MSM product.
The distribution of bacteria varied with the processor. The med ian counts (5th to 95th percentile) for Campylobacter in MSM at the three processors were 1.74 (Not detected (ND) to 3.17) Log10 CFU/g, 1.18 (ND to 2.55) Log10 CFU/g and ND (ND to 2.08) Log10 CFU/g.
The median counts (5th to 95th percentile) for coagulase-positive staphylococci in MSM at the three processors were ND (ND to 3.52) Log10 CFU/g, ND (ND to 1) Log10 CFU/g and
ND (ND to 2.72) Log10 CFU/g.
No significant correlation (P>0.05, r≤ 0.24) was evident between counts of Campylobacter
from the MSM product and either E. coli or APC from the same sample. Similarly, no correlation was observed between coagulase-positive staphylococci and either E. coli or APC.
Heart, liver, gizzard and neck products
Ninety-five samples of heart, liver, gizzard and neck were sampled in total. Campylobacter
was countable in 86% of heart rinsates, 99% of liver rinsates, 97% of gizzard rinsates and 99% of neck rinsates. The distribution of counts on these products differed between the two processors. This could be due to differences in the processing lines. The median (5th to 95th percentile) of the counts were:
Heart: Processor A, 2.5 (ND to 4.7) and Processor B, 3.8 (2.1 to 4.9) Log10 CFU/rinsate.
Liver: Processor A, 3.8 (2.2 to 5.5) and Processor B, 4.5 (3.7 to 5.4) Log10 CFU/rinsate.
Gizzard: Processor A, 3.3 (ND to 4.8) and Processor B, 3.9 (3.0 to 5.0) Log10 CFU/rinsate.
Neck: Processor A, 4.1 (2.2 to 5.0) and Processor B, 4.0 (2.7 to 4.8) Log10 CFU/rinsate.
The whole carcass rinsate results do not provide a consistent indicator of the presence of
Campylobacter spp. on the heart, gizzard, neck and liver samples. There were some sampling days, where Campylobacter spp. were not detectable from the whole carcass rinsates, but were detected at high numbers in the heart, liver, gizzard and neck rinsates. No significant correlation (P ≥ 0.07, r ≤ 0.28) was evident between the Campylobacter and
E. coli counts for the heart, liver and gizzard products. The neck samples taken from one processor show some positive correlation of the counts, with a correlation coefficient of 0.47 (P < 0.05). However, this observation was not repeated for the neck samples from Processor A (P = 0.28, r = -0.16).
Inte rnal and external liver Campylobacter contamination
Forty-five liver samples were taken over the sampling period from a single processor. Of these livers, 22% had Campylobacter spp. only on the surface of the liver, 76% had the bacteria on the surface and in the internal tissues and 2% of the livers had no countable
Campylobacter spp..
The distribution of the estimated count in internal liver tissue had median (5th -95th percentile) of 2.9 (ND to 4.5) Log10 CFU/ whole liver, compared to the counts
obtained from the external liver rinsate; 3.8 (2.2 to 5.5) Log10 CFU/rinsate. A strong
positive correlation was seen between the internal and external presence of Campylobacter
spp. of the liver samples.
Washing the livers at the processors will not remove Campylobacter spp. internally from the organ. Any Campylobacter spp. remaining in the internal tissues of raw livers after chilling or freezing would need to be killed by appropriate cooking practices.
1. INTRODUCTION
Campylobacteriosis is the most frequently reported bacterial foodborne illness in New Zealand and a major route of infection with Campylobacter spp. is contaminated food consumption. Presence of Campylobacter spp. on retail poultry products was reported as early as 1995 by Campbell and Gilbert (1995). This was followed by a landmark case-control study in 1996 when Eberhart-Phillips et al., (1997) implicated broiler meats as the most important vehicle of human infection by Campylobacter spp. in New Zealand. Other retail studies have collectively shown high prevalence of Campylobacter spp. on New Zealand poultry carcasses and products (Wong et al., 2007; Chrystal et al., 2008; French, 2008 and 2009; Wong and Hudson, 2010). A recent attribution study conducted in the Manawatu district of New Zealand has identified poultry meat as a primary exposure pathway of campylobacteriosis (Mullner et al., 2009).
Other useful information on the prevalences and concentrations Campylobacter spp. on New Zealand poultry products at slaughter has been collected via the National Microbiological Database (NMD1), on poultry products during secondary processing (Paulin, 2010) and on other poultry products after primary processing, including duck and turkey carcasses (Wong, 2010) and end-of-lay and breeder poultry carcasses (Wong and Chung, 2010).
The New Zealand Food Safety Authority (NZFSA) has introduced a mandatory
Campylobacter performance target (CPT) for poultry processing in order to reduce the reported incidence of foodborne campylobacteriosis by 50% by 2013 (NZFSA, 2008). Since the introduction of the CPT and as improvements in primary poultry processing have been implemented, the poultry industry has reported a reduction of Campylobacter spp. counts in carcass rinsates at the end of processing (NZFSA, 2008). A significant decrease in the campylobacteriosis rate between 2007 and 2008 (Mantel Haenszel chi-square test, P<0.05) in the human population in New Zealand has also been reported (Anonymous, 2008).
Campylobacter colonises the gastrointestinal tract of poultry. Information is still required about poultry products that have potentially high counts because they are either part of, or can have cross contamination from the gastrointestinal tract. For example offal (liver, heart, gizzard and neck portions) and mechanically separated meats (MSM).
Offal is readily available at retail outlets. MSM is produced regularly from carcass frames following the removal of portions and breast meats from the carcasses. These products are used to manufacture low value chicken nuggets and chicken luncheons.
1 Web site: http://www.foodsafety.govt.nz/industry/general/nmd (Note: Accessibility to some information on
This project has quantified the concentrations of Campylobacter, generic Escherichia coli, coagulase-positive staphylococci and Aerobic Plate Count (APC) in MSM, and
Campylobacter and generic E. coli on heart, liver, gizzard and neck samples. Samples were collected over the period February to mid-August 2010 from flocks that were known to be, or anticipated as highly likely to be, positive for Campylobacter.
2. MATERIALS AND METHODS
Three processors (Processors A, B and C) identified flocks known to be Campylobacter
positive or anticipated as highly likely to be positive (e.g. third or fourth cut) at fortnightly intervals over the course of the sampling period from February until mid-August 2010.
These flocks provided whole carcass and MSM samples. Processors A and B also took heart, liver and gizzard samples from each of five randomly selected birds from the identified flock. Five neck samples were also sampled, but from a different set of five birds.
MSM processing on a day uses the carcasses from multiple flock cuts. Therefore, MSM samples would include MSM produced from carcasses from the identified flock as well as other flocks processed on the same day. Processor B, manufactured MSM on the same day as the cut of birds from the flock was slaughtered, while Processors A and C aged their carcasses overnight in a chiller before manufacturing the MSM the following day.
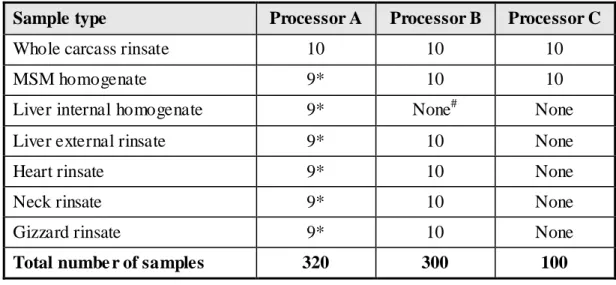
Table 1 shows the number of sets of five samples that were analysed between February and mid-August 2010.
Table 1: Number of sets of five samples from a flock analysed for each sample type and
processor.
Sample type Processor A Processor B Processor C
Whole carcass rinsate 10 10 10
MSM homogenate 9* 10 10
Liver internal homogenate 9* None# None
Liver external rinsate 9* 10 None
Heart rinsate 9* 10 None
Neck rinsate 9* 10 None
Gizzard rinsate 9* 10 None
Total numbe r of samples 320 300 100
*The results from one set of MSM or offal samp les were d isregarded due to temperature conditions outside the NMD specification.
#
2.1.1. Whole Carcass Rinse Sampling
Five carcasses from each of the identified cuts in the poultry flocks at the end of processing were randomly chosen by NMD-approved samplers. The carcasses were rinsed in accordance to NMD protocol2 and the rinsates were tested for Campylobacter spp. and E. coli
either in a processors “in- house” laboratory or a sub-contracted approved commercial laboratory. The results were forwarded to ESR. A summary of the whole carcass rinse results is given in Appendix A.
2.1.2. MSM sampling
Five individual samples of MSM weighing about 50 g were collected by the processors. The first sample was collected about 30 min after the beginning of MSM processing, three samples collected at regular intervals throughout processing, and one sample was collected close to the end of the process run. Samples were separately bagged in sterile Whirlpak bags (BO1297WA, Nasco, Modesto, CA, USA) and stored chilled prior to delivery to the testing laboratory.
All of the samples from Processors A and C were sent via overnight courier to ESR’s Christchurch Science Centre. The MSM samples from Processor B were sent to Asure Quality, Auckland via overnight courier. Each set of samples was transported in a chilly bin containing frozen pads to keep them below 10ºC. A temperature blank comprising a container of water was included in the chilly bin. The temperature of the water in this container equilibrates with the ambient temperature inside the sample container and gives an indication of the sample temperature on delivery. If the water temperature exceeded 10°C, sample temperatures were individually checked and confirmed as being outside specifications using a calibrated infra-red thermometer (RayTek MiniTemp, Santa Cruz, CA USA) before being discarded. Similarly, frozen samples were also discarded. Samples were tested within 24 h of being taken.
2.1.3. Offal Sampling
Five sets of each offal product (heart, liver, gizzard and neck) were collected by Processors A and B. Offal samples were collected at five- minute intervals at a position on the processing line before the spin chiller. The heart, liver and gizzard samples were collected from five individual birds. Due to reasons of impracticality, neck samples were not sampled from the same bird as the other offal samples.
Samples were separately bagged in sterile Whirlpak bags (Nasco) and stored at 4°C prior to overnight courier delivery to the ESR’s Christchurch Science Centre in chilly bins. Shipping conditions were as described above in 2.1.2.
2.2.1. MSM
MSM samples weighing 25 g were placed in a filter stomacher bag to which 225 mL buffered peptone water (BPW, 218105, Becton Dickinson, Sparks, MD, USA) was added. The contents were stomached for 2 min. Two logarithmic dilutions (10-1 and 10-2) were prepared using peptone diluent (0.1% peptone with 0.85% NaCl). Samples (and dilutions) were then plated as described in Table 2.
2.2.2. Offal – hearts, gizzards and necks
Hearts, gizzards and necks were analysed using a rinse method. Prior to testing, gizzards were placed individually on a sterile petri dish, dissected with sterile scalpels and forceps, and the contents removed by peeling away the thick inner lining. Each offal sample was placed individually in a sterile stomacher bag and weighed. For heart, neck and gizzard samples, 100 mL of BPW was added to the bag prior to stomaching for 2 min. The necks were hand massaged for 2 min. Serial dilutions of each rinsa te were prepared as before and plated as described in Table 2.
2.2.3. Offal – livers
The external surface of the liver and the internal liver tissue were analysed using the method of Whyte et al. (2006). Briefly, each liver was placed in a sterile stomacher bag and weighed. A 100 mL volume of BPW was added and the liver was gently shaken for 2 min to re-suspend bacterial cells from the surface. The resulting rinsate was poured into another sterile stomacher bag and two logarithmic dilutions were prepared for the enumeration o f
E. coli and Campylobacter spp. The rinsed liver was removed from the bag and gently placed into boiling water for 15 s using a sterile spoon. The sample was then removed, placed on a sterile petri dish and cut in half using a sterile scalpel. A 10 g portion of internal uncooked tissue was aseptically removed and placed in a filter stomacher bag with 90 mL of BPW. The bag contents were then stomached for 2 min. If <10 g tissue was available, sufficient peptone diluent to make a 1/10 dilution was added. Two logarithmic dilutions were prepared, plated and enumerated for Campylobacter spp. only (Table 2).
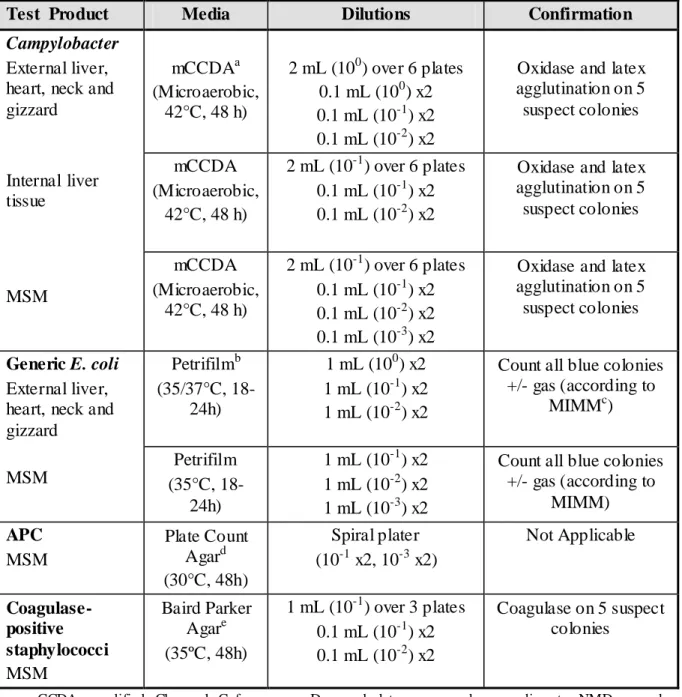
Table 2: Microbiological testing require ments
Test Product Media Dilutions Confirmation
Campylobacter
External liver, heart, neck and gizzard Internal liver tissue MSM mCCDAa (Microaerobic, 42°C, 48 h) 2 mL (100) over 6 plates 0.1 mL (100) x2 0.1 mL (10-1) x2 0.1 mL (10-2) x2
Oxidase and latex agglutination on 5 suspect colonies mCCDA (Microaerobic, 42°C, 48 h) 2 mL (10-1) over 6 plates 0.1 mL (10-1) x2 0.1 mL (10-2) x2
Oxidase and latex agglutination on 5 suspect colonies mCCDA (Microaerobic, 42°C, 48 h) 2 mL (10-1) over 6 plates 0.1 mL (10-1) x2 0.1 mL (10-2) x2 0.1 mL (10-3) x2
Oxidase and latex agglutination on 5 suspect colonies
Generic E. coli External liver, heart, neck and gizzard MSM Petrifilmb (35/37°C, 18-24h) 1 mL (100) x2 1 mL (10-1) x2 1 mL (10-2) x2
Count all blue colonies +/- gas (according to MIMMc) Petrifilm (35°C, 18-24h) 1 mL (10-1) x2 1 mL (10-2) x2 1 mL (10-3) x2
Count all blue colonies +/- gas (according to MIMM) APC MSM Plate Count Agard (30°C, 48h) Spiral plater (10-1 x2, 10-3 x2) Not Applicable Coagulase-positive staphylococci MSM Baird Parker Agare (35ºC, 48h) 1 mL (10-1) over 3 plates 0.1 mL (10-1) x2 0.1 mL (10-2) x2 Coagulase on 5 suspect colonies
a: mCCDA : modified Charcoal Ce foperazone Deso xycholate agar, made according to NMD procedure (http://www.nzfsa.govt.nz/anima lproducts/legislation/notices/an imal-materia l-product/nmd/nmd-09-schedule-1-technical-procedures.pdf).
b: E. coli Petrifilm by 3M (St. Paul, Mn, USA).
c: MIMM, Meat Industry Microbiological Methods (4th Edit ion).
d: Plate Count Agar, med iu m by Merc k (1.05463, Darmstadt, Ge rmany).
e: Ba ird Pa rke r Agar, Base med iu m by Merck (1.05406) supplemented with egg yolk tellurite enrich ment by BBL Benton Dic kinson (212357 Sparks, M D, USA).
Correlation of the bacterial CFU counts was examined graphically and using the Spearman Rank correlation, via the cor.test function in R. The cor.test function calculates the correlation coefficient, r, and provides an estimate of the probability, P, that the correlation between bacterial counts observed in the sample would occur given the null hypothesis that no correlation exists in counts from the product type.
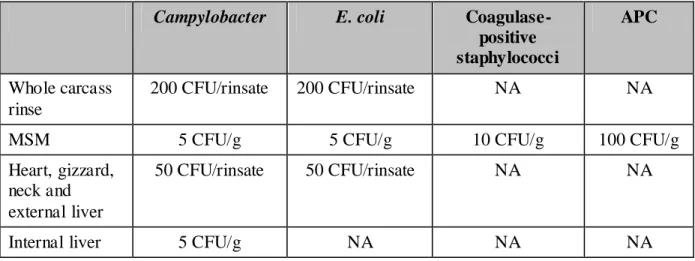
The Spearman Rank method was chosen due to the non-normal nature of most of the count distributions. For correlation plots, the not detected (ND) results were set to half the lowest limit of detection for the sample. The lowest limit of detection for each microorganism or a group of microorganisms from each sample type are given in Table 3.
Table 3: Lowest limit of detection
Campylobacter E. coli
Coagulase-positive staphylococci APC Whole carcass rinse 200 CFU/rinsate 200 CFU/rinsate NA NA
MSM 5 CFU/g 5 CFU/g 10 CFU/g 100 CFU/g
Heart, gizzard, neck and external liver
50 CFU/rinsate 50 CFU/rinsate NA NA
Internal liver 5 CFU/g NA NA NA
The prevalence of Campylobacter spp. detection described in this report should not be taken to reflect the prevalence of contamination in these poultry products produced by these processors at retail. The flocks were specifically chosen to be highly likely to be infected with Campylobacter spp.
The enumeration results indicate the likely concentrations to be found on products from infected poultry during processing. The heart, liver, gizzard and neck samples were taken before the product washing or chilling steps. These treatments are provided for products that are sent to retail outlets. Therefore, these results should not be taken as indicative of the presence of Campylobacter spp. at retail.
3. RESULTS AND DISCUSSION
3.1.1. Campylobacter spp. and coagulase-positive staphylococci counts
Five MSM samples were taken throughout the processing period each sampling day. The samples were tested for Campylobacter spp., coagulase-positive staphylococci, E. coli and APC. Appendix B gives the summary statistics for all the bacterial counts for MSM samples taken from the three processors.
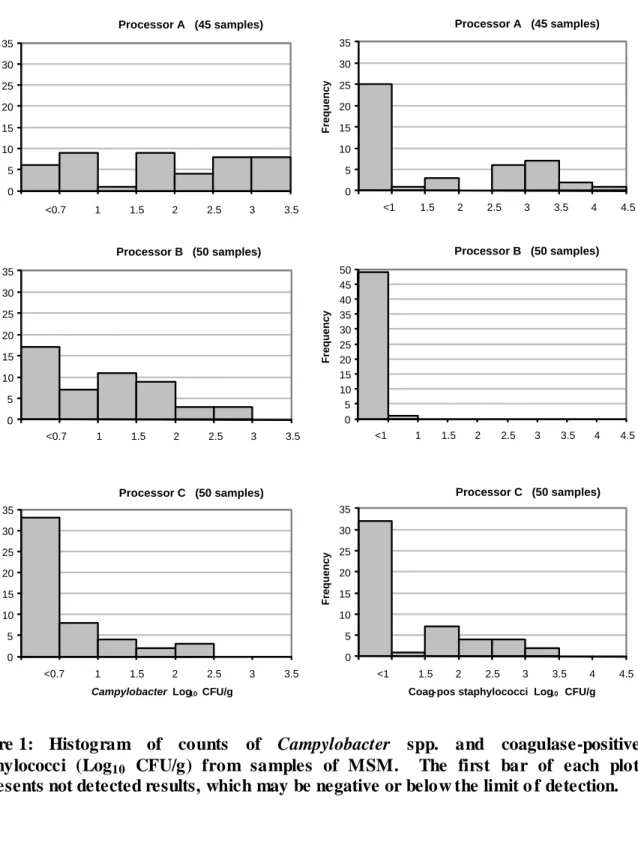
The Campylobacter spp. and coagulase-positive staphylococci counts obtained from the MSM samples from the three processors are presented as a histogram in Figure 1.
Campylobacter spp. was countable in 87% of Processor A samples, 66% of Processor B samples and 33% of Processor C samples. Processor C tended to have lower counts compared with Processors A and B when countable Campylobacter spp. colonies were present. The maximum counts detected in MSM samples from the three processors were 3.27, 2.98 and 2.37 Log10 CFU/g for Processors A, B and C, respectively.
Coagulase-positive staphylococci was countable in 44% of Processor A’s samples, 2% (1 sample) of Processor B samples and 36% of Processor C’s samples. The highest counts were observed in Processor A’s samples, but both processors A and C product had highly variable counts of coagulase-positive staphylococci.
0 5 10 15 20 25 30 35 Frequency Processor A (45 samples) 0 5 10 15 20 25 30 35 Frequency Processor B (50 samples) 0 5 10 15 20 25 30 35
CampylobacterLog10CFU/g
Processor C (50 samples) 0 5 10 15 20 25 30 35 Frequency Processor A (45 samples) 0 5 10 15 20 25 30 35 F re q u e n c y
Coag-pos staphylococci Log10 CFU/g
Processor C (50 samples) 0 5 10 15 20 25 30 35 40 45 50 <1 Processor B (50 samples) <0.7 1 1.5 2 2.5 3 3.5 <0.7 1 1.5 2 2.5 3 3.5 <0.7 1 1.5 2 2.5 3 3.5 F re q u e n c y F re q u e n c y F re q u e n c y F re q u e n c y F re q u e n c y <1 1.5 2 2.5 3 3.5 4 4.5 <1 1.5 2 2.5 3 3.5 4 4.5 1 1.5 2 2.5 3 3.5 4 4.5
Figure 1: Histogram of counts of Campylobacter spp. and coagulase-positive staphylococci (Log10 CFU/g) from samples of MSM. The first bar of each plot
represents not detected results, which may be negative or below the limit o f detection.
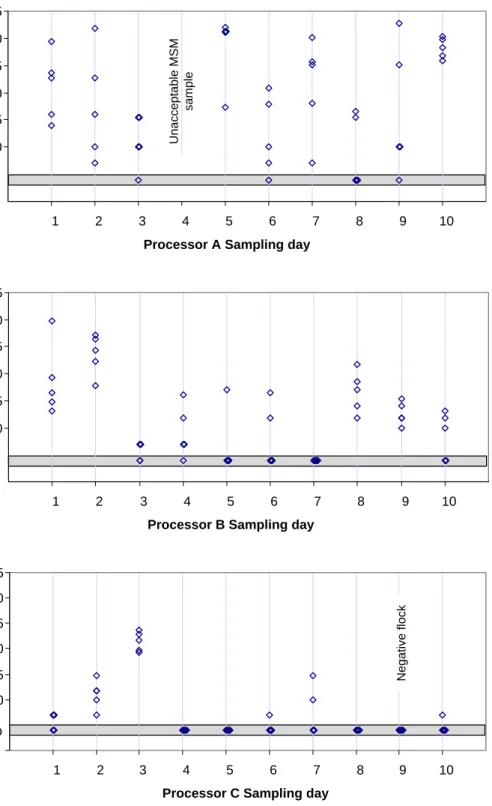
Figure 2 plots the Campylobacter spp. counts from each of the processors on each sampling day. These plots show that the counts of Campylobacter spp. in MSM product can vary throughout the duration of processing on a day. For example, samp ling day 7 at Processor A
produced MSM samples with Campylobacter spp. counts that ranged from
Figure 2: Campylobacter spp. counts from MSM samples taken on each day for the three processors. Not detected results (ND) are plotted in the grey band.
ND U n a c c e p ta b le M S M s a m p le 1.0 1.5 2.0 2.5 3.0 3.5 1 2 3 4 5 6 7 8 9 10
Processor A Sampling day
ND 1.0 1.5 2.0 2.5 3.0 3.5 1 2 3 4 5 6 7 8 9 10
Processor B Sampling day
C a m p y lo b a c te r L o g1 0 C F U /g C a m p y lo b a c te r L o g1 0 C F U /g C a m p y lo b a c te r L o g1 0 C F U /g ND 1.0 1.5 2.0 2.5 3.0 3.5 1 2 3 4 5 6 7 8 9 10
Processor C Sampling day
N e g a ti v e f lo c k
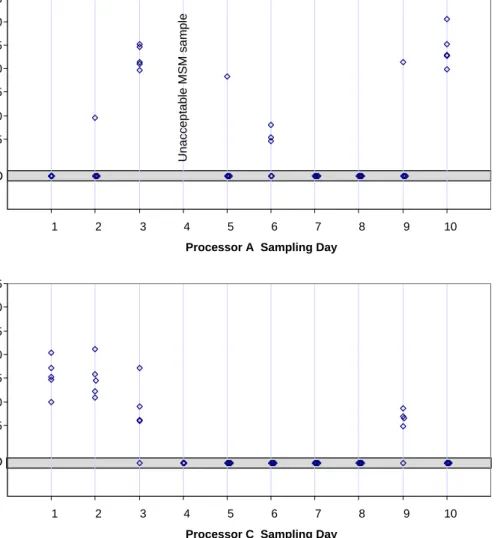
Figure 3 plots the coagulase-positive staphylococci counts from MSM samples taken by Processors A and C on each sampling day. Like the Campylobacter spp. counts, the coagulase-positive staphylococci counts can vary throughout the time the product is processed on a single day.
ND 1.5 2.0 2.5 3.0 3.5 4.0 4.5 1 2 3 4 5 6 7 8 9 10
Processor C Sampling Day
C o a g -p o s s ta p h L o g1 0 C F U /g 1.5 2.0 2.5 3.0 3.5 4.0 4.5 1 2 3 4 5 6 7 8 9 10
Processor A Sampling Day
C o a g -p o s s ta p h L o g1 0 C F U /g ND U n a c c e p ta b le M S M s a m p le
Figure 3: Coagulase-positive staphylococci counts from MSM samples taken on a given sampling day at processors A and C. Not detected (ND) results are plotted in grey band.
The within-day variation in bacterial counts may be due to a combination of inter-carcass variation and the MSM samples coming from different flocks during the processing day, some of which may not have been infected with Campylobacter spp. or coagulase-positive staphylococci.
3.1.2. Comparison of Campylobacter spp. and coagulase-positive staphylococci counts with indicator bacterial counts.
This section evaluates E. coli counts and APC as possible indicators for Campylobacter spp. and coagulase-positive staphylococci levels in MSM. E. coli is an indicator organism for faecal contamination since it is found in high numbers in the faeces of broiler poultry. Likewise, APC is a measurement of mesophilic aerobic organisms that are present on chicken carcasses. Coagulase-positive staphylococci are a subset of the APC organisms. Both the
E. coli and APC groups of organisms are used to measure the performance of dressing processes in a poultry plant.
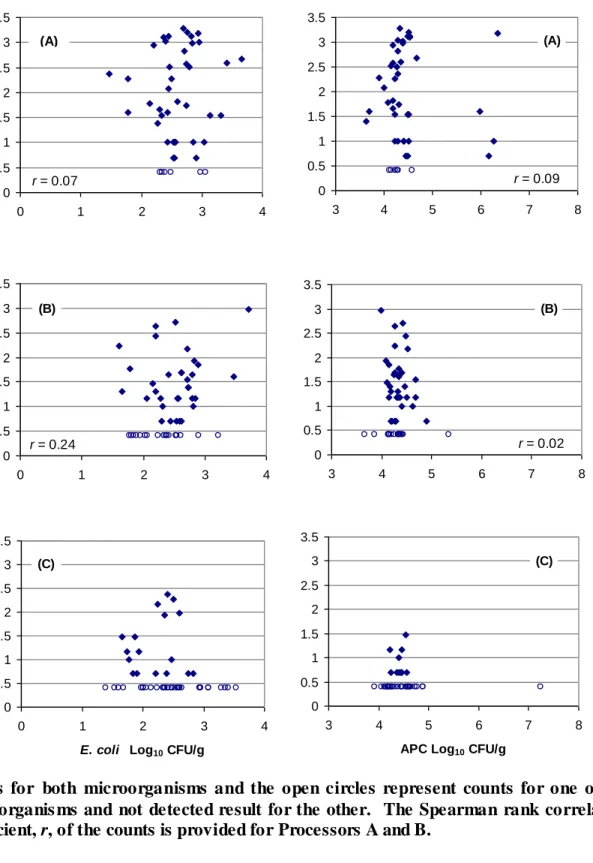
Figure 4 plots the counts obtained from MSM samples for Campylobacter spp. against the counts for E. coli and APC. Each point on the plot represents the results from one MSM sample, or multiple samples which have resulted in the same combination of counts. If the two sets of bacterial counts given on a plot are correlated, the plot will indicate this relationship between the two bacteria. There is no correlation evident from a visual examination of the plots in Figure 4.
Figure 4 also provides the Spearman rank correlation coefficient, r, for the data from
Processors A and B. The correlation coefficient was not calculated for Processor C due to the large number of not detected results. The value of r can range from minus one to one, where a value of zero suggests there is no correlation between the counts of the two bacteria in a plot. The closeness of the r value to one or minus one indicates a greater correlation between the two sets of bacterial counts. A positive correlation implies the counts of one bacteria increase with increasing counts of the other bacteria, and a negative correlation implies the counts of one bacteria decrease as the co unts of the other bacteria increase.
Figure 4: Correlation between Campylobacter spp. and E. coli or Aerobic Plate Count from samples of MSM from three processors; A, B and C. Solid diamonds represent
counts for both microorganisms and the open circles represent counts for one of the microorganis ms and not detected result for the other. The Spearman rank correlation coefficient, r, of the counts is provided for Processors A and B.
E. coli 0 0.5 1 1.5 2 2.5 3 3.5 0 1 2 3 4 C a m p y lo b a c te r L o g10 C F U /g
Aerobic Plate Count
0 0.5 1 1.5 2 2.5 3 3.5 3 4 5 6 7 8 (A) 0 0.5 1 1.5 2 2.5 3 3.5 0 1 2 3 4 C a m p y lo b a c te r L o g10 C F U /g (B) 0 0.5 1 1.5 2 2.5 3 3.5 3 4 5 6 7 8 (B) 0 0.5 1 1.5 2 2.5 3 3.5 0 1 2 3 4
E. coli Log10 CFU/g
C a m py lob a c te r Lo g10 C FU /g (C) 0 0.5 1 1.5 2 2.5 3 3.5 3 4 5 6 7 8
APC Log10 CFU/g
(C)
r = 0.09
r = 0.07
r = 0.24 r = 0.02
The Campylobacter spp. count against APC correlation coefficients in Figure 4 are close to zero, which concurs with the visual inspection of the plots. The correlation coefficients suggest a weak correlation between Campylobacter spp. and E. coli for Processor B, however, the data were not significantly correlated (P=0.09).
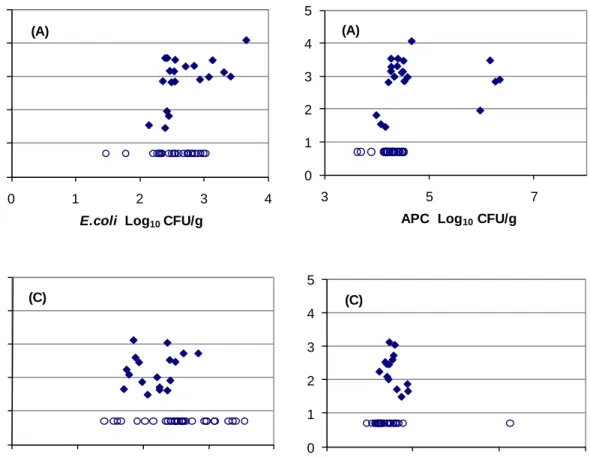
Figure 5 is a plot of coagulase-positive staphylococci counts against E. coli counts or APC from MSM samples from two of the processors, A and C. Processor B was not plotted, as only one sample was positive for coagulase-positive staphylococci. The correlation coefficient was not calculated for correlations between coagulase-positive staphylococci counts and E. coli counts or APC due to the large proportion of ND results observed in MSM samples from all three processors.
There is no correlation between coagulase-positive staphylococci counts and either E. coli or APC when considering all the samples. Over half the data points in these plots relate to ND results for coagulase-positive staphylococci, with the plots showing that higher counts of
E. coli do not necessarily imply the presence of coagulase-positive staphylococci at levels that can be enumerated. This is also seen in the results from Processor B, where the E. coli
results are similar to those of Processors A and C (Figure 4), but the level of coagulase-positive staphylococci in the MSM is very low. Processor A shows a slightly coagulase-positive correlation between E. coli and coagulase-positive staphylococci counts.
0 1 2 3 4 5 0 1 2 3 4 C o a g -p o s s ta p h y lo c o c c i Log 10 C F U /g
E.coli Log10CFU/g
(A) 0 1 2 3 4 5 3 5 7
APC Log10CFU/g
(A) 0 1 2 3 4 5 0 1 2 3 4 C oa g -po s s ta ph y loc oc c i Log 10 C F U /g
E.coli Log10CFU/g
(C) 0 1 2 3 4 5 3 5 7 9
APC Log10CFU/g
(C)
Figure 5: Correlation between coagulase-positive staphylococci counts and E. coli or APC counts from samples of MSM from Processors A and C. Solid diamonds represent counts for both microorganisms and the open circles represent counts for only one of the microorganisms.
3.2.1. Campylobacter spp. contamination of heart, liver, gizzard and neck products before washing
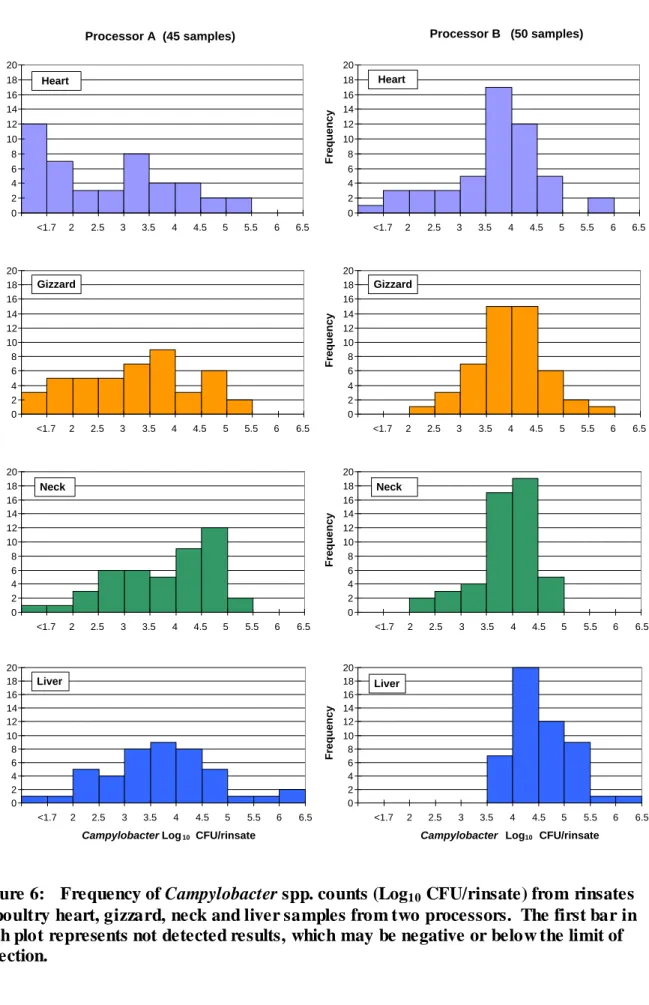
The second half of the project was to test offal products (heart, liver, gizzard and neck) from Processors A and B as these are thought to pose a higher risk of foodborne campylobacteriosis than poultry meat to the customer. Figure 6 shows a histogram of
Campylobacter spp. counts obtained from the rinsates of the four products over the six- month sampling period. The summary statistics for Campylobacter spp. counts on the heart, liver, gizzard and neck are given in Appendix C, Table 7.
Campylobacter spp. was enumerated from most of the rinsates of the heart, liver, gizzard and neck samples from the Processors A and B. For Processor B, only one of the heart rinsates resulted in a ND result and for Processor A, 27% of heart, 7% of gizzard, 2% of liver and 2% of neck rinses resulted in ND results.
Comparison of Campylobacter spp. counts from the 45 offal rinsates obtained from Processor A and the 50 rinsates obtained from Processor B shows an apparent difference in the frequency distribution of the counts (Figure 6). Processor B has a higher proportion of samples yeilding counts of 4 Log10 CFU/rinsate or more.
The mean weight of the heart, neck and liver product samples from Processor B were slightly heavier than the mean weights observed from Processor A (Appendix C; Table 8), which may explain some of the difference between counts observed between the two processors. However, the Campylobacter spp. counts from the rinsates of products of similar weights are highly variable, with up to a 5 Log10 CFU/rinsate difference observed between samples
(Appendix C; Figure 13).
Without further investigation, including knowledge of the relationship between weight and surface area of the offal samples, it is not possible to determine how much of the difference in count frequencies between processors as observed in Figure 6 can be attributed to the difference in sample weights. It is likely that differences in processing equipment also affects the cross contamination of these samples.
Heart 0 2 4 6 8 10 12 14 16 18 20 <1.7 2 2.5 3 3.5 4 4.5 5 5.5 6 6.5 F re q u e n c y Processor B (50 samples) Gizzard 0 2 4 6 8 10 12 14 16 18 20 <1.7 2 2.5 3 3.5 4 4.5 5 5.5 6 6.5 F re q u e n c y Neck 0 2 4 6 8 10 12 14 16 18 20 <1.7 2 2.5 3 3.5 4 4.5 5 5.5 6 6.5 F re q u e n c y Liver 0 2 4 6 8 10 12 14 16 18 20 <1.7 2 2.5 3 3.5 4 4.5 5 5.5 6 6.5
Campylobacter Log10 CFU/rinsate
F re q u e n c y Heart 0 2 4 6 8 10 12 14 16 18 20 F re q u e n c y Processor A (45 samples) Gizzard 0 2 4 6 8 10 12 14 16 18 20 <1.7 2 2.5 3 3.5 4 4.5 5 5.5 6 6.5 F re q u e n c y Neck 0 2 4 6 8 10 12 14 16 18 20 <1.7 2 2.5 3 3.5 4 4.5 5 5.5 6 6.5 F re q u e n c y Liver 0 2 4 6 8 10 12 14 16 18 20 <1.7 2 2.5 3 3.5 4 4.5 5 5.5 6 6.5
Campylobacter Log10 CFU/rinsate
F re q u e n c y <1.7 2 2.5 3 3.5 4 4.5 5 5.5 6 6.5
Figure 6: Frequency of Campylobacter spp. counts (Log10 CFU/rinsate) from rinsates
of poultry heart, gizzard, neck and liver samples from two processors. The first bar in each plot represents not detected results, which may be negative or below the limit of detection.
Processor A (45 samples) Processor B (50 samples) 1 2 3 4 5 6 7 1 2 3 4 5 6 7 G izza rd L o g10 C F U /r in s a te
Heart Log10CFU/rinsate
r= 0.66 P= 10-6 1 2 3 4 5 6 7 1 2 3 4 5 6 7 L iv e r L o g10 C F U /r in s a te
Heart Log10CFU/rinsate
r= 0.75 P= 10-9 1 2 3 4 5 6 7 1 2 3 4 5 6 7 L iv e r L o g10 C F U /r in s a te
Gizzard Log10CFU/rinsate
r= 0.76 P= 10-10 1 2 3 4 5 6 7 1 2 3 4 5 6 7 G izza rd L o g10 C F U /r in s a te
Heart Log10CFU/rinsate
r= 0.39 P= 0.005 1 2 3 4 5 6 7 1 2 3 4 5 6 7 L iv e r L o g10 C F U /r in s a te
Heart Log10CFU/rinsate
r= 0.42 P= 0.002 1 2 3 4 5 6 7 1 2 3 4 5 6 7 L iv e r L o g10 C F U /r in s a te
Gizzard Log10CFU/rinsate
r= 0.35
P= 0.01
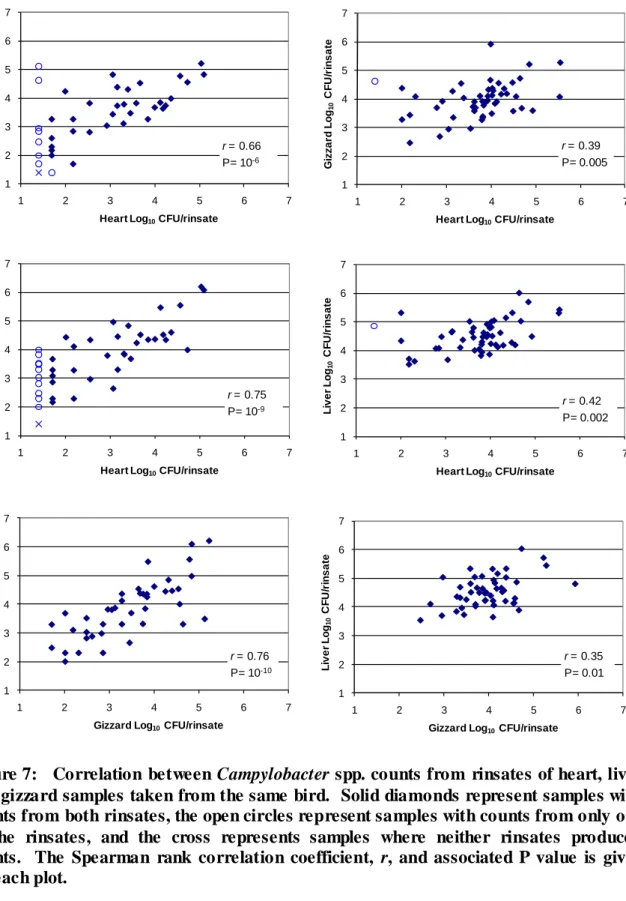
Figure 7: Correlation between Campylobacter spp. counts from rinsates of heart, liver and gizzard samples taken from the same bird. Solid diamonds represent samples with counts from both rinsates, the open circles represent samples with counts from only one of the rinsates, and the cross represents samples where neither rinsates produced counts. The Spearman rank correlation coefficient, r, and associated P value is given for each plot.
Figure 7 shows the correlation between Campylobacter spp. counts in rinsates ofthe heart, liver and gizzard rinsates taken from the same bird. The neck samples are not included in this figure, as neck samples were taken from different birds to the heart, liver and gizzard samples. For Processor A and B there is positive correlation between the three products, with stronger correlation observed in Processor A (r = 0.66 to 0.76, P< 10-5) than Processor B (r = 0.35 to 0.42, P<0.02). However, not detected results for the heart rinsate corresponded to liver rinsate counts in the range ND to 4 Log10 CFU/rinsate and gizzard counts of ND to
5.12 Log10 CFU/rinsate. Therefore, not detected results from heart rinsates are not a good
indicator of the absence of Campylobacter spp. in the liver or gizzard rinsates.
3.2.2. Comparison of Campylobacter spp. counts obtained from heart, liver, gizzard and neck rinsates with those from whole carcass rinsates.
Figure 8 and Figure 9 compare the Campylobacter spp. counts from whole carcass rinsates with those obtained from heart, gizzard, neck and liver rinsates taken from a flock on each sampling day, at processors A and B, respectively. A summary of t he Campylobacter spp. counts from whole carcass rinsates is given in Appendix A. The whole carcass rinsates are obtained from carcasses which have been through a spin chiller, however the offal rinsates are obtained from the offal before the product underwent any washing or chilling.
These figures show variability in the counts of Campylobacter spp. on the five heart, gizzard, neck and liver samples taken from the flocks on each sampling day. Based on these figures, the whole carcass rinsate results do not provide a consistent indicator of the presence of
Campylobacter spp. on the heart, gizzard, neck and liver samples.
For both processors there were sampling days when there were no detected counts from the whole carcass rinsates, but Campylobacter spp. were detected at high counts in the liver, gizzard and neck rinsates. For example, on sampling day 7, Processor A had ND counts for the five whole carcass rinses, while the gizzard rinsate counts ranged from 2.5–4.6 Log10 CFU/rinsate, the neck rinsate counts ranged from 3.0–3.4 Log10 CFU/rinsate and the
liver rinsate counts ranged from 3.0–3.8 Log10 CFU/rinsate. A similar pattern can be seen for
sampling days 1 and 9 at Processor B. However on these occasions, high counts were also observed in the heart rinsate samples.
ND
Whole Carcass and Heart Rinsates
2.0 3.0 4.0 5.0 6.0 2 3 4 5 6 7 8 9 10 C a m p y lo b a c te r L o g1 0 C F U /r in s a te ND
Whole Carcass and Gizzard Rinsates
2.0 3.0 4.0 5.0 6.0 2 3 4 5 6 7 8 9 10 C a m p y lo b a c te r L o g1 0 C F U /r in s a te ND
Whole Carcass and Liver Rinsates
2.0 3.0 4.0 5.0 6.0 2 3 4 5 6 7 8 9 10
Processor A Sampling Day
C a m p y lo b a c te r L o g1 0 C F U /r in s a te ND
Whole Carcass and Neck Rinsates
2.0 3.0 4.0 5.0 6.0 2 3 4 5 6 7 8 9 10 C a m p y lo b a c te r L o g1 0 C F U /r in s a te
Figure 8: Comparison of Campylobacter spp. counts from five whole carcass rinsates (CFU/rinsate) with those obtained from five heart, gizzard, neck and live r rinsates taken from samples from nine diffe rent cuts being processed at Processor A.
ND 2.0 3.0 4.0 5.0 6.0 1 2 3 4 5 6 7 8 9 10
Processor B Sampling Day
C a m p y lo b a c te r L o g1 0 C F U /r in s a te
Whole Carcass and Neck Rinsates
ND 2.0 3.0 4.0 5.0 6.0 1 2 3 4 5 6 7 8 9 10
Whole Carcass and Gizzard Rinsates
ND 2.0 3.0 4.0 5.0 6.0 1 2 3 4 5 6 7 8 9 10 C a m p y lo b a c te r L o g1 0 C F U /r in s a te
Whole Carcass and Heart Rinsates
ND 2.0 3.0 4.0 5.0 6.0 1 2 3 4 5 6 7 8 9 10 C a m p y lo b a c te r L o g1 0 C F U /r in s a te
Whole Carcass and Liver Rinsates
C a m p y lo b a c te r L o g1 0 C F U /r in s a te
Figure 9: Comparison of Campylobacter spp. counts from five whole carcass rinsates (CFU/rinsate) with those obtained from five heart, gizzard, neck and live r rinsates taken from samples from 10 different cuts being processed at Processor B.
3.2.3. Comparison of Campylobacter spp. counts with indicator bacterial E. coli counts in heart, liver, gizzard and neck rinsates.
Figure 10 plots Campylobacter spp. counts against E. coli counts obtained from heart, gizzard, neck and liver sample rinsates. Each point on the plot represents the results from one sample, or multiple samples with identical pairs of counts for Campylobacter spp. and
E. coli.
Little correlation is evident from visual inspection of the plots in Figure 10 or the correlation coefficient values, apart from counts from the neck samples taken from processor B which show some positive correlation (r = 0.47, P = 0.0005). However, this correlation was not seen for the neck samples from Processor A (r = -0.16, P = 0.28).
1 2 3 4 5 6 7 1 2 3 4 5 6 7 C a m p y lo b a c te r Log 10 C F U /r in s a te Heart Processor A r = 0.28 P= 0.07 1 2 3 4 5 6 7 1 2 3 4 5 6 7 C a m p y lo b a c te r Log 10 C F U /r in s a te Gizzard r = 0.17 P= 0.26 1 2 3 4 5 6 7 1 2 3 4 5 6 7 C a m p y lo b a c te r Log 10 C F U /r in s a te Neck r = -0.16 P= 0.28 1 2 3 4 5 6 7 1 2 3 4 5 6 7 C a m p y lo b a c te r Log 10 C F U /r in s a te
E. coliLog10CFU/rinsate
Liver r = 0.15 P= 0.30 1 2 3 4 5 6 7 1 2 3 4 5 6 7 Heart Processor B r= 0.19 P= 0.20 1 2 3 4 5 6 7 1 2 3 4 5 6 7 Gizzard r = 0.16 P= 0.26 1 2 3 4 5 6 7 1 2 3 4 5 6 7 Neck r = 0.47 P= 0.0005 1 2 3 4 5 6 7 1 2 3 4 5 6 7
E. coliLog10CFU/rinsate
Liver
r = 0.11 P= 0.44
Figure 10: Comparison of Campylobacter spp. and E. coli counts from heart, gizzard, neck and liver rinsates from Processors A and B. Solid diamonds represent rinsates whe re both Campylobacter spp. and E. coli could be enumerated, open circles whe re only one bacte rial species could be enume rated and a cross represents a rinsate whe re neither bacterial species could be enume rated. The correlation coefficient, r, and associated P value is given in each plot.
The presence of Campylobacter spp. on/in poultry livers is possible through two different pathways (Barot, 1983):
1. Cross contamination of the external liver surface during poultry processing.
2. Colonisation of Campylobacter spp. outside the gastrointestinal track, via the bile duct.
Some papers have attributed Campylobacter spp. counts obtained from liver samples to be due to cross-contamination of the surface of the livers during processing rather than from
Campylobacter-infected livers (Barot, 1983). However, recent papers by Meade et al.
(2009), Kenar et al. (2009) and previous work at ESR (Whyte et al., 2006) suggest surface contamination by Campylobacter is widespread but internalisation in poultry liver tiss ue is also common.
To further investigate the location of Campylobacter spp. on poultry livers, 45 livers from Processor A were tested externally and internally. Of the 45 livers; one (2%) had ND counts both internally and externally, 10 (22%) had Campylobacter spp. counts in the external rinsates, but ND counts internally, and 34 (76%) had Campylobacter spp. counts from both the external rinsates and internal samples. The Campylobacter spp. counts obtained from the 45 livers are displayed in Figure11.
The counts from the internal liver tissue samples ranged from ND to 5.6 Log10 CFU/liver.
The external rinsate counts ranged from ND to 6.2 Log10 CFU/rinsate. There is a positive
correlation between the Log10 CFU counts from internal and external samples (r = 0.78).
The highest external rinsate count for livers that had ND internal counts was 3.7 Log10 CFU/rinsate. All of the external rinsate counts above 3.7 Log10 CFU/rinsate
corresponded to countable levels of Campylobacter spp. internally. However,
Campylobacter spp. was also countable from internal samples, when the external rinsate contained Campylobacter spp. counts as low as 2.2 Log10 CFU/rinsate.
1 2 3 4 5 6 1 2 3 4 5 6 7
External rinse, Log10 CFU/liver rinsate
Int e rna l, Lo g10 C FU /l iv e r
Figure11: Counts of Campylobacter spp. (Log10 CFU/rinsate) from external liver
rinsates compared to counts from the internal tissues (Log10 CFU/liver). Solid
diamonds represent liver samples with non-zero counts for external and internal sampling, circles representing the livers with no Campylobacter spp. detected from internal tissue and the cross representing a single liver whe re no Campylobacter spp. was detected in either the internal or external sample.
The results obtained in this survey support the theory that livers can become infected with
Campylobacter spp. through internal infiltration of the liver from the gastrointestinal tract prior to slaughter, as well as, external cross-contamination during poultry processing.
These samples were taken before any washes of the liver that would norma lly be performed prior to supplying the product to retail outlets were carried out. Such washes would reduce the surface contamination of the livers with Campylobacter spp. However, any washes at the processors will not reduce the Campylobacter spp. located inside the livers.
4. CONCLUSIONS
The objective of this project was to quantify the concentrations of Campylobacter spp., generic E. coli, coagulase-positive staphylococci and APC in poultry MSM and
Campylobacter spp. and generic E. coli in poultry heart, liver, gizzard and neck samples. Testing of these poultry products produced the following results.
A total of 145 MSM samples were collected from three different processing plants, on days when it was suspected that at least one Campylobacter-positive flock would be contributing to the production of the MSM.
Campylobacter spp. were countable in 87%, 66% and 33% of the three processors’ samples, while coagulase-positive staphylococci were countable in 44%, 2% and 36% of the processors’ samples. MSM on a given day may be made from multiple flocks, not all of which are contaminated with Campylobacter spp. at slaughter. Therefore, these values show that Campylobacter spp. can persist through processing to conta minate MSM products and that coagulase-positive staphylococci can also be found in MSM products.
The distribution of Campylobacter spp. in MSM also varied with the processor. The median (5th to 95th percentile) counts for Campylobacter spp. in MSM at the three processors were 1.74 (ND to 3.17) Log10 CFU/g, 1.18 (ND to 2.55) Log10 CFU/g and ND (ND to 2.08)
Log10 CFU/g.
The median (5th to 95th percentile) counts for coagulase-positive staphylococci in MSM at the three processors were ND (ND to 3.52) Log10 CFU/g, ND (ND to 1) Log10 CFU/g and
ND (ND to 2.72) Log10 CFU/g.
No significant correlation (P > 0.05 and r ≤ 0.24) was evident between Campylobacter spp. counts from MSM and either E. coli counts or APC from the same sample. Similarly, no correlation was observed between coagulase-positive staphylococci and either E. coli or APC by visual inspection of Figure 5.
A total of 95 samples of heart, liver, gizzard and neck were analysed. Samples were taken from two processors from flocks that were positive for Campylobacter spp. Sample rinses were used to detect Campylobacter spp. on the products.
Campylobacter spp. was countable in 86% of heart rinsates, 99% of liver rinsates, 97% of gizzard rinsates and 99% of neck rinsates. The distribution of counts on these products differed between the two processors. This could be due to differences in the processing lines as well as differences in offal size. The median (5th to 95th percentile) of the counts were:
Heart: Processor A, 2.5 (ND to 4.7) and Processor B, 3.8 (2.1 to 4.9) Log10 CFU/rinsate.
Liver: Processor A, 3.8 (2.2 to 5.5) and Processor B, 4.5 (3.7 to 5.4) Log10 CFU/rinsate.
Gizzard: Processor A, 3.3 (ND to 4.8) and Processor B, 3.9 (3.0 to 5.0) Log10
CFU/rinsate.
Neck: Processor A, 4.1 (2.2 to 5.0) and Processor B, 4.0 (2.7 to 4.8) Log10 CFU/rinsate.
Results from whole carcass rinsates did not provide a consistent indicator of the presence of
Campylobacter spp. on the heart, gizzard, neck and liver samples. There were sampling days when there were no detectable counts from the whole carcass rinsates, but Campylobacter
spp. were detected at high counts in the heart, liver, gizzard and neck rinsates
No significant correlation (P ≥ 0.07, r ≤ 0.28) was evident between the Campylobacter spp. and E. coli counts for the heart, liver and gizzard products. The neck samples taken from processor B showed some positive correlation of the counts with a correlation coefficient of 0.47 (P < 0.05). However, this observation was not seen in the neck samples from Processor A (P = 0.28, r = -0.16).
Forty-five liver samples were taken over the sampling period from a single processor. Of these livers, 22% was positive for Campylobacter spp. only on the surface of the liver, 76% was positive on the liver surface and in the internal tissues and 2% had no countable
Campylobacter spp..
The distribution of the estimated count in internal liver tissue had a median (5th to 95th percentile) of 2.9 (ND to 4.5) Log10 CFU/whole liver, compared to the counts
proportion of samples showing internal contamination of the liver suggests that it is common for Campylobacter spp. to colonise the liver in infected birds before slaughter. A strong positive correlation was seen between the internal and external presence of Campylobacter
spp. of the liver samples (r=0.78).
Washing of livers at the processors will not remove internal contamination. Campylobacter
spp. in the internal tissues of raw livers following any chilling or freezing processes would need to be killed by cooking practices that could sufficiently heat the centre of the liver, as advocated by Whyte et al. (2006).
5. REFERENCES
Anonymous (2008). Annual New Zealand Notifiable Disease Report 2008. Available at: http://www.surv.esr.cri.nz/PDF_surveillance/AnnualRpt/AnnualS urv/2008AnnualSurvR ptTables.pdf (last accessed on the 19 February 2010).
Barot, M.S., Mosenthal, A.C. and Bokkenheuser, V.D. (1983). Location of Campylobacter jejuni in infected livers. Journal of Clinical Microbiology, May: 921-922.
Campbell, K.W. and Gilbert, S. (1995). National Food Project – Poultry Quality Assessment. Public Health Commission Report, February 1995. Ministry of Health, Wellington, New Zealand..
Chrystal, N.D., Hargraves, S.J., Boa, A.C., and Ironside, C.J. (2008). Counts of
Campylobacter spp. and prevalence of Salmonella associated with New Zealand broiler carcasses. Journal of Food Protection 71(12), 2526-2532.
Eberhardt-Phillips, J., Walker, N., Garrett, N., Bell, D., Sinclair, D., Rainger, W. and Bates, M. (1997). Campylobacteriosis in New Zealand: results of a case-control study. Journal of Epidemiology and Communicable Health 51:686-691.
French, N. (2008). Enhancing surveillance of potentially foodborne enteric diseases in New
Zealand: Human campylobacteriosis in the Manawatu. Available from:
http://www.foodsafety.govt.nz/elibrary/industry/enhancing-surveillance-potentially-research-projects-2/Campy_Attribution_Manawatu.pdf Hopkirk Institute, Massey University, NZ.
French, N. (2009). Enhancing surveillance of potentially foodborne enteric diseases in New Zealand: Human campylobacteriosis in the Manawatu: Project extension incorporating
additional poultry sources. Available from :
http://www.foodsafety.govt.nz/elibrary/industry/enhancing-surveillance-potentially-research-projects/finalreportducketc2009.pdf. Hopkirk Institute, Massey University, NZ. ICMSF (1998). Micro-organisms in food 6, microbial ecology of food commodities. ISBN:
0751404306, Blackie Academic and Professional: 102.
Kenar, B. Akkaya, L. and Birdane, Y.O. (2009). Prevalence of thermotolerant
Campylobacter in chicken livers in Turkey and antimicrobial resistance amoung the
Campylobacter strain. Journal of Animal and Veterinary Advances 8 (5): 853-856. Meade, G.M., Narciandi, F., Cahalane, S., Reiman, C., Allan, B. and O'Farrelly, C. (2009).
Comparative in vivo infection models yield insights on early host immune response to
Mullner P., Spencer S.E, Wilson, D.J, Jones, G., Noble, A.D, Midwinter, A.C, Collins-Emerson, J.M, Carter, P., Hathaway, S. and French, N.P. (2009). Assigning the source of human campylobacteriosis in New Zealand: a comparative genetic and epidemiological approach. Infect Genet Evol; 9: 1311-9.
NZFSA. (2008). New Zealand Food Safety Authority Campylobacter Risk Management Strategy 2008-2011. Available from: http://www.foodsafety.govt.nz/elibrary/industry /Campylobacter_Risk-Comprehensive_Aimed.pdf. (Last accessed on 15 February 2011). Paulin, S. (2010). Longitudinal Carcass Mapping. Client report FW09103 to the New
Zealand Food Safety Authority, Wellington, New Zealand.
Whyte R, Hudson J A and Graham C (2006) Campylobacter in chicken livers and their destruction by pan frying. Letters in Applied Microbiology; 43: 591-595.
Wong T L, Hollis L, Cornelius A, Nicol C, Cook R C and Hudson J A (2007) Prevalence, numbers, and subtypes of Campylobacter jejuni and Campylobacter coli in uncooked retail meat samples. Journal of Food Protection; 70: 566-573.
Wong, T.L. (2010). Enumeration of Campylobacter spp. from turkey and duck carcasses in New Zealand. Client report FW09108 to the New Zealand Food Safety Authority, Wellington, New Zealand.
Wong, T.L. and Hudson, A.J. (2010). Campylobacter spp. in uncooked retail chicken meats: the 2009 survey. Client report FW10009 to the New Zealand Food Safety Authority, Wellington, New Zealand. (Draft report subject to NZFSA approval).
Wong , T.L. and Chung, P. (2010). Campylobacter and Salmonella from end-of lay and breeder poultry carcasses in New Zealand. Client report FW10068 to the New Zealand Food Safety Authority, Wellington, New Zealand.
APPENDIX A: WHOLE CARCASS RINSATE
Whole carcasses where taken at the NMD testing point and rinsed according to NMD protocol. The concentrations of Campylobacter spp. and E. coli in the rinsate is summarised in Table 4, Table 5 and Figure 12.
Table 4: Summary statistics for Campylobacter spp. in whole carcass rins ates taken from the
three processors.
Processor
A B C
Number of samples 50 50 50
Number of NDa (%) 16 (32%) 25 (50%) 38 (76%)
5th percentile (Log10 CFU/rinsate) ND a
ND ND
25th percentile (Log10 CFU/rinsate) ND ND ND
Median (Log10 CFU/rinsate) 2.90 ND-2.3
b
ND
75th percentile (Log10 CFU/rinsate) 3.46 2.6 ND
95th percentile (Log10 CFU/rinsate) 4.07 4.26 3.31
Maximum (Log10 CFU/rinsate) 4.64 5.00 4.49
a ND: Counts were recorded as <200 CFU/carcass and recorded as “Not Detected” in NM D protocol.
b The median value lies between a ND result and 2.3 Log10 CFU/rinsate.
Table 5: Summary statistics for E. coli in whole carcass rinse samples taken from the three processors.
Processor
A B C
Number of samples 40 50 50
Number of ND (%) 7 (18% ) 11 (22%) 0 (0%)
5th percentile (Log10 CFU/rinsate) ND ND 3.38
25th percentile (Log10 CFU/rinsate) 2.60 2.90 3.68
Median (Log10 CFU/rinsate) 3.51 3.48 4.06
75th percentile (Log10 CFU/rinsate) 4.04 4.26 4.45
95th percentile (Log10 CFU/rinsate) 5.12 5.14 4.79