1
Emission Trading and Carbon Market Performance in Shenzhen, China
Cong Ren
• Department of Geography, University of Hong Kong
Alex Y Lo*
• Department of Geography, University of Hong Kong
• HKU Shenzhen Institute of Research and Innovation, University of Hong Kong
* Correspondence author
Postal address: Room 1030, 10/F, The Jockey Club Tower, University of Hong Kong, Pokfulam Road, Hong Kong
2 Abstract
China has developed its own domestic carbon markets by setting up emission trading schemes. This study addresses concerns about the functioning of these schemes and the financial performance of the Chinese carbon market. It aims to assess an actual outcome of this policy intervention, i.e. trading records, which were used in our analysis to examine a key financial property of the allowance-based market in Shenzhen. In a mature market, assets that incur higher risks are likely to yield higher returns, i.e. a positive relationship. To examine this property, we solicited historical data on the price and trading volume of emission allowances. We statistically estimated the degree of volatility in the Shenzhen market and its relationship with expected return premium. We found that the rate of return was negatively associated with expected risk. This stands at odds with the usual expectation in the financial market and the prediction of asset pricing theory. Also, kurtosis in trading volume was excessively high and its fluctuations were highly concentrated. We discuss these findings in terms of market liquidity and information uncertainties, and offer some policy recommendations. More regulatory attention and economic fixes are needed to improve market efficiency and eliminate sources of market distortions.
Keywords: emission trading, carbon market, allowance price, climate change, GARCH, China
3
1. Introduction
According to the International Energy Agency [1], carbon emissions from fuel combustion rose from 26,177Mt in 2004 to 32,190Mt in 2013 (up 23%). To keep global temperature change below 2 °C relative to pre-industrial levels, substantial cuts in these emissions are required, i.e. globally 40 to 70 per cent lower in 2050 than in 2010 [2]. The People’s Republic of China is the largest carbon emitter, contributing to 28 per cent of the world’s total in 2013 [1].
New policy instruments are being introduced in China to strengthen its efforts on greenhouse gas (GHG) mitigation. The past ten years have seen its climate policy preference shifting from the conventional ‘command-and-control’ approach towards a market-based one [3-10]. The recent arrival of emission trading schemes (ETS) in seven provinces and municipalities of China marked a watershed in the history of Chinese climate policy [11, 12].
Emission trading involves a regulatory body setting an aggregate limit on the level of the regulated emissions, such as GHGs, and issuing permissions to pollute up to that limit. Entities covered by an ETS must hold enough emission allowances for the amount of the emissions they produce. These allowances represent a cost of production and can be exchanged among entities, and therefore have market value. Those entities who can reduce emissions at lower costs sell excess allowances, whereas those who find it more costly to reduce pollution buy allowances. The
4
trading of allowances effectively creates a market institution, commonly known as ‘carbon market’.
Seventeen ETSs are operating in various national or subnational jurisdictions, covering about 8 per cent of annual global GHG emissions (as of August 2015)[13]. The implementation of ETSs by China is regarded as a decisive move towards effective GHG mitigation with global impacts. The seven pilot ETSs in China combined form the world’s second largest carbon market, after the European Union (EU) ETS. Indicative estimates provided by World Bank [13, p.9] suggest that global GHG emissions covered by carbon pricing initiatives will almost double if a national ETS is implemented in China. However, concern and discussion have been raised within China about the shortcomings and timing of nationwide emission trading [14-18].
The use of market-based instruments for controlling GHG emissions is a rather novel attempt in China, which is far from a mature market economy [4, 6, 7, 9, 19-21]. Liu, Chen [21] have noted that, for example, China’s financial sector has experienced systematic distortions due to excessive state intervention in the market, dominance of state-owned enterprises, and official state control over utility prices. The domestic carbon market in China, predicated upon the pilot ETSs, has reproduced these limitations [18], leading to low market liquidity and efficiency [12, 14, 22]. These alarming realities might result in poor performance or even the collapse of the Chinese national ETS that is scheduled to commence in or shortly
5
after 2017. Such a possible outcome would pose financial risks to the international carbon market in which China is likely to become a key player and consequently impede global efforts on GHG mitigation. New research is needed to build an empirical basis for understanding and evaluating this major policy intervention in China.
The present research sought further evidence on the functioning of Chinese ETSs, focusing on financial performance. Many studies have addressed their regulatory and management aspects, and come to the conclusion that the pilot designs meet with many challenges [9, 21, 23]. Only a handful of them, however, have explored the market outcomes of this policy intervention. In fact, few developing countries, namely China and Kazakhstan, have established their own carbon market that is built upon domestic legislation and designated to achieve domestic policy goals, due to their hitherto low capacity and motivation to create one. This results in a lack of knowledge about the performance of carbon markets in these countries.
According to the International Carbon Action Partnership [24], a growing number of developing economies, including Brazil, Chile, Mexico, Thailand, Vietnam, have expressed an interest in setting up a sectoral cap-and-trade system for pricing carbon. Our study can help identify the potential weaknesses of these emerging carbon markets from a financial perspective. Lessons from China can make significant contributions to the scholarly debates about these new developments,
6
given that it is currently the only developing economy having established a domestic ETS (the Kazakhstan ETS is temporarily suspended) [24].
The present research offers new insights by studying an actual outcome (i.e. market transactions) and examining a key financial property of a sub-national carbon market in China. Our objective was to estimate the degree of volatility in this market andits relationship with expected return premium, which can reflect the efficiency of a financial market [25, 26]. Trading records provide a statistical basis for assessing the financial maturity of markets. We solicited data on the price and trading volume of emission allowances traded under a pilot ETS since 2013.
Shenzhen, a megacity in South China, was selected as a case study because of its representativeness. The Shenzhen ETS is the first centrally approved scheme launched in China with the most extensive records on allowance price. Moreover, Shenzhen ETS is the first one in China granted a formal legislative basis [21], and regarded as more market-oriented, active, and properly designed than the other six sub-national carbon markets in China [27, p.19 and p.54]. Therefore, the Shenzhen ETS could act as a role model and offer lessons for other mandatory ETSs in the pipeline. Our inquiry can shed lights on the performance of this carbon market, through which to inform the ongoing debates as to what need to be addressed in order to overcome its imperfections as China and other developing economies pursue their carbon pricing initiatives.
7
We begin by providing an overview of the economic context in which the Chinese ETSs are situated and a brief description of Shenzhen City. The section that follows explains our main hypothesis and describes how data were collected. The novelty of this research lies in the use of an established econometric technique, known as ‘generalized autoregressive conditional heteroscedasticity’ (GARCH) model, for analysing Chinese carbon price data. To the best of our knowledge, this is the first attempt to systematically examine these data using GARCH model and compare with the European experiences on this basis. After describing the data collection approach, we provide details about this technique. Results are then presented, and their implications are discussed in the last two sections.
2. Background
2.1 Recent financial market events in China
Emission trading has enabled the financial market to put a price on the right to emit GHGs into the atmosphere [28, 29]. The financial market in China began to flourish in the early 1980s, following a progressive policy direction that aimed to ‘reform and open-up’ the obsolete planned economy. Over-the-counter and negotiated deals dominated this market in the first few years. The secondary market was made active in the early 1990s by the Shanghai Stock Exchange [30] and Shenzhen Stock Exchange (SZSE) established in 19 December 1990 and 3 July 1991, respectively [31].
8
The stock markets are currently managed by the China Securities Regulatory Commission (CSRC).
The past three decades of financial market management and regulation have proven to be a steep learning curve. The Chinese stock markets in the present day continue to demonstrate many imperfections, including irrational behaviors of individual investors, poorly designed trading mechanisms, ineffective regulations, and flawed policy designs [32]. The combinations of these weaknesses have led to financial breakdowns, the latest one being the stock market crashes in 2015 and 2016. In 12 June 2015, the SSE Composite Index reached its peak at 5,178 points, but dramatically fell to a record low at 3,373 points in 9 July, i.e. down 35 per cent within one month. During this period, the Growth Enterprise index saw a sharp decline of 43 percent, moving downwards from 4,037 points to 2,304 points. Before mid-September 2015, more than 1,000 stocks experienced a limit-down for 16 times [33]. Individual investors lost confidence and the market ran into a chaos. Many stocks suffered from liquidity issue and could not be sold [34, 35]. Managing the massive volatility of financial market has become a pressing issue for Chinese regulators and policymakers.
The most devastating financial policy failure in recent years is related to the ‘Circuit Breaker Mechanism’ (CBM) introduced by the CSRC. The circuit breaker halts trading if the ‘Shanghai Shenzhen CSI 300 Index’ drops by a prescribed number of points for a prescribed amount of time. The CBM took effect from 4 January 2016.
9
On its very first day of operation, the Shanghai stock market was put under enormous pressure of short selling and the SSE Composite Index quickly went downwards. In the afternoon (1pm), the index fell by 5 per cent and 7 per cent in about 20 minutes, triggering the first two levels of breaker. The market was forced to a temporary closure, and transactions in SSE, SZSE, and China Financial Futures Exchange were suspended in the rest of the day. During the first four business days of the 2016 New Year, more than 1,000 stocks in the A-stock market experienced a limit-down. The Shanghai and Shenzhen stock markets shrunk by 7.41 trillion yuan (approx. USD1.13 trillion), and investors lost about 110,000 yuan on average (approx. USD16,796) [36]. The CSRC decided to suspend the CBM in the evening of 7 January 2016, after only four days of operation. The striking event broke two records in China’s financial history: the shortest duration of transaction in one day and the shortest duration of a major financial policy intervention [37].
Although the CBM did not contribute to these market crashes, it has demonstrated the failure of Chinese authorities in stabilizing the fast-growing financial market and operating new regulatory mechanisms. The problems associated with the Chinese financial market raise concern about the functioning of the burgeoning carbon market in China, which resembles the stock market in many aspects [38]. Shenzhen, which is home to a major domestic stock market and has experienced market crashes at different times, was designated to run the first carbon ETS in China.
10
2.2 Shenzhen City and its ETS
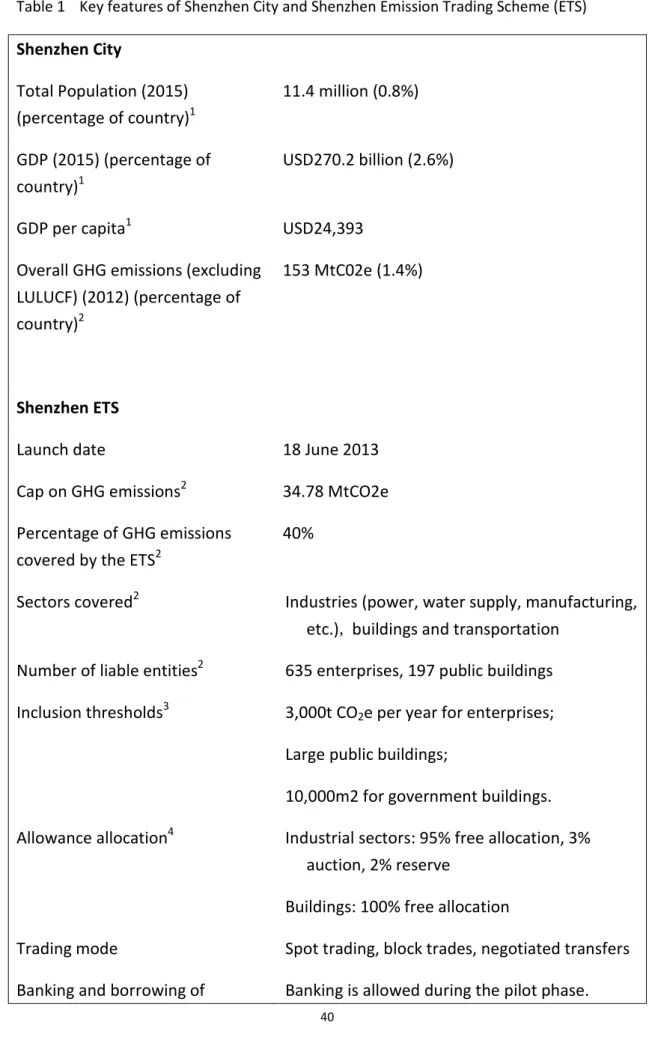
In 2011, the Chinese central government formally appointed two provinces (Guangdong and Hubei) and five municipalities (Beijing, Shanghai, Tianjin, Chongqing, and Shenzhen) to run trial ETSs. Shenzhen City is different from the other six jurisdictions as it is the only one not being directly administered by the central government, but by the Guangdong Provincial Government. Located in the Pearl River Delta and adjacent to Hong Kong, Shenzhen is a highly urbanized and industrialized megacity with a total population of over 11.4 million in 2015 and a per capita GDP of USD24,393 in 2015 (Table 1). It was the first designated Special Economic Zone of China granted by the central government a number of administrative and economic privileges, and is a major regional manufacturing center with a prospering tertiary sector. Despite the declining share of emission-intensive manufacturing sector, Shenzhen has recorded a relatively high level of GHG emissions, i.e. 153 MtCO2e in 2012, or 1.4 per cent of China’s total,
while its population only accounts for 0.8 per cent of the total.
Shenzhen officially launched its ETS in June 2013, meaning that the system for regulation and trading was set up within less than two years after the central government offering political mandate to the pilot ETSs in October 2011. The Shenzhen ETS was granted a legislative basis by the Standing Committee of
11
Shenzhen Municipal People’s Congress through an authoritative policy document ‘Provisions of Carbon Emissions Management of the Shenzhen Special Economic Zone’, which was released in October 2012 [39]. The city’s administration, formally known as Shenzhen Municipal People’s Government, made public the operational requirements and rules of the ETS by issuing the ‘Shenzhen Provisional Regulation on Pilot Carbon Emissions Trading’ in March 2014 – nine months after the ETS came into force [40].
3. Research problems to address
3.1 Overview of current knowledge
There has been a well-established knowledge base about the implementation of ETSs in developed economies [41-43]. However, those schemes established by developing economies through domestic legislation remain poorly understood. Among these economies, China is currently the only one that can offer lessons for others in similar situations. Yet, most of the existing studies about Chinese ETSs are limited to their regulatory and management aspects.
Since the seven Chinese ETSs began operation in 2013 and 2014, many local scholars have raised question about the fundamental issues affecting their functioning. Mao et al. and Zhao et al., for example, are concerned about access to GHG emissions data and contend that the data management system in China is far
12
from complete and consistent [14, 23]. Few regulated entities have complete records on their GHG emissions [16, 21]. The limited availability and poor quality of emissions data render the setting of emissions caps arbitrary and disputable. As Munning et al. have indicated, the lack of understanding of business-as-usual emissions has increased the difficulties for regulators and firms to know whether the cap will bind or to predict future allowance prices [22]. Parties involved in allowance trading find no solid information basis for making investment and hedging risks against adverse changes in market conditions.
Another key issue that has attracted criticisms by local scholars is the lack of a robust regulatory system [12, 17, 18, 21]. Allowance-based carbon markets are regulation-driven. Legislation is imperative to establishing the legal status of emission permits or allowances. Enforcement and punishment are required in the event of non-compliance or misconduct, where permits are not surrendered as stipulated, prescribed trading rules are violated, or data reporting is found to be misleading. China’s regulatory infrastructure for CO2 emission trading is far from
complete. There are considerable challenges in setting up a consistent and transparent monitoring, reporting and verification system in China [22, 23], where legal enforcement is constantly a problem confronting all levels of the society. Currently, there are no national regulations specifically for emission trading, and the on-going ETS programme proceeds as an administrative operation [18, 21].
13
Some empirical studies have shown that the lack of a robust regulatory system has discouraged business participation. For instance, Zhao et al. find that regulated enterprises are “unaware of operation rules and running process of carbon market” [14, p. 1241]. Even they are aware of these, many of them tend to believe that local governments are not serious about enforcing compliance [4]. Shen echoes this comment by suggesting that some of the big and powerful enterprises could find ways for evading penalties for their excess GHG emissions and failure to surrender allowances, particularly at the local level [19]. Although many new regulatory measures have been introduced over the last two years [12, 16], their impacts on business participation and investors’ confidence are yet to be seen.
A possible outcome of these weaknesses in market regulation and management is the poor performance of the carbon market in delivering economic efficiency. In particular, abnormal changes in allowance price are regarded as an indication of the failure of market to function efficiently as economic theory predicts. Many studies have attempted to identify these changes by modelling emission permits price, and they can be divided into three approaches according to their analytical focus.
Some researchers focus on the price determinants of allowances in the EU ETS or other mature carbon markets [44-50]. They found that there are long-run relationships between emission allowance prices and external factors, such as weather, energy prices and economic shocks, but the presence of these relationships varies by sample and time, requiring longer-term market data to forecast. Since the
14
Shenzhen ETS has a relatively short history of operation (three years), this pricing model does not fit our study. Some other researchers put their emphasis on identifying the interactive impacts between carbon spot price and futures price [51, 52]. However, this approach is not feasible for our analysis because futures are currently not available for trading in Chinese carbon markets.
The third approach involves the use of different econometrics techniques to test the short-term behaviours of allowance spot prices [53-59]. The GARCH model was advocated by Benz and Trück [54] and experimented by themselves and other scholars [53, 55, 58], and all of these researchers have reported statistically satisfactory results in capturing the price volatility in the international carbon markets. Very few studies have explored the financial aspects of a Chinese ETS. Our inquiry searched for such market abnormalities by processing the GARCH model to examine the three-year spot price behaviour of Shenzhen ETS CO2 allowance, and
attempted to assess an actual outcome of this policy intervention from a financial perspective.
3.2 Research hypothesis
This empirical study aimed at investigating the functioning of a carbon market by examining price behaviour. The analysis is based on the autoregressive moving average (ARMA)-GARCH-M model (described below), which is commonly used for
15
assessing the returns of financial products, especially stock returns, and their volatility, which is taken as a measure of risk [25, 60, 61]. In economics, emission allowances are understood as a form of property rights and assets that display certain financial properties when they are exchanged in markets [54, 62, 63]. One of the key properties is a broadly symmetric relationship between expected risk and asset return [26, 64]. As the variance of asset returns can be used to explain expected risk [65], the coefficient between returns and the conditional variance of returns can describe risk premium. In an efficient stock market, perceived risk of investment would run parallel to expected gains; thus risk premium is a function of expected risks, i.e. the parameter of risk premium should be positive. Most applications of GARCH-M model find that transactions in a properly functioning stock market demonstrate a positive correlation between these two elements, namely, yield and its conditional variance [25, 66, 67].
Our assumption about the Shenzhen ETS was that the trade prices of emission allowance should demonstrate this financial property. This is because an ETS creates a market institution, typically resembling a stock market. Shenzhen was chosen for the case study as its ‘cap-and-trade’ scheme is regarded as better than the other six Chinese ETSs, because it is more market-oriented, active, and properly designed, has acquired a more solid legal basis, and has the longest history (i.e. experience) of operation. Our hypothesis is that expected returns in Shenzhen’s allowance-based market positively correlate with its volatility. Evidence for the otherwise case would
16
suggest that this market remains immature on this dimension and therefore requires regulatory attention and economic fixes.
4. Methods
4.1 Data collection
The data used in the analysis were the daily records on allowance price and trading volume. They were collected from the official website of the Shenzhen Emissions Exchange (SEE) (www.cerx.cn), where emission allowances issued by the Shenzhen ETS are traded. Records for the three full compliance years of Shenzhen ETS i.e. 2013 - 2015 from the first day of ETS operation (18 June 2013) to the end of 2015 compliance year (30 June 2016) There were 705 valid trading days during this three-year period.
The sample included the daily average prices of three main types of emission allowances available for trading in the SEE (namely, SZA 2013, SZA 2014, and SZA 2015). The daily average price is calculated by dividing the total trading turnover by the total trading volume in a particular day. Closing price was not included in the analysis, because the relatively small number of daily transactions makes them poorly representative. The statistical models for analyzing the daily records on average price and trading volume over past three years are specified in the next sub-section.
17
4.2 Statistical modelling
A time series { 𝑦𝑡 } could be presented by the following equation [68]:
𝑦𝑡= 𝑎0+𝑎𝑦𝑡−1+𝜀𝑡, ... (1)
In equation (1), the variances of stochastic error terms{ 𝜀𝑡 } are not a constant but a function depending on time, which is the ℎ𝑡 below. The variance of error terms would be severely undervalued if heteroscedasticity is ignored, which would result in errors in the significance tests of parameters and render all tests ineffective. These problems would significantly affect the fitting results of simulation. To solve the problem of heteroscedasticity, Engle [69] created the autoregressive conditional heteroscedasticity (ARCH) model to more precisely assess the heteroscedasticity function. To simplify the higher-order ARCH model and optimize empirical processes, Bollerslev [70] took both heteroscedasticity and its autoregressive problem into consideration and proposed a new and more general class of processes, called ‘generalized autoregressive conditional heteroscedasticity’ (GARCH) model. The GARCH (𝑘,𝑙) can be specified as:
𝑦𝑡= 𝑎0+𝑎𝑦𝑡−1+𝜀𝑡, ... (1)
18
𝜀𝑡 =�ℎ𝑡𝜎𝑡 , 𝜎𝑡 ~ 𝑖.𝑖.𝑑.𝑁(0,1), ... (3)
ℎ𝑡 =𝛼0+𝛼1𝜀𝑡−12+𝛼2𝜀𝑡−22+⋯+𝛼𝑘𝜀𝑡−𝑘2+𝛽1ℎ𝑡−1+⋯+𝛽𝑙ℎ𝑡−𝑙, ... (4) where ℎ( ) is a non-negative function, according to (2)(3), which determines the structure of conditional variances, Ωt−1 represents the set of all information before the moment of t . And, 𝛼0 is a constant term, 𝛼𝑘 is the coefficient of the
𝑘-order ARCH term, which is 𝜀𝑡−𝑘2, 𝛽𝑙 is the coefficient of the 𝑙 -order GARCH term, which is ℎ𝑡−𝑙. A stable GARCH (𝑘,𝑙) requires: 𝛼𝑖 ≥ 0 (𝑖 = 1,2, … ,𝑘); 𝛽𝑗 ≥ 0 (𝑗 = 1,2, … ,𝑙); ∑𝑘𝑖=1𝛼𝑖 +∑𝑙𝑗=1𝛽𝑗 < 1. When 𝑘 and 𝑙 are both 1, the model is the GARCH (1,1).
ARCH-in-mean (ARCH-M) was proposed by Engle and Lilien [30] in 1987 to
reflect risk premium by introducing a heteroscedasticity term indicating the effect of risk of the return into the mean equation. GARCH-M model is a modification of the ARCH-M model by adding the GARCH term into the conditional variance function. Therefore, to present the time series of the return {𝑟𝑡} and introduce its risk by {ℎ𝑡}, the mean equation (1) in GARCH-M model of {𝑟𝑡} can be written as:
19
The autoregressive moving average (ARMA) model was proposed by Box et al. [71] for modelling a time-varying time series. Thus the equation (1) of the time series { 𝑦𝑡 } applied by the ARMA (𝑝,𝑞) model can be specified as:
𝑦𝑡= 𝑎0+𝑎1𝑦𝑡−1+𝑎2𝑦𝑡−2+⋯+𝑎𝑝𝑦𝑡−𝑞+𝑏1𝜀𝑡−1+𝑏2𝜀𝑡−2+⋯+
𝑏𝑞𝜀𝑡−𝑞+𝜀𝑡, ... (6) where 𝑎0 is a constant term, 𝑦𝑡−𝑞 is the lagged variable of 𝑦𝑡 ,which can be called an autoregressive term, and 𝜀𝑡 is the error term at the moment of t, which can be called a moving average term. 𝑎𝑝 is the coefficient of the 𝑝-order autoregressive terms and 𝑏𝑞 is the coefficient of the 𝑞-order moving average term. Based on the equation (5) (6), to consider the ARMA process in to the GARCH-M model of {𝑟𝑡}, the mean equation of ARMA (𝑝,𝑞)-GARCH -M model is:
𝑟𝑡= 𝑎0+𝑎1𝑟𝑡−1+𝑎2𝑟𝑡−2+⋯+𝑎𝑝𝑟𝑡−𝑞+𝑏1𝜀𝑡−1+𝑏2𝜀𝑡−2+⋯+
𝑏𝑞𝜀𝑡−𝑞+𝛾ℎ𝑡+𝜀𝑡, ... (7) Therefore, the ARMA (𝑝,𝑞)-GARCH (𝑘,𝑙)-M model can be specified as:
𝑟𝑡= 𝑎0+𝑎1𝑟𝑡−1+𝑎2𝑟𝑡−2+⋯+𝑎𝑝𝑟𝑡−𝑞+𝑏1𝜀𝑡−1+𝑏2𝜀𝑡−2+⋯+
𝑏𝑞𝜀𝑡−𝑞+𝛾ℎ𝑡+𝜀𝑡, ... (7)
ℎ𝑡 =𝛼0+𝛼1𝜀𝑡−12+𝛼2𝜀𝑡−22+⋯+𝛼𝑘𝜀𝑡−𝑘2+𝛽1ℎ𝑡−1+⋯+𝛽𝑙ℎ𝑡−𝑙, ... (4)
20
where 𝛾 is the parameter of risk premium, which is the level of impact on return series 𝑟𝑡 from anticipatable risk calculated by conditional variance ℎ𝑡 and represent the relationship between expected risk and expected return.
Benz and Trück have used the GARCH model capturing CO2 allowances
price volatility [54]. They conducted an empirical analysis of EUA prices in the first two years of EU ETS, and showed that the plot of spot prices and returns demonstrated asymmetry, excess kurtosis or heavy tails. Benz and Trück [54] suggested that the main barrier to overcome in further analysis was the lack of
adequate amount of data. Subsequently, these researchers applied the AR-GARCH
model to two different short periods, namely, in-sample and out-of-sample, of EUA spot prices and log-return. They come to the conclusion that the GARCH model significantly outperforms the model with constant variance, and can be regarded as an adequate approach for modelling emission allowance log-return [55].
Another group of researchers employed various kinds of GARCH-type structure to examine the behaviours of two different kinds of emission allowance, i.e. CO2 allowances in the EU ETS and the SO2 allowances in the US CAAA [58]. In their
2006 working paper [57], Paolella and Taschini discussed in detail the methodology for exploring pricescenarios in emission market. To address the “zeros-problem” (i.e. high presence of zeros) in the log-return series of SO2 allowances, they proposed a
sophisticated and improved GARCH-type model, namely, n-component MixN-GARCH implemented in Matlab. But for the CO2 allowances series, there are less zeros
21
presented in its return time series (in their sample, 3 out of the 337 log-returns were zero, while in our sample, it is 10 of 704). In their view, the conventional GARCH model can be utilized in the CO2 allowances series without the “zeros-problem”. This
lends support to the use of the standard GARCH model in our study to analyze the process of CO2 allowances in Shenzhen.
Based on previous empirical studies,Benschop and Cabrera [53] have made a
further exploration on the GARCH process to model the EUA spot prices. They proposed an improved combined model, namely, Markov regime switching (MS)-GARCH model and made a comparison about the sample fitting performance of different models. They found that the MS-AR-GARCH model had the best sample fit according to the log likelihood and AIC, but this process would create a greater number of parameters in model than simple AR-GARCH i.e. 18 and 8 separately in their findings. Therefore, our empirical analysis adopted the AR-GARCH technique, instead of the MS-AR-GARCH.
As a normal expansion of GARCH model, GARCH-M has been widely used in the research of risk premium of financial market, especially the stock market [61, 72-74]. There are also many studies on the relationship between risk and return of bulk commodities, such as oil prices [75] and agricultural products prices [76, 77]. Moreover, the ARMA-GARCH-M approaches have been employed to model the mean and volatility of wind speed [78]. However, few studies have used the GARCH-M model to examine the risk premium of emission allowance. To fill this
22
knowledge gap, the present research expanded the GARCH to GARCH in mean to examine our research hypothesis as followed.
These studies suggest that the GARCH model and its variants are useful for understanding the financial performance of carbon markets. None of them, however, involves the allowance-based market in China. We used the abovementioned technique for our Chinese study and produced the following results.
5 Results
5.1 The data
Table 2 displays the descriptive statistics of the sample, including trading volume, turnover, and average price. From June 2013 to June 2016, a total of 15.7 million tonnes of CO2 were traded in the SEE at a historical average price of 50.66 yuan
(CNY/USD at the rate of 0.15 as of 30 June 2016). It is worthwhile noting that the mean values of trading volume and turnover are remarkably higher than the median values. The observations exhibit skewness and excess kurtosis, suggesting that the
trading volume and turnover are leptokurtic and the fluctuations are highly
concentrated.
Figures 1 and 2 show the volatility behavior of trading volume and turnover, respectively. Clear fluctuations were found during two periods of time, namely,
23
between January 2015 and July 2015, and between November 2015 and February 2016; otherwise the trading volume was low and steady. There were more trading activities in the second half of the three-year study period (January 2015 – June 2016) than the first half (June 2013 – December 2014). Abnormalities were observed throughout the immediate past six months. Several transactions recorded in early 2016 were exceedingly large. The extreme ones, recorded in 21 March 2016 and 8 June 2016, reached 4 million tonnes and 3.6 million tonnes, respectively1. These two unusually large deals account for nearly half (25 per cent and 23 per cent respectively) of the three-year total.
Daily average prices of emission allowances ranged from 21.5 yuan in 9 July 2015 to 123 yuan in 17 October 2013. The prices moved upwards in the inception of the ETS and became volatile toward the end of 2013 (Figure 3). Price movements became stable after late 2014, moving within the range of 20 yuan and 50 yuan. Since then, the market demonstrated more stability than the earlier period. This is probably because the first official compliance year of the ETS finished in the end of the second quarter of 2014. Market participants had experienced a learning process since July and gained better understanding about market supply and demand as well as compliance requirements and regulatory practice. The learning process continued in the first half of 2016, stabilizing the price movement within the range of 25 yuan, or approx. US$3 (i.e. between 25 yuan to 50 yuan).
1 We have cross-checked with the SEE’s official publications and found that both of these transactions are noted as such in its weekly summaries.
24
5.2 Time series analysis
To satisfy the stationarity requirement of time series in the GARCH model, we used log-returns of daily average prices for showing their volatility behavior. The log-returns are the first difference of the logarithm of prices can be calculated by this formula: 𝑅𝑡 = 100∗ln(𝑃𝑡/𝑃𝑡−1), where 𝑃𝑡 and 𝑃𝑡−1 are the average allowance prices of on day 𝑡 and 𝑡 −1 respectively. The Eviews Version 7 was used to build the ARMA-GARCH and ARMA-GARCH-M models for the log-returns of prices.
The time plot of the log-returns series for the entire study period is presented in Figure 4. It shows that volatility varies with time, and there are heteroscedasticity and volatility clustering. The descriptive statistics for log-returns and the result of the three kinds of stationarity test are reported in Table 3. The skewness parameter is positive (0.275), indicating that the time series is right-skewed. The kurtosis parameter (7.201) well exceeds 3, suggesting leptokurtosis and fat-tails. The Jarque-Bera (JB) test statistics, which is used to check for normality, rejects the null
hypothesis that the log-returns are normally distributed. The Augmented
Dickey–Fuller(ADF) test [79] and Philips-Perron[80] test [81] statistics is -21.04327 and -60.53277, greater than the critical value and significant at the 1% level, thus rejecting the null hypothesis of the existence of unit root. To confirm the stationarity of the series, we conducted the Kwiatkowski-Phillips-Schmidt-Shin (KPSS) test [82].
25
Results showed that the null hypothesis of a stationary process is not rejected. This suggests that the log-returns can be described as a stationary financial time series and satisfy the stationarity requirement of the GARCH model.
We used the ARMA-GARCH and ARMA-GARCH-M to model the time series. The first step was constructing an ARMA model and identifying the orders of the autoregressive and moving average terms based on the Akaike information criterion (AIC) [83], Schwarz Criterion (SC) [84] and log likelihood measures. We created and tested the nine different ARMA models: AR (1); MA (1); AR (1) and MA (1); AR (1), AR (2), and MA (1); AR (1), MA (1) and MA (2); AR (1), AR (2), MA (1) and MA (2); AR (1), AR (2), AR (3), MA (1) and MA (2); AR (1), AR (2), MA (1), MA (2) and MA (3); AR (1), AR (2), AR (3), MA (1), MA (2) and MA (3). The result of AIC, SC and log likelihood are shown in the Table 3. For AIC statistics, the smallest value is 7.5074, pointing the optimal choice is ARMA (3,2); for SC statistics, the smallest value is 7.5348 pointing the optimal choice is ARMA (1,2); and for R-squared and adjusted R-Squared, the largest value at 0.2705 and 0.2653, both pointing the optimal choice is ARMA (3,2).
Generally, the optimal structure of the ARMA model for this time series is ARMA (3,2).For GARCH, we chose a basic and commonly used GARCH model, i.e. GARCH (1,1). This model is suitable for analyzing the log-return time series of the price of emission allowances, which can be regarded as a financial asset, and investigating and forecasting its time-varying dynamics pattern. The ARMA (3,2)- GARCH (1,1) model can be written as:
26
Mean equation: 𝑟𝑡= 𝛼0+𝑎1𝑟𝑡−1+𝑎2𝑟𝑡−2+𝑎3𝑟𝑡−3+𝑏1𝜀𝑡−1+𝑏2𝜀𝑡−2, Variance equation: ℎ𝑡 = 𝛼0+𝛼1𝜀𝑡−12+𝛽1ℎ𝑡−1,
By adding a heteroscedasticity term in the mean equation, the ARMA (3,2)- GARCH (1,1)-M model can be specified as:
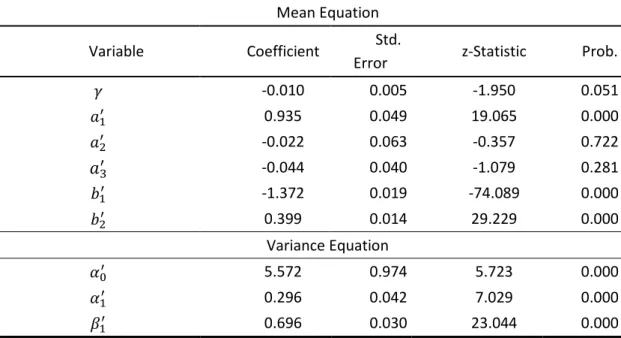
Mean equation: 𝑟𝑡= 𝑎1′𝑟𝑡−1+𝑎2′𝑟𝑡−2+𝑎3′𝑟𝑡−3+𝑏1′𝜀𝑡−1+𝑏2′𝜀𝑡−2+𝛾ℎ𝑡, Variance equation: ℎ𝑡 = 𝛼0′ +𝛼1′𝜀𝑡−12+𝛽1′ℎ𝑡−1,
where 𝛾 is the parameter of the relationship between the returns of emission
allowance as a financial asset and its conditional variance (heteroscedasticity term) reflecting the uncertainty of return or expected risk. This coefficient is the trade-off of risk return. The underlying assumption is that financial assets that incur higher risks are likely to yield higher returns, which compensate for bearing risk. Thus, high volatility of an effective financial market is expected to generate a risk premium for assets [30].
Results of ARMA-GARCH modelling are reported in Table 4. In the variance equation, the coefficients of 𝛼1 and 𝛽1 are positive and their p-values show they are significant at the level of 1 %, indicating that the ARMA-GARCH model is statistically robust. The sum of 𝛼1 and 𝛽1 is 0.987, which is below but close to 1, satisfying the assumption of GARCH, which demonstrates a long-term memory in the volatility of returns or price dynamics due to the impacts of shocks from news [85].
27
Overall, the results show that the time series of returns have a GARCH effect and follow the normal pattern of volatility, like a form of a financial asset.
Results of ARMA-GARCH-M modelling are reported in Table 5. In the variance equation, the coefficients of 𝛼1′ and 𝛽1′ are also positive and their p-values show they are significant at the level of 1 %, indicating that the ARMA-GARCH-M model is statistically robust. The sum of 𝛼1+𝛽1 is 0.992, meaning that it is a stable model. In the mean equation, however, the coefficient of 𝛾 has a negative sign (-0.010) and is significant at the 5% level. This means that a one-unit increase in risk (i.e. the conditional variance of returns) is associated with a decline in returns by 0.010 unit. That is, there is a negative relationship between expected yield and expected risk.
5.3 Comparison with other findings
In Section 3.1, we have indicated that existing studies on emission allowance prices have different analytic emphases. A common finding among those focusing on price determinants is that structural breaks exist in the price sequences of EUAs. These structural breaks could be explained by regulatory change [46] or market participants’ expectations [47]. As carbon futures are currently not available in Chinese carbon markets, the findings of studies focusing on the relationship between spot and futures prices have little relevance for our studies. Nonetheless, this will
28
become a potentially important research topic when the carbon futures market begins operation in China.
Some studies sought to capture the stochastic of price behaviour of CO2 permits.
For example, Daskalakis et al. [56] have found a highly discontinuous price jump in 2006 and non-stationarity in spot and futures data in European markets (i.e. Powernext, Nord Pool and ECX), and suggested that the main reason is the restriction of banking in the early stages of the EU ETS. We did not find an clear-cut price break in Shenzhen’s carbon allowance data, but only a general decline in price and high volatility.Seifert et al. [59]reported a briefempirical analysis of the return series of EUA, which demonstrated low autocorrelations. Our empirical results have also identified a similar autocorrelative effect of return series in Shenzhen. Moreover, our statistical strategy was informed by Paolella and Taschini(Mixed-normal GARCH) [58], Benz and Trück (Markov switching and GARCH ) [55] and Benschop and Cabrera (MS-GARCH) [53]. Both the findings of these previous studies and ours have indicated heteroscedasticity and heavy tail in the allowance price series with fluctuation cluster. However, our research contributes to knowledge by expanding
the GARCH process to GARCH-M to the log-return series, and producing anegative
coefficient between return and the expected risk reflected by the conditional variance, which is intuitively intriguing.
29
6 Discussion
The results reported above provide mixed evidence for our research hypothesis. We found that the volatility of allowance prices in Shenzhen does correlate with the rate of expected asset returns, but in the opposite way, i.e. asset returns are negatively associated with risk premium. This suggests that expected gains decline as risks increase, standing at odds with the usual expectation in the financial market and the prediction of asset pricing theory [80]. In addition, significant fluctuations and excessively high kurtosis were found in the records of trading volume. Several block trades were concentrated in a few days, while the daily trading volume over a three-year period was modest. The two outliners, reported in Figure 1 above, appear to be an unusual market movement driven by private negotiations between institutional buyers and sellers. The fact that these bulk transactions account for nearly half of the total trading volume across the three-year period raises question about market liquidity and market domination by a handful of participants.
The observed price pattern can be seen as a possible outcome of the market imperfections in China. As Zhang [5] has indicated, emission allowances are over- allocated and there are considerable uncertainties regarding the duration of the validity of allowances as financial assets. Also, many enterprises tend to believe that the governments are not serious in enforcing compliance. As a consequence, they engage in emission trading only for compliance purposes and do not participate in emissions trading until the last minute. The lack of momentum in the Chinese carbon
30
market might result in abnormal movements in price and trading volume, such as the negative coefficient of GARCH-M model, single days with extremely high trading volume, and the declines in price, as demonstrated by our study.
Although the Shenzhen ETS has advantages over the other six Chinese ETSs, it is yet to move beyond its primitive form of quasi-market. Without being able to eliminate concerns about financial maturity, our findings provide additional evidence about the limitations of the pilot ETSs operating in China, which is broadly consistent with earlier assessments reported elsewhere [14, 17-21]. There is a general consensus among researchers and practitioners that the Chinese ETSs currently do not demonstrate the properties of a well-functioning market [4, 5, 14, 21, 23]. The fact that they remain financially immature and result in price abnormalities may be explained in terms of market liquidity and information uncertainties.
The secondary market is poorly developed. At present, only spot trading is permitted, whereas futures and options are absent from the Chinese carbon market. The lack of opportunities for hedging and speculation from future price movements undermines incentives for diverting capital to this market. Instead, compliance with regulations is the main objective of engaging in emission trading. Most of the liable entities, largely state-owned entreprises, participate in emission trading for the reason of controlling their GHG emissions and meeting their compliance obligations, with little interest in turning it into an investment [21]. In fact, there is a general lack of knowledge about how carbon markets and trading systems work [19, 38, 86].
31
Some of these entreprises managed to acquire a basic understanding about trading rules and carbon asset management, but “their [market] consciousness is weak and attitude is negative” [14, p]. 1241. Consequently, participation in emission trading is merely viewed as a responsibility, whereas the sense of investment remains weak.
This viewpoint finds evidence from a market research report published in 2014, which involves a survey of enterprises covered by the Shanghai ETS. The report shows that only 6% (9 out of 152) of these enterprises prepared to actively participate in trading, purchasing and selling emission allowances, whereas the rest assumed a passive role [27, p.62]. Many liable entities put their allocations into warehouse, rather than releasing them to the market. Investments account for only a handful of market transactions [14]. Small daily deals are driven by needs.
On the other hand, many large deals involve government intervention. In the Chinese political economy, local and provincial governments have substantial influence over the private sector within their jurisdictions and are able to prompt companies to engage in ‘trading’ with each other. Liu, Chen [21] argue that emission trading in China is primarily driven by the administrative commands from the government. The first transactions in Beijing and Shanghai carbon exchanges were negotiated deals coordinated by local governments. As the prices were formed by agreement between two parties, they were far from competitive and played limited guiding role [21]. Non-market pressures offer a possible explanation for the
32
abnormal price behavior and the presence of unusual bulk transactions, which warrants further research to validate.
Information uncertainties may also contribute to market abnormalities. In China, carbon emission data are far from complete and consistent [18, 23]. This increases difficulties for market participants to predict and speculate on relative demand and manage investment portfolios. Moreover, market participants tend to be conservative when a new market is formed. Liable entities with excess allowances hesitate to sell out, whereas those running short of allowances are keen on buying in. Thus, allowance supply and demand often move apart in the early days of business when the market and regulatory conditions (e.g. the abundance of allowances and auction arrangements) are uncertain to all parties, including investors and brokers [27, p.64]. The declining supply and growing demand may result in a price surge. To date, this issue remains unresolved as little information about the prospective national ETS has been released and the future of the pilot ETSs remains uncertain.
7 Conclusions and Policy Implications
This study examined the volatility behavior of the emission allowances changed hands under the Shenzhen ETS in China. Its novelty lies in the use of the ARMA-GARCH-M technique for modelling asset returns series and analysing allowance price data recorded in China. We found that the rate of return was
33
negatively associated with expected risk represented by the conditional variance, and this stands at odds with the usual expectation in the financial market. In addition, there were significant fluctuations and excessively high kurtosis in trading volume. Although the Shenzhen ETS has been operating for more than three years since June 2013 and has many advantages over its counterparts in China, more work is needed to turn it into a mature market in which yield would normally increase with volatility.
The findings call for regulatory attention and economic fixes to improve the efficiency of this carbon market and eliminate sources of market distortions, such as excessive state intervention into market activities and restrictions on trading options. Currently in China, not many enterprises and investors have expressed a strong interest in trading emission allowances for profits. Instead, state intervention and regulation are the most important factor affecting allowance prices [27, p.66]. As details about the important national ETS are not yet available, uncertainties associated with strengthening state intervention and introducing new regulatory arrangements are likely to persist. Until the scheme is successfully implemented and the regulatory system is made transparent, market abnormalities, as we have identified, may continue to exist.
As a policy experiment, the pilot ETSs form a basis for building a nationwide scheme and offer lessons to learn. Understanding the properties and imperfections of the Chinese carbon market are important for advancing the performance of the carbon markets in China and potentially those in other developing countries that
34
consider emission trading as part of the policy mix. Based on our observations, we provide a few recommendations for policymakers in China and other developing countries.
Firstly, more financial innovations are needed to increase the liquidity of China’s carbon market. Derivatives and other financial products that allow speculations are in short supply, due to regulatory restrictions. Providing a variety of financial products is important for attracting investments and hedging risks, thus increasing the liquidity and economic efficiency of the carbon market. Secondly, relevant government agencies, notably the NDRC, should scale up current efforts on building capacity all cross the country, and not only in the provinces and cities running the pilot ETSs. A better understanding about how to manage their allocations and acquire emission allowances from the market could help participants from lower-tier provinces and cities to more actively engage in nationwide emission trading and increase market activities. Thirdly, the ETS regulators should review the practice of information disclosure by entreprises and investors. Reliable and accurate information about major transactions is crucial for facilitating capital flows and supporting investment decision-making.
35
We would like to express our gratitude to the Regional Studies Association and the National Science Foundation of China for supporting this research through the Early Career Scheme 2015 and Young Scientists Fund (Grant No.: 41601605), respectively.
References:
[1] International Energy Agency. CO2 Emissions from Fuel Combustion - 2015 Highlights. Paris: International Energy Agency; 2015.
[2] Intergovernmental Panel on Climate Change. Climate change 2014: mitigation of climate change [Edenhofer, O., R. Pichs-Madruga, Y. Sokona, E. Farahani, S. Kadner, K. Seyboth, A. Adler, I. Baum, S. Brunner, P. Eickemeier, B. Kriemann, J. Savolainen, S. Schlömer, C. von Stechow, T. Zwickel and J.C. Minx (eds.)]. Cambridge, UK: Cambridge University Press; 2014, p.10.
[3] Zhang Z. Climate mitigation policy in China. Climate Policy 15. 2015:sup1, 1-6.
[4] Zhang Z. Crossing the river by feeling the stones: the case of carbon trading in China. Environmental Economics and Policy Studies. 2015;17:263-97.
[5] Zhang Z. Carbon emissions trading in China: the evolution from pilots to a nationwide scheme. Climate Policy. 2015;15:S104-S26.
[6] Zhang Z. China in the transition to a low-carbon economy. Energy Policy. 2010;38:6638-53.
[7] Zhang Z. Why has China not embraced a global cap-and-trade regime? Climate Policy. 2007;7:166-70.
[8] Schröder M. Local Climate Governance in China. Basingstoke: Palgrave Macmillan; 2011. p. 248.
[9] Jiang J, Ye B, Ma X. The construction of Shenzhen׳s carbon emission trading scheme. Energy Policy. 2014;75:17-21.
[10] Dong Y, Olsen KH. Stakeholder participation in CDM and new climate mitigation mechanisms: China CDM case study. Climate Policy. 2015:1-18.
[11] Lo AY, Howes M. Powered by the state or finance? The organization of China’s carbon markets. Eurasian Geography and Economics. 2013;54:386-408.
[12] Jiang J, Xie D, Ye B, Shen B, Chen Z. Research on China’s cap-and-trade carbon emission trading scheme: Overview and outlook. Applied Energy. 2016;178:902-17.
[13] World Bank. State and Trends of Carbon Pricing 2016. Washington, D.C.: World Bank Group; 2016.
[14] Zhao X, Jiang G, Nie D, Chen H. How to improve the market efficiency of carbon trading: A perspective of China. Renewable and Sustainable Energy Reviews. 2016;59:1229-45. [15] Zhang Z. Making the Transition to a Low‐Carbon Economy: The Key Challenges for China. Asia & the Pacific Policy Studies. 2016;3:187-202.
36
[16] Zhang D, Karplus VJ, Cassisa C, Zhang X. Emissions trading in China: Progress and prospects. Energy Policy. 2014;75:9-16.
[17] Wu L, Qian H, Li J. Advancing the experiment to reality: Perspectives on Shanghai pilot carbon emissions trading scheme. Energy Policy. 2014;75:22-30.
[18] Lo AY. Challenges to the Development of Carbon Markets in China. Climate Policy. 2016;16:109-24.
[19] Shen W. Chinese business at the dawn of its domestic emissions trading scheme: incentives and barriers to participation in carbon trading. Climate Policy. 2015;15:339-54. [20] Lo AY. Carbon trading in a socialist market economy: Can China make a difference? Ecological Economics. 2013;87:72-4.
[21] Liu L, Chen C, Zhao Y, Zhao E. China׳s carbon-emissions trading: Overview, challenges and future. Renewable and Sustainable Energy Reviews. 2015;49:254-66.
[22] Munnings C, Morgenstern RD, Wang Z, Liu X. Assessing the design of three carbon trading pilot programs in China. Energy Policy. 2016;96:688-99.
[23] Duan M, Pang T, Zhang X. Review of Carbon Emissions Trading Pilots in China. Energy & Environment. 2014;25:527-50.
[24] International Carbon Action Partnership. ETS Map. Availabl from
https://icapcarbonaction.com/en/ets-map Accessed 9 September 2016. 2016.
[25] French K, Schwert GW, Stambaugh R. Expected stock returns and volatility. Journal of financial Economics. 1987;19:3-29.
[26] Fama EF. Efficient capital markets: II. The Journal of Finance. 1991;46:1575-617.
[27] Environomist. Environomist China Carbon Market Research Report 2016. Beijing: Environomist Ltd.; 2016.
[28] Veld-Merkoulova Y, Viteva S. Carbon finance : how carbon and stock markets are affected by energy prices and emissions regulations. Cham: Springer; 2016.
[29] Labatt S, White R. Carbon finance: The financial implications of climate change. Hokoken, N.J.: John Wiley & Sons; 2007.
[30] Engle R, Lilien D, Robins R. Estimating time varying risk premia in the term structure: The ARCH-M model. Econometrica: Journal of the Econometric Society. 1987:391-407. [31] Allen F, Qian M, Zhao M. A review of China’s financial system and initiatives for the future. China’s emerging financial markets: Springer; 2009. p. 3-72.
[32] Xiao G. Deepen reform and improve the system to strengthen supervision and prevent risks. Promote long-term stable and healthy development of the capital market. Speech by Mr Xiao Gang, Chairman of China Securities Regulatory Commission, in the work meeting on
national securities and futures regulation http://wwwcsrcgovcn/pub/newsite/zjhxwfb/xwdd/201601/t20160116_289977html
[Accessed 28 July 2016]. Beijing2016
[33] The Beijing News. 100-day shocks, thousand shares limit-down for 16 times.
http://epaper.bjnews.com.cn/html/2015-09/22/content_599315.htm?div=-1 [Accessed 28
July 2016]. 22 September 2015.
[34] Wan J. China’s Stock Market Turmoil: Lessons and Implications. East Asian Policy. 2016;8:94-102.
37
[35] Qian J. The 2015 Stock Panic of China: A Narrative (June 14, 2016). Available at SSRN:
http://ssrncom/abstract=2795543 [Accessed 28 July 2016]. 2016.
[36] Gao Y. Chinese stock market suspended circuit breaker mechanism after the "black
humor" [in Chinese]. BBC http://www.bbc.com/zhongwen/trad/china/2016/01/160108_china_stock_black_humour
[Accessed 22 July 2016]2016.
[37] Xie Y, Hong S. Circuit Breaker: China Calls Time on Stock Market Fall. Wall Street Journal. 2016.
[38] Huang Y. Policy experimentation and the emergence of domestic voluntary carbon trading in China. East Asia. 2013;30:67-89.
[39] Standing Committee of Shenzhen Municipal People's Congress. Provisions of Carbon Emissions Management of the Shenzhen Special Economic Zone. Shenzhen: Standing Committee of Shenzhen Municipal People's Congress ,People’s Republic of China; 2012. [40] Shenzhen Municipal People's Government. Shenzhen Provisional Regulation on Pilot Carbon Emissions Trading. Shenzhen: Shenzhen Municipal People's Government, People's Republic of China; 2014.
[41] Skjærseth J, Wettestad J. Making the EU emissions trading system: the European commission as an entrepreneurial epistemic leader. Global Environmental Change. 2010;20:314-21.
[42] Newell R, Pizer W, Raimi D. Carbon markets 15 years after Kyoto: Lessons learned, new challenges. The Journal of Economic Perspectives. 2013;27:123-46.
[43] Ellerman D, Convery F, De Perthuis C. Pricing carbon: the European Union emissions trading scheme: Cambridge University Press; 2010.
[44] Alberola E, Chevallier J, Chèze B. European carbon prices fundamentals in 2005-2007: the effects of energy markets, temperatures and sectorial production. 2007.
[45] Alberola E, Chevallier J, Chèze B. The EU emissions trading scheme: The effects of industrial production and CO2 emissions on carbon prices. Economie internationale. 2008:93-125.
[46] Alberola E, Chevallier J, Chèze Bt. Price drivers and structural breaks in European carbon prices 2005–2007. Energy policy. 2008;36:787-97.
[47] Chevallier J. Carbon futures and macroeconomic risk factors: a view from the EU ETS. Energy Economics. 2009;31:614-25.
[48] Hintermann B. Allowance price drivers in the first phase of the EU ETS. Journal of Environmental Economics and Management. 2010;59:43-56.
[49] Hitzemann S, Uhrig-Homburg M. Empirical performance of reduced-form models for emission permit prices. Available at SSRN 2297121. 2013.
[50] Mansanet-Bataller M, Pardo A, Valor E. CO₂ prices, energy and weather. The Energy Journal. 2007:73-92.
[51] Chevallier J. Cointegration between carbon spot and futures prices: from linear to nonlinear modeling. Economics Bulletin. 2012;32:160-81.
[52] Trück S, Hardle W, Weron R. The relationship between spot and futures CO2 emission allowance prices in the EU-ETS. Emission Trading Systems as a Climate Policy Instrument-Evaluation and Prospects, MIT Press (Forthcoming). 2014.
38
[53] Benschop T, Cabrera BL. Volatility Modelling of CO2 Emission Allowance Spot Prices with Regime-Switching GARCH Models. 2014.
[54] Benz E, Trück S. CO2 emission allowances trading in Europe—specifying a new class of assets. Problems and Perspectives in Management. 2006;4:30-40.
[55] Benz E, Trück S. Modeling the price dynamics of CO 2 emission allowances. Energy Economics. 2009;31:4-15.
[56] Daskalakis G, Psychoyios D, Markellos RN. Modeling CO 2 emission allowance prices and derivatives: evidence from the European trading scheme. Journal of Banking & Finance. 2009;33:1230-41.
[57] Paolella M, Taschini L. An econometric analysis of emission trading allowances. Swiss Finance Institute. 2006:06-26.
[58] Paolella M, Taschini L. An econometric analysis of emission allowance prices. Journal of Banking & Finance. 2008;32:2022-32.
[59] Seifert J, Uhrig-Homburg M, Wagner M. Dynamic behavior of CO 2 spot prices. Journal of Environmental Economics and Management. 2008;56:180-94.
[60] Boako G, Agyemang Badu AA, Frimpong JM. Volatility dynamics in equity returns: a multi-GARCH approach. European Journal of Business and Innovation Research. 2015;3:36-45.
[61] Elyasiani E, Mansur I. Sensitivity of the bank stock returns distribution to changes in the level and volatility of interest rate: A GARCH-M model. Journal of Banking & Finance. 1998;22:535-63.
[62] Bennett L. Are Tradable Carbon Emissions Credits Investments-Characterization and Ramifications under International Investment Law. NYUL Rev. 2010;85:1581.
[63] Pei Q, Liu L, Zhang DD. Carbon emission right as a new property right: rescue CDM developers in China from 2012. International Environmental Agreements: Politics, Law and Economics. 2013;13:307-20.
[64] Markowitz H. Portfolio selection : efficient diversification of investments. New Haven: Yale University Press; 1959.
[65] Enders W. Applied econometric time series. New York: John Wiley & Sons; 1995.
[66] Campbell J, Hentschel L. No news is good news: An asymmetric model of changing volatility in stock returns. Journal of financial Economics. 1992;31:281-318.
[67] Devaney M. Time varying risk premia for real estate investment trusts: A GARCH-M model. The Quarterly Review of Economics and Finance. 2001;41:335-46.
[68] Hamilton JD. Time series analysis: Princeton university press Princeton; 1994.
[69] Engle R. Autoregressive conditional heteroscedasticity with estimates of the variance of United Kingdom inflation. Econometrica: Journal of the Econometric Society. 1982:987-1007. [70] Bollerslev T. Generalized autoregressive conditional heteroskedasticity. Journal of econometrics. 1986;31:307-27.
[71] Box G, Jenkins G, Reinsel G, Ljung G. Time series analysis: forecasting and control: John Wiley & Sons; 1976.
[72] Bekaert G, Wu G. Asymmetric volatility and risk in equity markets. Review of Financial Studies. 2000;13:1-42.
39
[73] Dueker M. Markov switching in GARCH processes and mean-reverting stock-market volatility. Journal of Business & Economic Statistics. 1997;15:26-34.
[74] Lee C, Chen G, Rui OM. Stock returns and volatility on China's stock markets. Journal of Financial Research. 2001;24:523-43.
[75] Hou A, Suardi S. A nonparametric GARCH model of crude oil price return volatility. Energy Economics. 2012;34:618-26.
[76] Hai H. Application of GARCH model in research on price of agricultural products. Asian Agricultural Research. 2011;3:15-7, 22.
[77] Yang J, Haigh M, Leatham D. Agricultural liberalization policy and commodity price volatility: a GARCH application. Applied Economics Letters. 2001;8:593-8.
[78] Liu H, Erdem E, Shi J. Comprehensive evaluation of ARMA–GARCH (-M) approaches for modeling the mean and volatility of wind speed. Applied Energy. 2011;88:724-32.
[79] Dickey D, Fuller W. Distribution of the estimators for autoregressive time series with a unit root. Journal of the American statistical association. 1979;74:427-31.
[80] Appiah-Kusi J, Menyah K. Return predictability in African stock markets. Review of financial economics. 2003;12:247-70.
[81] Phillips PC, Perron P. Testing for a unit root in time series regression. Biometrika. 1988;75:335-46.
[82] Kwiatkowski D, Phillips PC, Schmidt P, Shin Y. Testing the null hypothesis of stationarity against the alternative of a unit root: How sure are we that economic time series have a unit root? Journal of econometrics. 1992;54:159-78.
[83] Akaike H. Information theory and an extension of the maximum likelihood principle. Selected Papers of Hirotugu Akaike: Springer; 1998. p. 199-213.
[84] Schwarz G. Estimating the dimension of a model. The annals of statistics. 1978;6:461-4. [85] Chou RY. Volatility persistence and stock valuations: Some empirical evidence using GARCH. Journal of Applied Econometrics. 1988;3:279-94.
[86] Lo AY, Yu X. Climate for business: opportunities for financial institutions and sustainable development in the Chinese carbon market. Sustainable Development. 2015;23:369-80.
40
Table 1 Key features of Shenzhen City and Shenzhen Emission Trading Scheme (ETS) Shenzhen City Total Population (2015) (percentage of country)1 11.4 million (0.8%) GDP (2015) (percentage of country)1 USD270.2 billion (2.6%)
GDP per capita1 USD24,393
Overall GHG emissions (excluding LULUCF) (2012) (percentage of country)2
153 MtC02e (1.4%)
Shenzhen ETS
Launch date 18 June 2013
Cap on GHG emissions2 34.78 MtCO2e
Percentage of GHG emissions covered by the ETS2
40%
Sectors covered2 Industries (power, water supply, manufacturing,
etc.), buildings and transportation
Number of liable entities2 635 enterprises, 197 public buildings
Inclusion thresholds3 3,000t CO
2e per year for enterprises;
Large public buildings;
10,000m2 for government buildings.
Allowance allocation4 Industrial sectors: 95% free allocation, 3%
auction, 2% reserve
Buildings: 100% free allocation
Trading mode Spot trading, block trades, negotiated transfers
41
allowances2 Borrowing not allowed.
Offsets and credits4 Domestic project-based carbon offset credits —
China Certified Emission Reduction (CCER) — are allowed. The use of CCER credits is limited to 10% of the annual compliance obligation.Credits from hydro projects are not eligible and there are further geographic restrictions for the use of certain CCERs.
Sources:
1 National Bureau of Statistics of China (data.stats.gov.cn). The GDP estimates
originally in Chinese yuan were converted to US dollars at the rate of 0.1544 (CYN/USD) based on the Federal Reverse’s exchange rate records (31 December 2015)
2 International Carbon Action Partnership (ICAP) (icapcarbonaction.com)
3 Shenzhen Municipal People's Government (2014). Shenzhen Provisional Regulation
on Pilot Carbon Emissions Trading. Shenzhen: Shenzhen Municipal People's Government, People’s Republic of China.
4 Jiang et al. (2014, p. 19)
5 Shenzhen Municipal People's Government (2015). Shenzhen Provisional Regulation
of Carbon Offset and Credits on Pilot Carbon Emissions Trading. Shenzhen: Shenzhen Municipal People's Government, People’s Republic of China.
42
Table 2 Descriptive statistics of trading records in Shenzhen (2013 – 2016)
Item Mean
Media n
Max Min Std. dev. Ske w Kurt N Trading volume (Tonne) 22,143 2,178 4,000,000 0 203,493 18.5 1 346.1 0 70 5 Turnove r (CNY)^ 762,74 4 114,65 9 100,000,00 0 0 5,136,07 6 17.7 2 325.9 9 70 5 Average price (CNY)^ 50.66 42 122.97 21.4 7 18.20 0.87 -0.12 70 5
^ CNY/USD at the rate of 0.15 based on the Federal Reverse’s exchange rate records (30 June 2016)
43
44
45
Figure 3 Daily average price of emission allowances in Shenzhen (2013 – 2016)
0 20 40 60 80 100 120 140 Av er ag e pr ic e ( Yu an )
46
47
Table 3 Descriptive statistics of log-return series and ADF test result
Statistic Value Mean -0.002 Median 0.000 Maximum 60.710 Minimum -59.737 Std. Dev. 12.012 Skewness 0.275 Kurtosis 7.201 Jarque-Bera 526.554 Probability 0 Observations 704 ADF test1 -21.04327***
1 *** means significant at 1 % level of critical value and critical value at 1 % level, 5 % level
48
Table 4 Results of ARMA-GARCH modelling
Mean Equation
Variable Coefficient Std. Error z-Statistic Prob.
𝑎0 -0.097 0.057 -1.715 0.086 𝑎1 1.143 0.046 24.697 0.000 𝑎2 -0.114 0.069 -1.649 0.099 𝑎3 -0.096 0.043 -2.258 0.024 𝑏1 -1.569 0.009 -177.942 0.000 𝑏2 0.582 0.011 51.763 0.000 Variance Equation 𝛼0 5.519 0.991 5.571 0.000 𝛼1 0.279 0.040 7.063 0.000 𝛽1 0.708 0.029 24.331 0.000
49
Table 5 Results of ARMA-GARCH-M modelling
Mean Equation
Variable Coefficient Std.
Error z-Statistic Prob.
𝛾 -0.010 0.005 -1.950 0.051 𝑎1′ 0.935 0.049 19.065 0.000 𝑎2′ -0.022 0.063 -0.357 0.722 𝑎3′ -0.044 0.040 -1.079 0.281 𝑏1′ -1.372 0.019 -74.089 0.000 𝑏2′ 0.399 0.014 29.229 0.000 Variance Equation 𝛼0′ 5.572 0.974 5.723 0.000 𝛼1′ 0.296 0.042 7.029 0.000 𝛽1′ 0.696 0.030 23.044 0.000