ORE RESEARCH & EXPLORATION P/L ABN 28 006 859 856
37A Hosie Street · Bayswater North · VIC 3153 · AUSTRALIA
6 1 3 9 7 2 9 0 3 3 3 6 1 3 9 7 6 1 7 8 7 8 i n f o @ o r e .c o m.a u w w w .o r e .c o m.a u
CERTIFICATE OF ANALYSIS FOR
HEMATITE ORE
REFERENCE MATERIAL
OREAS 401
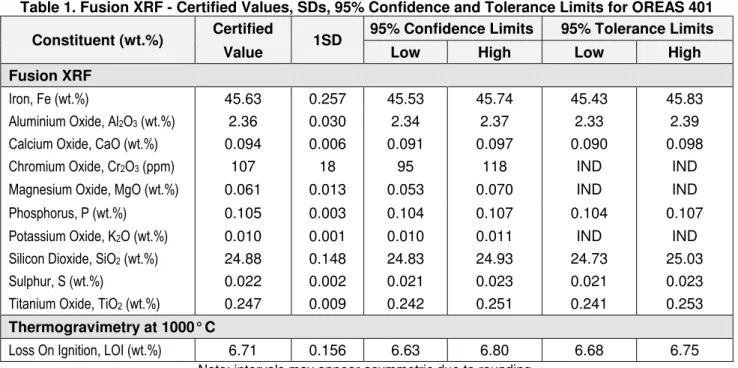
Table 1. Fusion XRF - Certified Values, SDs, 95% Confidence and Tolerance Limits for OREAS 401
Constituent (wt.%) Certified 1SD 95% Confidence Limits 95% Tolerance Limits
Value Low High Low High
Fusion XRF
Iron, Fe (wt.%) 45.63 0.257 45.53 45.74 45.43 45.83
Aluminium Oxide, Al2O3 (wt.%) 2.36 0.030 2.34 2.37 2.33 2.39
Calcium Oxide, CaO (wt.%) 0.094 0.006 0.091 0.097 0.090 0.098
Chromium Oxide, Cr2O3 (ppm) 107 18 95 118 IND IND
Magnesium Oxide, MgO (wt.%) 0.061 0.013 0.053 0.070 IND IND
Phosphorus, P (wt.%) 0.105 0.003 0.104 0.107 0.104 0.107
Potassium Oxide, K2O (wt.%) 0.010 0.001 0.010 0.011 IND IND
Silicon Dioxide, SiO2 (wt.%) 24.88 0.148 24.83 24.93 24.73 25.03
Sulphur, S (wt.%) 0.022 0.002 0.021 0.023 0.021 0.023
Titanium Oxide, TiO2 (wt.%) 0.247 0.009 0.242 0.251 0.241 0.253
Thermogravimetry at 1000° C
Loss On Ignition, LOI (wt.%) 6.71 0.156 6.63 6.80 6.68 6.75
Table 2. Indicative Values for OREAS 401
Constituent Unit Value Constituent Unit Value Constituent Unit Value
Infrared Combustion S wt.% 0.020 Fusion XRF As ppm 10.9 Na2O wt.% 0.016 Zn ppm 21.1 Cl ppm 32.8 Ni ppm 28.9 Zr ppm 74 Cu ppm 18.3 Pb ppm 11.2 MnO wt.% 0.007 V ppm 32.2
INTRODUCTION
OREAS reference materials are intended to provide a low cost method of evaluating and improving the quality of analysis of geological samples. To the geologist they provide a means of implementing quality control in analytical data sets generated in exploration from the grass roots level through to prospect evaluation, and in grade control at mining operations. To the analyst they provide an effective means of calibrating analytical equipment, assessing new techniques and routinely monitoring in-house procedures.
SOURCE MATERIALS
Reference material OREAS 401 is one of a suite of six CRMs sourced from hematite iron ore samples from the Spinifex Ridge deposit owned by Moly Mines Limited. Areas of enriched iron occur within the banded iron formation of the Gorge Creek Group located approximately 170km east of Port Hedland in Western Australia.
COMMINUTION AND HOMOGENISATION PROCEDURES
The material constituting OREAS 401 was prepared in the following manner:
•
drying to constant mass at 105°C;•
crushing and multi stage milling;•
homogenisation;•
packaging in 10g units into laminated foil pouches and in 1kg units into plastic jars.ANALYTICAL PROGRAM
Seventeen commercial analytical laboratories participated in the program to characterise the elements reported in Table 1 via lithium borate fusion with x-ray fluorescence for the standard iron ore suite including Fe, P, SiO2, Al2O3, CaO, MgO, MnO, S, TiO2, K2O, Na2O and LOI at 1000°C via thermogravimetry. Two laboratories used infra-red combustion furnace to determine sulphur and this data was not included with the XRF data but an indicative value for sulphur via IR combustion is presented (see Table 2). Table 2 shows
indicative values for a number of elements where data was insufficient for certification (further explained in ‘Statistical Analysis’). All analytes were requested to be reported on a dry basis without the addition of sodium nitrate to the flux and iron content to be determined by direct measurement XRF, not by closure to 100%, or any other assumed total.
For the round robin program ten 500g test units were taken at predetermined intervals during the bagging stage, immediately following final blending, and are considered representative of the entire batch. The six samples received by each laboratory were obtained by taking two 25g scoop splits from each of three separate 500g test units. This format enabled nested ANOVA treatment of the results to evaluate homogeneity.
Results, together with uncorrected means, medians, standard deviations, relative standard deviations and percent deviation of lab means from the corrected mean of means (PDM3) are presented in the certification data file for this CRM (OREAS 401 Datapack.xlsx).
STATISTICAL ANALYSIS
Certified Values, Standard Deviations, Confidence and Tolerance Limits have been determined for each analytical method following removal of individual and laboratory outliers (see Tables 1). Certified Values are the mean of means after outlier filtering. The 95% Confidence Limit is a measure of the reliability of the certified value, i.e. the narrower the Confidence Interval the greater the certainty in the Certified Value. It should not be used as a control limit for laboratory performance.
Indicative values (Table 2) are provided where i) the number of laboratories reporting a particular analyte is insufficient (< 5) to support certification; ii) interlaboratory consensus is poor; or iii) a significant proportion of results are outlying or reported as less than detection limits.
Standard Deviation values (1SDs) are reported in Table 1 and provide an indication of a level of performance that might reasonably be expected from a laboratory being monitored by this CRM in a QA/QC program. They take into account errors attributable to measurement uncertainty and CRM variability. For an effective CRM the contribution of the latter should be negligible in comparison to measurement errors. The Standard Deviation values include all sources of measurement uncertainty: between-lab variance, within-run variance (precision errors) and CRM variability. The SD for each analyte’s certified value is calculated from the same filtered data set used to determine the certified value, i.e. after removal of all individual, lab dataset (batch) and 3SD outliers (single iteration). These outliers can only be removed after the absolute homogeneity of the CRM has been independently established, i.e. the outliers must be confidently deemed to be analytical rather than arising from inhomogeneity of the CRM. The standard deviation is then calculated for each analyte from the pooled accepted analyses generated from the certification program.
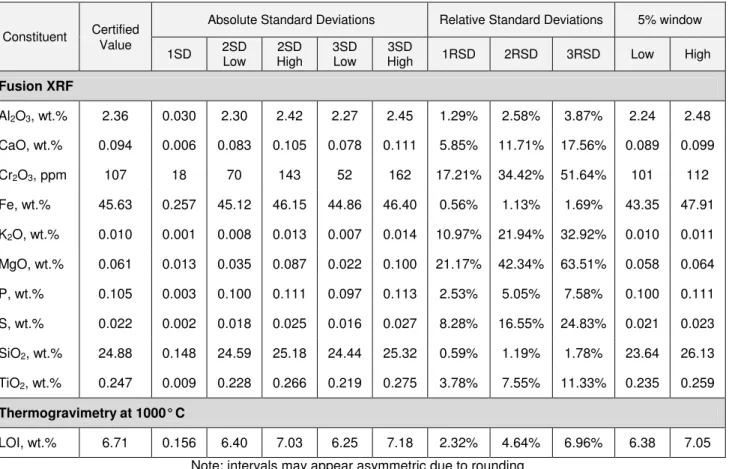
Performance Gates in Table 3 are calculated for two and three standard deviations. As a guide these intervals may be regarded as warning or rejection for multiple 2SD outliers, or rejection for individual 3SD outliers in QC monitoring, although their precise application should be at the discretion of the QC manager concerned. A second method utilises a 5% window calculated directly from the certified value. Standard deviation is also shown in relative percent for one, two and three relative standard deviations (1RSD, 2RSD and 3RSD) to facilitate an appreciation of the magnitude of these numbers and a comparison with the 5% window. Caution should be exercised when concentration levels approach lower limits of detection of the analytical methods employed as performance gates
calculated from standard deviations tend to be excessively wide whereas those determined by the 5% method are too narrow.
Table 3. Performance Gates for OREAS 401
Constituent Certified
Absolute Standard Deviations Relative Standard Deviations 5% window Value 1SD 2SD Low 2SD High 3SD Low 3SD
High 1RSD 2RSD 3RSD Low High Fusion XRF Al2O3, wt.% 2.36 0.030 2.30 2.42 2.27 2.45 1.29% 2.58% 3.87% 2.24 2.48 CaO, wt.% 0.094 0.006 0.083 0.105 0.078 0.111 5.85% 11.71% 17.56% 0.089 0.099 Cr2O3, ppm 107 18 70 143 52 162 17.21% 34.42% 51.64% 101 112 Fe, wt.% 45.63 0.257 45.12 46.15 44.86 46.40 0.56% 1.13% 1.69% 43.35 47.91 K2O, wt.% 0.010 0.001 0.008 0.013 0.007 0.014 10.97% 21.94% 32.92% 0.010 0.011 MgO, wt.% 0.061 0.013 0.035 0.087 0.022 0.100 21.17% 42.34% 63.51% 0.058 0.064 P, wt.% 0.105 0.003 0.100 0.111 0.097 0.113 2.53% 5.05% 7.58% 0.100 0.111 S, wt.% 0.022 0.002 0.018 0.025 0.016 0.027 8.28% 16.55% 24.83% 0.021 0.023 SiO2, wt.% 24.88 0.148 24.59 25.18 24.44 25.32 0.59% 1.19% 1.78% 23.64 26.13 TiO2, wt.% 0.247 0.009 0.228 0.266 0.219 0.275 3.78% 7.55% 11.33% 0.235 0.259 Thermogravimetry at 1000° C LOI, wt.% 6.71 0.156 6.40 7.03 6.25 7.18 2.32% 4.64% 6.96% 6.38 7.05
Note: intervals may appear asymmetric due to rounding
Tolerance Limits (ISO Guide 3207) were determined using an analysis of precision errors method and are considered a conservative estimate of true homogeneity. The meaning of tolerance limits may be illustrated for iron (Fe), where 99% of the time (1-α=0.99) at least
95% of subsamples (ρ=0.95) will have concentrations lying between 45.43 and 45.83 wt.%.
Put more precisely, this means that if the same number of subsamples were taken and analysed in the same manner repeatedly, 99% of the tolerance intervals so constructed would cover at least 95% of the total population, and 1% of the tolerance intervals would cover less than 95% of the total population (IS0 Guide 35).
ANOVA Treatment of all results was undertaken to evaluate the homogeneity of certified analytes in OREAS 401. All labs participated in the ANOVA study where each received paired samples of three different, non-adjacent, sampling units. For example, the ten samples that any one of the eight participating labs could have received is:
• Sample 1 (from sampling interval 1) • Sample 2 (from sampling interval 4) • Sample 3 (from sampling interval 7) • Sample 4 (from sampling interval 1) • Sample 5 (from sampling interval 4) • Sample 6 (from sampling interval 7)
For the purpose of the ANOVA investigation these intervals were considered test units where the aim was to test whether between-unit variance was greater than within-unit variance. This approach permitted an assessment of homogeneity across the entire batch of OREAS 401. The test was performed using the following parameters:
• Significance Level α = P (type I error) = 0.05
• Null Hypothesis, H0: Between-unit variance is no greater than within-unit variance (reject H0 if p-value < 0.05)
• Alternative Hypothesis, H1: Between-unit variance is greater than within-unit variance
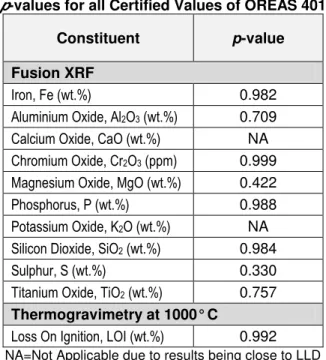
p-values are a measure of probability whereby values less than 0.05 indicate a greater than 95% probability that the observed differences in within-unit and between-unit variances are real. Each dataset was filtered for both individual and laboratory outliers prior to calculation of p-values. This process derived the p-values as shown in Table 4 and indicate no evidence that between-unit variance is greater than within-unit variance.
Conclusion: do not reject H0. Note that ANOVA is not an absolute measure of
homogeneity. Rather, it establishes that the analytes are uniformly distributed throughout OREAS 401 and that the variance between two subsamples from the same unit is identical to the variance from two subsamples taken from any two separate units.
Table 4. Results of ANOVA Treatment showing
p-values for all Certified Values of OREAS 401
Constituent p-value
Fusion XRF
Iron, Fe (wt.%) 0.982
Aluminium Oxide, Al2O3 (wt.%) 0.709
Calcium Oxide, CaO (wt.%) NA
Chromium Oxide, Cr2O3 (ppm) 0.999
Magnesium Oxide, MgO (wt.%) 0.422
Phosphorus, P (wt.%) 0.988
Potassium Oxide, K2O (wt.%) NA
Silicon Dioxide, SiO2 (wt.%) 0.984
Sulphur, S (wt.%) 0.330
Titanium Oxide, TiO2 (wt.%) 0.757
Thermogravimetry at 1000° C
Loss On Ignition, LOI (wt.%) 0.992
NA=Not Applicable due to results being close to LLD
Based on the statistical analysis of the results of the interlaboratory certification program it can be concluded that OREAS 401 is fit-for-purpose as a certified reference material (see ‘Intended Use’ below).
PREPARER AND SUPPLIER OF THE REFERENCE MATERIAL
Reference material OREAS 401 has been prepared, certified and is supplied by:
ORE Research & Exploration Pty Ltd Tel: +613-9729 0333
37A Hosie Street Fax: +613-9761 7878
Bayswater North VIC 3153 Web: www.ore.com.au
AUSTRALIA Email: [email protected]
PARTICIPATING LABORATORIES
Acme Analytical Laboratories, Vancouver, BC, Canada Activation Laboratories, Ancaster, Ontario, Canada ALS, Brisbane, QLD, Australia
ALS, Callao, Lima, Peru ALS, Perth, WA, Australia ALS, Vancouver, BC, Canada BV Amdel, Adelaide, SA, Australia BV Amdel, Cardiff, NSW, Australia BV Ultra Trace, Perth, WA, Australia Intertek Genalysis, Perth, WA, Australia
OMAC Laboratories, Loughrea, County Galway, Ireland
Rio Tinto Cape Lambert Operations, Wickham, WA, Australia SGS, Lakefield, Ontario, Canada
SGS, Booysens, Gauteng, South Africa SGS, Perth, WA, Australia
SGS, Vespasiano, MG, Brazil
UIS, Centurion, Gauteng, South Africa
INTENDED USE
OREAS 401 is intended for the following uses:
•
for the monitoring of laboratory performance in the analysis of analytes reportedin Table 1 in geological samples
•
for the verification of analytical methods for analytes reported in Table 1•
for the calibration of instruments used in the determination of the concentrationof analytes reported in Table 1
STABILITY AND STORAGE INSTRUCTIONS
OREAS 401 is an oxidised reference material and is stable in the laminated foil pouches. Under normal conditions of storage it has a shelf life beyond ten years.
INSTRUCTIONS FOR THE CORRECT USE OF THE REFERENCE
MATERIAL
The certified values for lithium borate fusion XRF and for LOI are on a dry basis. This requires the removal of hygroscopic moisture by drying in air to constant mass at 105°C. If the reference material is not dried prior to analysis, the certified values should be corrected to the moisture-bearing basis.
HANDLING INSTRUCTIONS
Fine powders pose a risk to eyes and lungs and therefore standard precautions such as the use of safety glasses and dust masks are advised.
LEGAL NOTICE
Ore Research & Exploration Pty Ltd has prepared and statistically evaluated the property values of this reference material to the best of its ability. The Purchaser by receipt hereof releases and indemnifies Ore Research & Exploration Pty Ltd from and against all liability and costs arising from the use of this material and information.
CERTIFYING OFFICER
Craig Hamlyn (B.Sc. Hons - Geology), Technical Manager – (ORE P/L)
REFERENCES
ISO Guide 35 (2006), Certification of reference materials - General and statistical principals. ISO Guide 3207 (1975), Statistical interpretation of data - Determination of a statistical tolerance interval.
ISO 9516-1:2003: Iron Ores - Determination of various elements by X-ray fluorescence spectrometry - Part 1: Comprehensive procedure.