Load Balancing on
Cluster-Based Multi Projector Display Systems
Marcus Roth
Fraunhofer IGD Darmstadt Fraunhofer Str. 5 64283 Darmstadt, Germany
[email protected]
Patrick Riess
Fraunhofer IGD Darmstadt Fraunhofer Str. 5 64283 Darmstadt, Germany
[email protected]
Dirk Reiners
Human-Computer Interaction Iowa State University Ames, IA 50011, US
[email protected]
ABSTRACT
Sort-first or image space parallel rendering has been the subject of a significant amount of research. Its limited scalability is well known. Nevertheless, sort-first has noticeable advantages over other approaches: it has moderate and predictable communication overhead, and it has no problems with multipass or transparent rendering. Especially for multi-projector display systems, driven by a cluster of standard PCs with limited network bandwidth, it is the first choice to achieve interactive frame rates. In this paper we present an approach to do load balancing for arbitrary multi projector systems, based on a sort-first approach.
Keywords
multidisplay, cluster, sortfirst, realtime
1. INTRODUCTION
Many different multi projector display systems have been developed in the past two decades, mainly de-signed to overcome the restrictions of a single display. Multi projector displays like tiled walls provide a higher resolution, while systems like a Cave or a curved display allow a larger field of view. Nowadays, most of these systems are driven by a cluster of standard PCs. All of these displays are based on a static sort-first rendering, where each projector is responsible for a predefined part of the display. On a tiled display each projector is re-sponsible for a rectangular region of the wall, and in a Cave a projector is assigned to one of the display walls.
Permission to make digital or hard copies of all or part of this work for personal or classroom use is granted without fee provided that copies are not made or distributed for profit or commercial advantage and that copies bear this notice and the full citation on the first page. To copy otherwise, or republish, to post on servers or to redistribute to lists, requires prior specific permission and/or a fee.
Conference proceedings ISBN 80-86943-03-8 WSCG2006, January 30-February 3, 2006 Plzen, Czech Republic.
Copyright UNION Agency Science Press
There are many different ways to construct a multi pro-jector system, like having mono or stereo displays us-ing active or passive stereo and with different amounts of overlap between tiles for edge blending. This pa-per describes how to configure a cluster based render-ing system which can be used for arbitrary displays. As each projector has a predefined responsibility, the ren-dering performance is limited by the projector showing the most complex content. In the majority of cases the rendering load is not spread equally between the respec-tive projections. As a result of this the performance can be enhanced if a PC which is connected to a display with low rendering load, absorbs a part of the load from a PC with high rendering load. To achieve this, a dynamic load balancing is necessary as load can change from frame to frame. The performance can be further en-hanced if the number of parallel rendering PCs is inde-pendent of the number of projectors. This paper demon-strates how to utilize all the rendering performance of a cluster, where a subset of the PCs are connected to a pro-jection system. Multi projector displays can be built in large scale. For example theHEyeWallof the Fraunhofer IGD in Darmstadt uses 48 projectors to build a stereo-scopic tiled display with a resolution of 6144 x 3072 pixels. Currently there is no cluster network hardware
available to achieve a scene distribution (sort-last) par-allel rendering on a display with 18 megapixels at inter-active framerates. Additionally, current graphics cards are not able to render a part of the scene at full screen resolution, which is needed for direct sort-last render-ing. As a consequence, the focus of this paper is on image distribution (sort-first) parallel rendering for load balancing on multi projector systems.
Load balancing can be split into two tasks: the estima-tion and the actual balancing of the load. The estimaestima-tion needs to be both accurate and fast, which are contradic-tory goals. This paper presents a new estimation func-tion that can be calculated efficiently, but also takes dif-ferent aspects of the rendering load into account. This estimation function can be used to reduce the overlap factor that is responsible for the limited scalability of sort-first.
2. PREVIOUS WORK
A lot of work has been done for parallel rendering. In many cases algorithms were proposed to be imple-mented in hardware, but in the last few years an in-creasing number of algorithms have been developed that are optimized for cluster rendering. The classification of parallel rendering algorithms in sort-first, sort-middle and sort-last was proposed by Molnar et.al. [MCE94]. For software implementation only sort-first and sort-last approaches are usable.
With sort-first the screen is split into regions that are ren-dered in parallel, whereas sort-last splits the scene into independent parts to be processed simultaneously. In a cluster system with sort-first only the color of a pixel has to be transferred over a network to compose a final image. With sort-last the whole frame buffer with color and depth information of each rendering node has to be transferred for this purpose. Without the image compo-sition step sort-last scales nearly linearly with the num-ber of rendering nodes, as the rendering of scene parts is completely independent of each other. Sort-first does not scale very well because scene objects that are visi-ble on more than one region have to be rendered multi-ple times. The influence of the overlap factor has been discussed in [MCE94].
To reduce the amount of data that needs to be trans-fered and to utilize the bandwidth and processing power of the cluster for sort-last a number of algorithms have been developed. One of the most popular ones is bi-nary swap [MPH94], allowing interactive rendering on low resolution displays. Hybrid approaches have been proposed to achieve the scalability of sort-last as well as
the low bandwidth requirement of sort-first [MRW99], but unfortunately with the combined advantages also the disadvantages are combined. Transparency and multi-pass rendering cause problems, and depending on the scene the amount of data that has to be transferred can reach that of binary swap. In [MWP01] a sort-last ap-proach specialized for tiled displays is proposed, but the achieved framerates are less then one frame per second on a 4x4 tiled display. Although network bandwidth has been improved since the publication, it is not possible to get interactive framerates with current standard network hardware. As a result of this in most cases sort-first is used to do parallel rendering on tiled displays.
Samanta et.al. presented several approaches in [SZF99] to do load balancing on a tiled display based on sort-first. The proposed KD-split algorithm is also the basis for the balancing algorithm presented here. The projec-tion area is recursively split into regions with equal load and then the resulting regions are assigned to rendering nodes. The approach presented here extends it to allow splitting of non-planar projections, and adds the influ-ence of geometry and rasterization to the cost estimation function. Another problem with the original KD-split is that the screen split is done completely independent of the assignment of nodes to display regions. For this reason regions may be larger than the frame buffer of a single node, forcing them to be rendered sequentially in smaller parts.
[Abr04] solves the load estimation problem based on old frames’ measured time and motion vector estimation. This enables a fast calculation independent of scene complexity, at the cost of limited accuracy for hard to predict motions like tracked head data. Even for scenes as complex as the powerplant the load estimation pre-sented here has not been a noticeable factor, alleviating the need for less flexible and more complex load estima-tion.
3. DISPLAY CONFIGURATION
There are a lot of possibilities to construct a display con-sisting of a number of projectors and a number of PCs. To be able to handle as many different kinds of displays as possible the following situations must be handled:
• One PC can drive one or more projectors.
• Each projector can display a scene from an arbi-trary view point.
• Each projector can display an arbitrary rectangular region of a planar projection.
• A projection can be mono, active stereo, or passive stereo.
• All situations can be combined.
One of the goals of the presented work is to support as wide a variety of display configurations as possible. Most systems are specialized for tiled displays, or non-planar displays and might have options for active or pas-sive stereo. But the wide variety of possible configura-tions (e.g. tiled front wall with a single projector left side and a two projector floor) creates a combinatorial explosion of necessary specializations, especially when combined with the desire to support sort-first load bal-ancing.
Therefore this work uses a more general way of describ-ing a complete display. The core component is a View-port. A Viewport has an associated camera and scene, and renders a single image. Each Window can contain an arbitrary number of Viewports.
This can be used to drive any kind of projection systems if we provide a convenient way to modify camera pa-rameters. The core idea is to have one Camera, which holds parameters like position, orientation and view an-gle, which is shared by a number of Viewports to sim-plify changing parameters. To get left and right eye ver-sions, or to split it up into tiles, a Camera can be manip-ulated using the Decorator pattern [Gam95]. Multiple Decorators can be combined to create compound modi-fications:
• Tile camera decorator: This decorator takes a viewing matrix and modifies it in a way that only a part of the viewing frustum is visible. For example on a tiled display this decorator is used to project a different part of an image with each projector. • Stereo camera decorator: This decorator
modi-fies the viewing matrix for the left eye or the right eye, depending on its settings.
• Projection camera decorator: This decorator modifies the camera so that it shows the scene from a viewpoint onto a viewing plane that is placed at an arbitrary position. In a cave this decorator de-scribes the cave walls whereupon the position of the viewer comes from a tracking device.
With the decorators it is possible to modify camera pa-rameters for all non active stereo displays. To be able to support active stereo the viewport is extended. With active stereo a PC has to render an image twice into dif-ferent view buffers. To support this with Viewports, they can be dedicated to the left or right eye buffer, and for a complete stereo picture two Viewports are assigned to the same area of the Window, just to different eyes.
Stereo parameters like eye separation are defined with the camera decorators related to a Viewport.
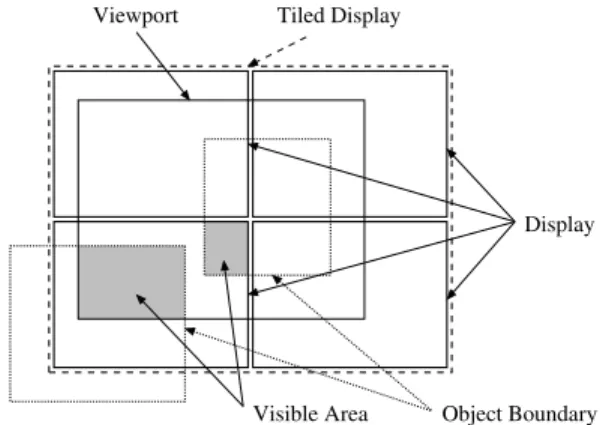
This structure allows handling of all displays which are composed of rectangular planar projection planes. To be able to support non-planar displays, like spherical pro-jections, an additional display correction step was added that works on the frame buffer. After rendering is fin-ished the frame buffer is copied into a texture (or on current systems rendering is done directly into a Frame-BufferObject (FBO)) and it is projected onto a distortion geometry that can be defined for each projector. With the combination of all techniques it is possible to con-figure all displays that can be build out of standard pro-jection systems. Viewport Display Object Boundary Visible Area Tiled Display
Figure 1: Virtual window
To extend this to parallel, clustered rendering a single, large virtual ClusterWindow is defined (see fig.1), which is split in two independent, different ways. One split is defined by an arbitrary number of Viewports. The sec-ond split is a distribution among all the nodes in the clus-ter associated with the window. These two splits are in-dependent, i.e. one Viewport can be visible on many cluster nodes, or a single cluster node can have multi-ple Viewports. Each Viewport has a camera that defines which part of the scene is visible. To calculate the load for a single projector all viewports which are visible on the assigned area need to be found. To select the exact region that a cluster node is responsible for, a TileDec-orator is added internally, which selects the parts of the Viewports that are relevant. This modified viewport is the basis for the load estimation. The load balancing as-signs parts of one viewport from an overloaded PC to another.
4. LOAD ESTIMATION
men-tioned above it is not possible to achieve both goals at the same time as they are contrary. The best estimation result can be reached if the scene is rendered, because that definitely answers the question how long it takes to render it, but the resulting performance is worse than without balancing.
A common approach is to use rendering information from previous renderings. This can be very accurate, but has some disadvantages. With current hardware it is dif-ficult to get exact rendering times because most of the rendering is done asynchronously. Another disadvan-tage is that rendering information from previous frames is only accurate if the viewpoint does not change very much. But this is a situation where low framerates are mostly not a big problem. If the viewpoint changes very fast, the performance values from previous frames are not accurate, but especailly in this situation high framer-ates are important. Based on these considerations inter-frame information is not used in this paper, and a fast load estimation based on the current camera settings is designed instead.
The load balancing proposed in this work is based on the scene graph systemOpenSG, which is publicly available atwww.opensg.org. The leaves of the graph represent geometric objects. In polygonal models those objects contain a number of geometric primitives. If a fast load estimation is desired, it is impossible to take each indi-vidual graphics primitive into account. But as a com-promise information of a geometric object in the scene graph can be gathered, and used to build a load estima-tion for the whole object. Three different cost factors are extracted for the load estimation.
• Constant costs: These costs have to be calculated for each graphics object in the scene graph which is considered to be visible. Constant costs are inde-pendent of the fact whether the complete object is visible or just a part. They arise from the transfor-mation of all vertices into the clipping coordinate system and the clipping of the primitives. Espe-cially for a sort-first approach it is very important to take constant costs into account because they are incurred on each screen tile on which an object is visible. To estimate the number of transformed ver-tices to number of transfered indices is used. • Relative costs: These costs have to be calculated
for each visible primitive. As load estimation is not performed for single primitives, the whole ge-ometry object has to be taken into account and its visible fraction calculated. This can be done by projecting the bounding volume into screen space
and calculating the fraction that overlaps a view-port. Similar to constant costs the relative costs are related to the number of primitives in a geometric object. In the load estimation function again the number of indices is used as a fast indicator. • Pixel costs: These kind of costs have to be
cal-culated for each visible pixel of a geometry. As the number of visible pixels cannot be predicted exactly, it is estimated by projecting the bounding volume into screen space. The region overlapping the viewport is used as an estimation for the num-ber of visible pixels. These costs mainly depend on material properties like textures and pixel shaders, they are not related to the number of primitives. Each kind of cost is multiplied by a constant factor (Cc,
Cr,Cp) that depends on the graphics hardware. For the material properties colored, textured, and materials with pixel shader are handled separately. For each of these different factors their respective cost is measured using an off-line program. This is a very rough approxima-tion, but due to this simple approach it is possible to use fixed factors without the need to do a per object material analysis. c(o) =i(o) Cc+Crar(o) (o) +Cpa(o) (1) The cost estimation function calculates the costcfor an objecto. The functioni(o)gives the number of indices used by an object,a(o)is the number of visible pixels of the projected bounding volume andr(o)is the size of the projected bounding volume into screen space with-out clipping. The cost estimation is very simple but it is able to cover the core parts of the rendering pipeline. In a cluster system the performance of load estimation can be increased by doing it in parallel on all rendering nodes. When the load estimation is finished for each vis-ible graphics object of the scene graph for all displays, the results are transferred over the network to a central node that is responsible for the load balancing.
5. LOAD BALANCING
Before starting to develop a new load balancing algo-rithm it is important to know the goal of the optimiza-tion. One possible goal would be that each parallel ren-dering node has the same renren-dering load. But especially with a sort-first based rendering approach this could lead to suboptimal rendering performance.
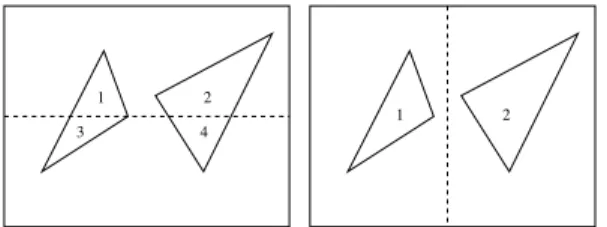
Fig. 2 shows a screen with two visible triangles. There are two possible ways of splitting this screen into two
1 3
2
4 1 2
Figure 2: Possible screen subdivision with equal load
regions with equal load. On the left side both triangles are visible on both regions. So in each one, two triangles have to be processed. Summed over both regions, four triangles have to be rendered. In contrast to this on the right side only one triangle is visible on each region. So during rendering, only two triangles have to be rendered. This demonstrates that equal load is no guarantee for an optimal screen subdivision. As a result of this an equal load is not the goal in the first place, but instead search-ing for a screen subdivision where the overall rendersearch-ing performance reaches a maximum. As the rendering per-formance depends on the rendering time of the region with the highest load, the screen subdivision where the region with the highest load reaches a minimum is se-lected.
In most approaches based on sort-first a region is sub-divided along its longest side. This is often called the median cut [Whe85; Mue95]. This split is attractive be-cause it minimzies the length of a region border, which is beneficial according to the Molnar/Eyles overlap func-tion. In the described load estimation, this is already taken into account by the use of constant costs. This allows evaluating the benefits of cutting a region along both axes in order to compare the resulting load of both cuts, and selecting the one with the smaller maximum load. In contrast to the median cut this approach can be called the best cut.
Figure 3: Median cut compared to best cut
From the load estimation a list of all visible viewports for each server as well as their sizes and positions are
calculated. This includes a list of all objects whose bounding rectangles intersect a certain Viewport, and their constant, relative, and pixel costs.
To balance the load, each server’s load is summed up. The servers are sorted by their load, and a median load is calculated. Load (i.e. a part of the screen) is reassigned from the highst ot the lowest load server until one of them reaches the median load. To avoid unnecessary pixel transfers a threshold is used, which limits splits of minimal effect. Only if the imbalance is greater than the threshold a transfer from one server to the other occurs. This procedure is repeated until each server in the table has a nearly equal load.
This simple load balancing is the basis for the follow-ing screen split algorithm. It is not generally possible to reach an exact balance as each screen split raises the overall costs according to the constant costs of the load estimation function.
To find the optimal split location for one axis (x or y) the objects that start or end at each pixel location on the axis are listed, and for each object the relative and pixel costs for each column resp. row are calculated. Using this structure as a basis the best cut can be found using the following algorithm:
c1 = 0 c2 = areaCost r = 0
for cut = beginArea to endArea foreach o in openingList[cut] r += o.relative + o.pixel c1 += o.fix c1 += r c2 -= r foreach o in closingList[cut] r -= o.relative + o.pixel c2 -= o.fix maxC = max(c1,c2) if(c1 ge c2) break lastMaxC = maxC lastC1 = c1 lastC2 = c2 if(lastMaxC lt maxC) return (cut-1,lastC1,lastC2) else return (cut,c1,c2)
This is done for both x and y, and the best cut that can be rendered in minimum time is chosen.
If a region is split into two areas, where one area falls into the visible projection area of server one and the other region is calculated by server two, then the re-sult of server two has to be transferred over the network to combine the correct image. Network transfer can be
minimized if the largest of both areas falls into the vis-ible projection area of server one. To achieve this the center of geometric complexity for each area is calcu-lated. As complex geometry results in smaller areas due to the load balancing, the least number of pixels have to be transferred if the center of complexity is calculated by the server which has to transfer its pixels.
The result of this procedure is a work list for all servers that is transferred over the network. To minimize net-work overhead this list is distributed using reliable mul-ticast, which is provided by the OpenSG network layer.
6. RENDERING / PIXEL TRANSFER
After the work list is distributed, each server at first ren-ders all screen areas which have to be sent over the net-work. After rendering, they are stored in main memory. In the next step the area that falls into the responsibility of the server is rendered. Areas are not immediately sent over the network because in an ideal situation all servers take the same time to process all the work in the work list. So it is best to let all servers do their work, and then work on the data transfer because all servers are ready to send and receive.Pixel data is sent as 24 bit RGB color values without compression. Some forms of image compression have been evaluated, but most compression algorithms take more processing time than is gained by the reduction-ing transfer. A simple form of compression would be to use 16 bit color values, but it would result in noticeable quality loss, which was not deemed acceptable.
One problem with sort-first is that many rendering nodes often have to send data to a single node. If all nodes have the same network bandwidth, this could easily overload the receiving capacity of the single node. If socket com-munication over ethernet is used, an overload of a con-nection can cause the protocol to do balancing opera-tions to avoid thrashing. These operaopera-tions can cause a communication channel to be stalled for a large fraction of a second, pushing the resulting network throughput far below the optimum receiving capacity. To avoid net-work overload a demand driven netnet-work transfer is used. A receiving node requests a transmission from a send-ing node at the point of time when it is ready to receive. Multiple areas are being sent sequentially with the full receiving bandwidth without causing network overload. This can be optimized further if the request for one area is sent shortly before the transmission of the last area has finished. This optimization effectively avoids delays between the transmission of multiple areas.
7. SINGLE-SCREEN DISPLAY RESULTS
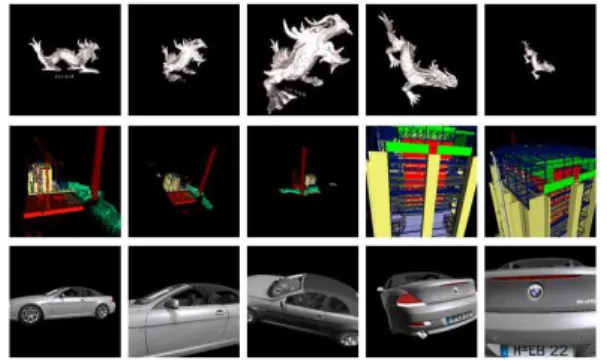
The load balancing algorithm was tested with three scenes which have different characteristics. The first is the dragon model with 8 million polygons, which is split into 1024 pieces in the scene graph. Rendering of this model is completely bounded by its geometry, and the faces are evenly distributed over the surface of the dragon. The second model is the power plant, contain-ing 13 million polygons. An interestcontain-ing feature of this model is that most of the geometry is located in a very small area of the scene, which makes it very difficult to get a good speedup with sort-first approaches. The third model is a BMW 6 series with 4 million polygons, where the coat is rendered with a complex pixel shader. Rendering of this model is limited by the pixel fill rate.Figure 4: Test models
For all three scenes an animation path that contains a closeup and an overview camera position was defined. In all tests this animation was used to produce perfor-mance values. Images of the animation are shown in fig. 4.
As discussed above the main goal was to develop a load balancing for multi projector display systems. To evalu-ate the balancing results the results of parallel rendering on a single display with a resolution of 1024 x 768 are shown in fig. 5.
The framerate is calculated as the average of all anima-tion images. With all scenes a significant speedup can be noticed. Using four PCs a speedup of at least two is reached. The speedup strongly depends on the ren-dered scene, with the dragon model reaching the best speedup. The reason for this is that this model is split into 1024 equal sized non-overlapping objects. The BMW 6 model is rendered unmodified. It contains very large and very small geometry objects that are not evenly distributed over the screen.
0 2 4 6 8 10 12 14 16 18 20 2 4 6 8 10 12 14 16 Frames/s Nodes Speedup Stanford Dragon BMW 6 Power Plant
Figure 5: Models displayed on a single screen display with a resolution of 1024 x 768
pixel costs. Now the question is how these three factors are affecting the balancing result. Thus the scenes are rendered three times always using only one factor and one time using them combined. The results can be seen in fig. 6. They show that the deciding factor depends on the type of the model, making the use of the full cost function most effective.
1 2 3 4 5 6 7 2 4 6 8 10 12 14 16 speedup Nodes DRAGON speedup
full cost function const costs relative costs pixel costs 1 1.5 2 2.5 3 3.5 4 2 4 6 8 10 12 14 16 speedup Nodes BMW6 speedup
full cost function pixel costs const costs relative costs
Figure 6: Influence of the cost estimation function for the BMW and Dragon model
8. MULTI-SCREEN DISPLAY RESULTS
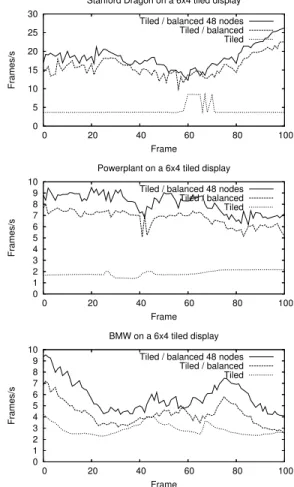
As an example of multi-screen display system a tiled display with 24 projectors and a resolution of 6144 x 3073 pixel was used. For each scene the rendering time without load balancing is given. Generally the render-ing on a tiled display is faster than renderrender-ing on a srender-ingle display, because each projector shows only a part of thewhole scene. The second case shows the same rendering with load balancing. For this test only the 24 PCs, con-nected to the display wall, are used for rendering. In a third test 24 additional PCs in the same cluster are used to check if further speedup is possible.
0 5 10 15 20 25 30 0 20 40 60 80 100 Frames/s Frame
Stanford Dragon on a 6x4 tiled display Tiled / balanced 48 nodes Tiled / balanced Tiled 0 1 2 3 4 5 6 7 8 9 10 0 20 40 60 80 100 Frames/s Frame
Powerplant on a 6x4 tiled display Tiled / balanced 48 nodes
Tiled / balanced Tiled 0 1 2 3 4 5 6 7 8 9 10 0 20 40 60 80 100 Frames/s Frame BMW on a 6x4 tiled display
Tiled / balanced 48 nodes Tiled / balanced Tiled
Figure 7: Three scenes rendered on a 6 x 4 tiled dis-play
Fig. 7 shows the frame rate for each frame of an ani-mation with 100 frames. Using the new load balancing algorithm it is possible to speed up the rendering on a tiled display significantly. It is possible to get a further speedup by using additional PCs.
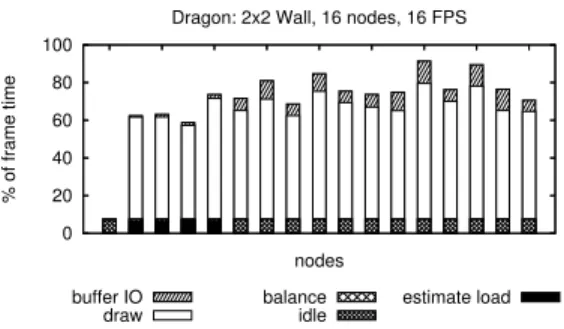
In fig. 8 the time for load estimation, load balancing, buffer I/O, and rendering is shown. To generate this im-age the Dragon model was rendered on a 2 x 2 display wall with four display PCs and 12 additional render PCs. The time is given in percent of the whole frame time. The frame time is mostly dominated by rendering. The time for load estimation and load balancing is small
0 20 40 60 80 100 % of frame time nodes
Dragon: 2x2 Wall, 16 nodes, 16 FPS
buffer IO
draw balanceidle estimate load
Figure 8: Dragon on a 2 x 2 Wall rendered with 16 PCs
compared to the whole frame time. The graph is not showing any values for network communication, but communication is part of the 100 percent frame time. It is not possible to show the real network overhead as a correct time value for each node. The reason for this is that in a communication the time for sending and receiv-ing always depends on two nodes. However, it is easy to get a feeling on how network communication affects the rendering performance. The gap between the node with the most load and the 100 percent mark is mainly caused by network transmissions.
The results show that load estimation and load balanc-ing are very fast. The balancbalanc-ing results depend on the scene. With the Dragon model, a similar rendering time can be achieved for all nodes. Different rendering times between the rendering nodes are a result of the simplifi-cations that have been done during the load estimation.
9. CONCLUSION
A cluster based parallel rendering algorithm with sort-first based load balancing for arbitrary multi display projection systems has been presented. It uses a new load estimation function that incorporates costs caused by geometries overlapping more than one screen region. This cost estimation function enables using a best cut
approach in contrast tomedian cut, which has been used in most other approaches. The results show that the reachable speedup strongly depends on the scene. But even scenes with a very uneven complexity distribution like the Power Plant can be rendered with a significant speedup. All the presented algorithms are part of the scene graph systemOpenSGthat is publicly available at
www.opensg.org.
10. ACKNOWLEDGEMENTS
The dragon model was obtained from the Stanford
Scan-ning Repository, thanks for providing it. The power plant was obtained from the Walkthrough project of the University of North Carolina, thanks to them and their anonymous donor for the model. The BMW model was provided by BMW, thanks for allowing us to use it in this publication.
11. REFERENCES
[Abr04] Abraham, F., Celes, W., Cerqueira, R., and Campos, J., A load-balancing strategy for sort-first distributed rendering, Proceedings. 17th Brazilian Symposium on Computer Graphics and Image Pro-cessing, pp. 292–299, 2004
[Gam95] Gamma, E., Helm, R., Johnson, R., and Vlis-sides, J., Design patterns: elements of reusable object-oriented software, Addison-Wesley Long-man Publishing Co., Inc., Boston, MA, USA, 1995 [MPH94] Ma, K.-L., Painter, J. S., Hansen, C. D.,
and Krogh, M. F., Parallel volume rendering using binary-swap compositing, IEEE Computer Graph-ics and Applications, 14, no. 4, pp. 59–68, 1994 [MRW99] Mckinley, P., Rao, R. T., and Wright, R. F.,
H-RMC: A Hybrid Reliable Multicast Protocol for the Linux Kernel, Proceedings of IEEE SC99: High Performance Networking and Computing, 1999 [MCE94] Molnar, S., Cox, M., Ellsworth, D., and
Fuchs, H., A Sorting Classification of Parallel Ren-dering, IEEE Computer Graphics and Applications, pp. 23–31, 1994
[MWP01] Moreland, K., Wylie, B., and Pavlakos, C., Sort-last parallel rendering for viewing extremely large data sets on tile displays, IEEE 2001 Sympo-sium on Parallel and Large-Data Visualization and Graphics, pp. 85–154, 2001
[Mue95] Mueller, C., The Sort-First Architecture for High-Performance Graphics, Symposium on Inter-active 3D Graphics (Monterey, California, April 9-12, 1995), pp. 75–84, 1995
[SZF99] Samanta, R., Zheng, J., Funkhouser, T., Li, K., Jaswinder, and Singh, P., Load balancing for multi-projector rendering systems, 1999 SIGGRAPH / Eurographics Workshop on Graphics Hardware, pp. 107–116, 1999
[Whe85] Whelan, D. S., A multiprocessor Architecture for real-time computer animation, Ph.D. thesis, Cal-ifornia institute for Technology, 1984