1 1
Manual for Selecting
Safety Improvements
22
Notice
This document is disseminated under the sponsorship of the U.S. Department of
Transportation in the interest of information exchange. The U.S. Government assumes no
liability for the use of the information contained in this document. This report does not
constitute a standard, specification, or regulation.
The U.S. Government does not endorse products or manufacturers. Trademarks or
manufacturers’ names appear in this report only because they are considered essential to the
objective of the document.
Quality Assurance Statement
The Federal Highway Administration (FHWA) provides high-quality information to serve
Government, industry, and the public in a manner that promotes public understanding.
Standards and policies are used to ensure and maximize the quality, objectivity, utility,
and integrity of its information. FHWA periodically reviews quality issues and adjusts its
programs and processes to ensure continuous quality improvement.
TECHNICAL REPORT DOCUMENTATION PAGE
1. Report No. 2. Government Accession No. 3. Recipient's Catalog No.
FHWA-SA-14-075
4. Title and Subtitle 5. Report Date
Manual for Selecting Safety Improvements on High Risk Rural Roads
August 2014
6. Performing Organization Code
7. Author(s) 8. Performing Organization Report No.
Jennifer E. Atkinson, Brian E. Chandler, Vernon Betkey, Karen Weiss, Karen Dixon, Anna Giragosian, Kelly Donoughe, and Cara O'Donnell
9. Performing Organization Name and Address 10. Work Unit No. (TRAIS)
SAIC
11251 Roger Bacon Drive Reston, VA 20190
Subconsultant: Texas A&M Transportation Institute
11. Contract or Grant No.
Contract No. DTFH61-10-D-00024, Task Order No. T-12-006
12. Sponsoring Agency Name and Address 13. Type of Report and Period Covered
Federal Highway Administration Office of Safety
1200 New Jersey Avenue SE Washington, DC 20590
Manual for Selecting Safety Improvements on High Risk Rural Roads
September 2012 through August 2014 14. Sponsoring Agency Code FHWA HSA
15. Supplementary Notes
James Dahlem (james.dahlem@dot.gov), Office of Safety Technologies, served as the Technical Manager for the Federal Highway Administration (FHWA). The following FHWA staff members contributed as technical working group members, reviewers, and/or provided input or feedback to the project at various stages: Jeffrey Shaw, Erin Kenley, Beth Alicandri, Nick Artimovich, Joseph Cheung, Brian Fouch, Becky Crowe, Rosemarie Anderson, Karen Scurry, Rob Ritter, Cathy Satterfield, and Gabe Rousseau. Additionally, many individual safety partners
representing Federal, State, Tribal, and local agencies and professional associations made significant contributions to this project; special thanks to Joseph Bonga (Bureau of Indian Affairs), Richie Beyer (Elmore County, Alabama), Matthew Enders (Washington DOT), Dave Brand (National Association of County Engineers; Madison County, Ohio), Marie Walsh (National Local Technical Assistance Program Association; Louisiana LTAP), Brian Roberts (National Association of Counties), Greg Parker (American Public Works Association), Ken Mammen (Utah DOT), and Joe Marek (Clackamas County, Oregon).
16. Abstract
This manual provides information on the costs and benefits of safety treatments on high-risk rural roads (HRRR). Agencies can use this manual to determine the following information on the treatments: Safety benefits; Cost-effectiveness comparison of safety treatments; Applicability of treatment deployment with respect to identified need; and Initial and reoccurring maintenance costs associated with countermeasure installation. In addition, this manual provides information on the decision-making process necessary to identify treatments.
17. Key Words 18. Distribution Statement
High Risk Rural Roads, Safety Treatments, Safety Management, Safety Funding Sources
No restrictions
19. Security Classif. (of this report) 20. Security Classif. (of this page) 21. No of Pages 22. Price
Unclassified Unclassified 176 N/A
4 ii ft feet 0.305 meters m yd yards 0.914 meters m mi miles 1.61 kilometers km AREA
in2 square inches 645.2 square millimeters mm2
ft2 square feet 0.093 square meters m2
yd2 square yard 0.836 square meters m2
ac acres 0.405 hectares ha
mi2 square miles 2.59 square kilometers km2
VOLUME
fl oz fluid ounces 29.57 milliliters mL
gal gallons 3.785 liters L
ft3 cubic feet 0.028 cubic meters m3
yd3 cubic yards 0.765 cubic meters m3
NOTE: volumes greater than 1000 L shall be shown in m3 MASS
oz ounces 28.35 grams g
lb pounds 0.454 kilograms kg
T short tons (2000 lb) 0.907 megagrams (or "metric ton") Mg (or "t") TEMPERATURE (exact degrees)
oF Fahrenheit 5 (F-32)/9 Celsius oC
or (F-32)/1.8 ILLUMINATION
fc foot-candles 10.76 lux lx
fl foot-Lamberts 3.426 candela/m2 cd/m2
FORCE and PRESSURE or STRESS
lbf poundforce 4.45 newtons N
lbf/in2 poundforce per square inch 6.89 kilopascals kPa
APPROXIMATE CONVERSIONS FROM SI UNITS
Symbol When You Know Multiply By To Find Symbol LENGTH mm millimeters 0.039 inches in m meters 3.28 feet ft m meters 1.09 yards yd km kilometers 0.621 miles mi AREA
mm2 square millimeters 0.0016 square inches in2
m2 square meters 10.764 square feet ft2
m2 square meters 1.195 square yards yd2
ha hectares 2.47 acres ac
km2 square kilometers 0.386 square miles mi2
VOLUME
mL milliliters 0.034 fluid ounces fl oz
L liters 0.264 gallons gal
m3 cubic meters 35.314 cubic feet ft3
m3 cubic meters 1.307 cubic yards yd3
MASS
g grams 0.035 ounces oz
kg kilograms 2.202 pounds lb
Mg (or "t") megagrams (or "metric ton") 1.103 short tons (2000 lb) T TEMPERATURE (exact degrees)
o
C Celsius 1.8C+32 Fahrenheit oF
ILLUMINATION
lx lux 0.0929 foot-candles fc
cd/m2 candela/m2 0.2919 foot-Lamberts fl
FORCE and PRESSURE or STRESS
N newtons 0.225 poundforce lbf
kPa kilopascals 0.145 poundforce per square inch lbf/in2
*SI is the symbol for th International System of Units. Appropriate rounding should be made to comply with Section 4 of ASTM E380. e
v
List of Acronyms ...xii
Executive Summary ... xiii
1. Introduction ...1
1.1. Purpose ... 1
1.2. How to Use This Manual ... 1
2. High Risk Rural Roads Overview...3
2.1. High Risk Rural Road Safety ... 3
2.2. Challenges of Applying Treatments to HRRR ... 4
3. Identifying Safety Treatments ...5
3.1. Tools for Identifying HRRR Safety Issues ... 5
Highway Safety Manual ... 6
Safety Analyst ... 6
Crash Modification Factor (CMF) Clearinghouse ... 6
Road Safety Audits ... 7
Training ... 7
3.2. Systemic Implementation and Spot Location Treatments ... 8
4. Selecting Safety Treatments ...9
4.1. Horizontal Curves ... 10
Install Curve Warning Signs ... 11
Install/Upgrade Curve Warning Signs with Fluorescent Yellow Sheeting ... 12
Double Use of Advanced Warning Signs for Curves or Intersections ... 13
Use of Optical Speed Bars ... 14
Install Chevron Signs ... 15
Install Arrow Signs at Horizontal Curve Locations ... 16
Install Post-Mounted Delineators at Horizontal Curves ... 17
Install Targeted Longitudinal Rumble Strips on the Outside of Horizontal Curves ... 18
Install Icy Curve Warning System ... 19
Improve Superelevation at Horizontal Curve Locations ... 20
Remove Compound Horizontal Curves ... 21
vi
4.2. Intersections (Signalized) ... 23
Improve Traffic Signal Visibility (Larger Diameter Lens or Install Back Plate) ... 24
Provide Intersection Lighting ... 25
Install Pedestrian Signal Heads to Existing Signalized Intersections ... 26
Provide Flashing Beacons at Intersection Approaches ... 27
Use Raised Median to Restrict Turning Movements ... 28
Install Priority Control Systems for Emergency Vehicles ... 29
Provide Advanced Dilemma Zone Detection for Rural High Speed Signalized Approaches ... 30
Implement J-Turns Along a Signalized Corridor ... 31
Install Acceleration or Deceleration Lanes ... 32
Install Right Turn Lane ... 33
Install Left Turn Lane ... 34
Install Offset (or Channelized) Left Turn Lane ... 35
Convert a Traditional Signalized Intersection into a Roundabout ... 36
Reconstruct At-Grade Intersection to Create an Interchange ... 37
4.3. Intersections (Unsignalized) ... 38
Relocate an Existing Stop Bar on Minor Approach ... 40
Install Stop Ahead Pavement Markings ... 41
Install Advanced Intersection Warning Signs ... 42
Provide a Stop Bar on Minor-Road Approaches ... 43
Improve Sight Distance within Sight Triangle ... 44
Provide Upcoming Road Names on Advanced Warning Signs ... 45
Install Retroreflective Strips on Sign Posts ... 46
Upgrade to Larger Stop Signs ... 47
Double Use of Stop Signs ... 48
Improve Sight Distance and Conspicuity at Railroad Grade Crossings ... 49
Install a Splitter Island ... 50
Channelization of Major and Minor Roads (Physical or Painted) ... 51
Provide Intersection Lighting ... 52
Install Dynamic Advanced Intersection Warning System ... 53
vii
Implement Lane Narrowing through Rumble Strips and Painted Median at Rural
Stop-Controlled Approaches ... 55
Provide Flashing Beacons at Intersection Approaches ... 56
Convert Minor Road Stop Control to All-Way Stop Control ... 57
Convert a Traditional Stop-Controlled Intersection into a J-Turn Intersection ... 58
Use Raised Median to Restrict Turning Movements ... 59
Install Acceleration or Deceleration Lanes ... 60
Install Railroad Crossing Hardware and Warning Systems Where They Currently Do Not Exist ... 61
Convert a 4-Leg Intersection into Two 3-Leg Intersections (Offset T-Intersections) ... 62
Install Bypass Lane ... 63
Modify Horizontal and/or Vertical Geometry ... 64
Improve Horizontal Intersection Alignment or Skew ... 65
Install Traffic Signals ... 66
Install Right Turn Lane ... 67
Install Left Turn Lane ... 68
Install Offset (or Channelized) Left Turn Lane ... 69
Install a Roundabout (From Stop-Controlled) ... 70
Remove or Separate an Existing Railroad Grade Crossing ... 71
4.4. Non-motorized User... 72
Provide Crosswalks at Targeted Locations ... 73
Install Pedestrian Signal Heads to Existing Signalized Intersections ... 74
Construct Wildlife Fencing ... 75
Install Rectangular Rapid Flash Beacons ... 76
Build Sidewalks ... 77
Construct Adjacent Shared-Use Paths ... 78
Construct Shared-Use Paved Shoulders for Horse & Buggy Road Users or Bicyclists ... 79
Construct Exclusive Bicycle Lanes ... 80
Install Curb Extensions ... 81
Install or Modify Culverts to Accommodate Wildlife Crossing ... 82
Install Pedestrian Hybrid Beacons or High Intensity Activated Crosswalk (HAWK) ... 83
viii
4.5. Pavement and Shoulder Resurfacing ... 85
Install a Safety Edge ... 86
Install Center Line Rumble Strips ... 87
Install Edge Line or Shoulder Rumble Strips ... 88
Install Transverse Rumble Strips ... 89
Regrade or Recondition Gravel Lanes ... 90
Install Targeted Longitudinal Rumble Strips at Key Locations (Such as on the Outside of Horizontal Curves Only) ... 91
Install or Maintain a Graded Shoulder ... 92
Provide Turnout Areas ... 93
Improve Pavement Friction/Increase Skid Resistance ... 94
Add Paved Shoulder ... 95
Widen Existing Travel Lanes by Two Feet or Less per Lane ... 96
Install Passing or Climbing Lanes ... 97
Increase Shoulder Width ... 98
Improve Superelevation at Horizontal Curve Locations ... 99
4.6. Pavement Marking ... 100
Provide a Stop Bar on Minor Road Approaches ...101
Install Stop Ahead Pavement Markings ...102
Relocate an Existing Stop Bar on Minor Approach ...103
Use of Optical Speed Bars ...104
Install Raised Pavement Markers ...105
Install Edge Line Markings ...106
Install Center Line Markings ...107
Install Wider Pavement Markings (With or Without Rumble Strips) ...108
Implement Lane Narrowing Through Rumble Strips and Painted Median at Rural Stop-Controlled Approaches ...109
Install Center Line and Edge Line Markings ...110
Convert a Four-Lane Two-Way Road into a Three-Lane Road With One Lane in Each Direction of Travel Plus a Continuous Two-Way Left Turn Lane (Road Diet) ...111
Convert a Four-Lane Two-Way Road into a Five-Lane Road with Two Lanes in Each Direction of Travel Plus a Continuous Two-Way Left Turn Lane OR Convert a Two-Lane Two-Way Road into a Three-Lane Road Plus a Continuous Two-Way Left Turn Lane ...112
ix
4.7. Roadside ... 113
Install a Safety Edge ...114
Improve Sight Distance by Controlling Roadside Vegetation ...115
Convert Culvert Headwalls to Traversable End Treatments ...116
Remove Guardrail ...117
Install or Maintain a Graded Shoulder ...118
Relocate Select Hazardous Utility Poles ...119
Install Median Guardrail ...120
Modify End Treatments of Existing Guardrail ...121
Install Impact Attenuation Devices at Select Roadside Hazard Locations (Such as Exposed Bridge Columns) ...122
Remove or Shield Obstacles in Clear Zone ...123
Increase Shoulder Width ...124
Widen Existing Median or Construct Median ...125
Install Median Cable Barrier ...126
Flatten Road Sideslope ...127
Create or Increase Clear Zone ...128
Add Paved Shoulder ...129
Install Concrete Median Barriers ...130
4.8. Signing ... 131
Install/Upgrade Curve Warning Signs with Fluorescent Yellow Sheeting ...132
Install Curve Warning Signs ...133
Install Retroreflective Strips on Sign Posts ...134
Double Use of Advanced Warning Signs for Curves or Intersections ...135
Provide Upcoming Road Names on Advanced Warning Signs ...136
Install Advanced Intersection Warning Signs ...137
Upgrade to Larger Stop Signs ...138
Double Use of Stop Signs ...139
Use of Supplemental Warning Signs ...140
Install Chevron Signs ...141
4.9. Vertical Curves... 142
Install Advanced Intersection Warning Signs ...143
x
Modify Horizontal/Vertical Geometry ...145
Relocate Driveways, Entrances, and Intersections ...146
4.10. Other Treatments ... 147
Mitigate Ground Water to Prevent Ponding and/or Icing ...148
Widen Functionally Obsolete Bridges ...149
5. Safety Management, the Funding Process, and Funding Sources ...150
5.1. Safety Management ... 150
5.1.1. Safety Project Prioritization and Development ...150
5.1.2. Initial and Ongoing Treatment Costs ...150
5.2. The Funding Process ... 151
5.3. Legislation and Funding Sources... 151
5.3.1. Legislation and Federal Funding Sources ...151
5.3.2. Other Funding Sources ...154
5.4. Evaluation ... 154
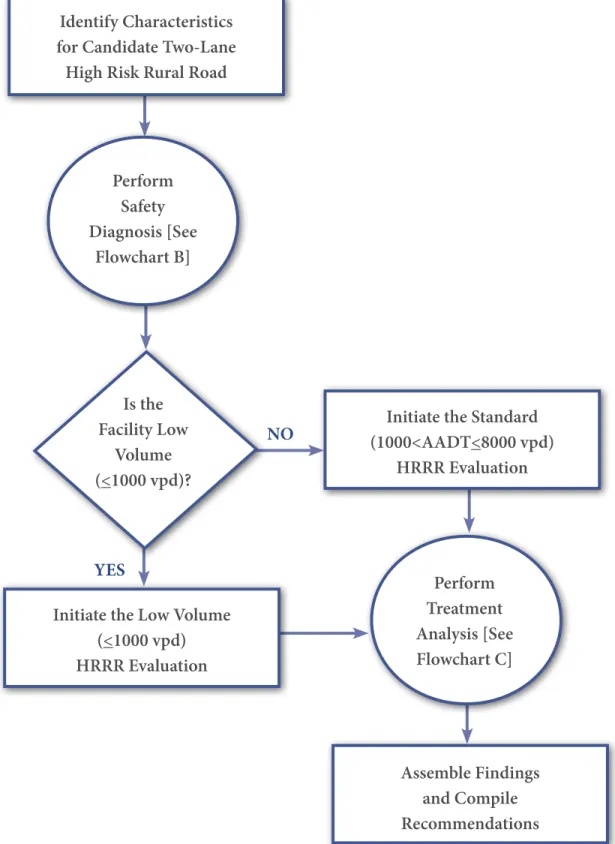
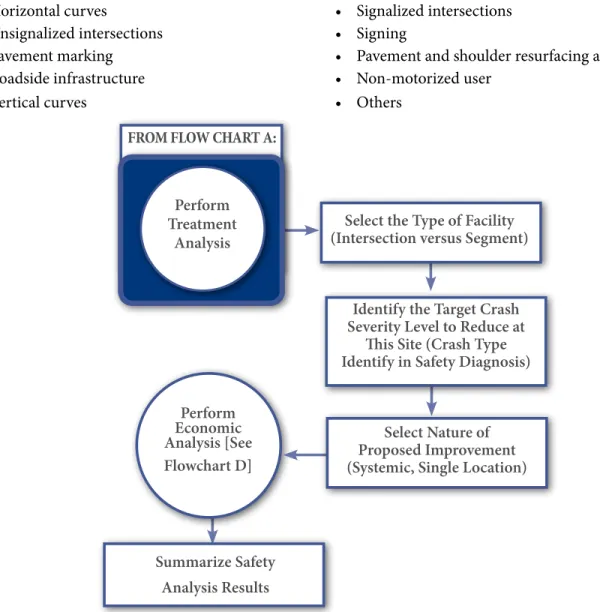
6. Navigating the Safety Treatments ...155
6.1. Identify Study Sites ... 155
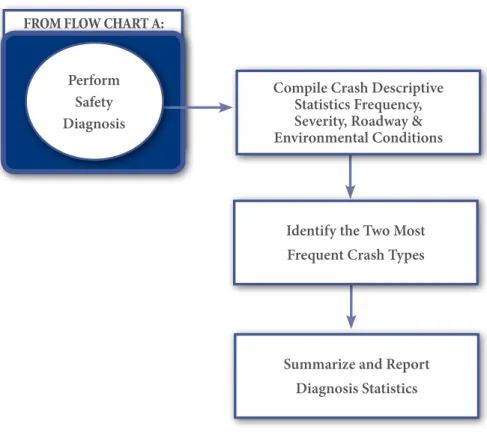
6.2. Perform Safety Diagnosis ... 155
6.3. Initiate Treatment Analysis ... 158
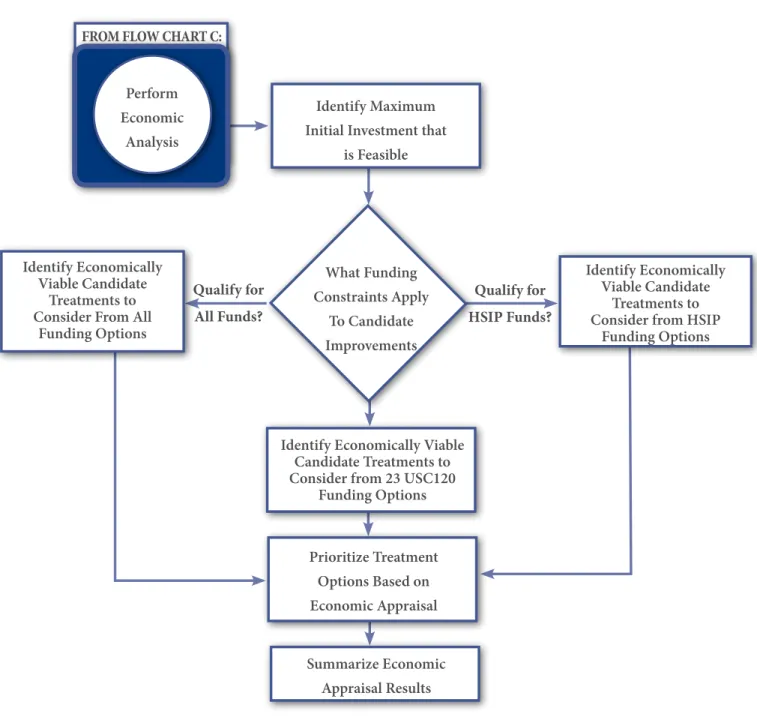
6.4. Perform Economic Analysis ... 159
6.5. Summarize Recommendations ... 160
Glossary ...161
List of Tables
Table 1. Example Treatment Matrix ... 2Table 2. 2010 Rural vs. Urban Collector and Local Road VMT and Fatality Rate Comparison ... 3
List of Figures
Figure 1. Flowchart A – HRRR Safety Enhancement Analysis ...156Figure 2. Flowchart B – Safety ...157
Figure 3. Flowchart C – Treatment Analysis ...158
xi
List of Acronyms
AADT Average Annual Daily Traffic
ADHS Appalachian Development Highway
System
ADT Average Daily Traffic
AASHTO American Association of State Highway and Transportation Officials
BCR Benefit-Cost Ratio
CMF Crash Modification Factor
COG Council of Governments
CRF Crash Reduction Factor
D-CS Detection-Control System
DOT Department of Transportation
FHWA Federal Highway Administration
FLMA Federal Land Management Agency
FLTP Federal Lands Transportation Program
FMCSA Federal Motor Carrier Safety
Administration
HAWK High Intensity Activated Crosswalk
HRRR High Risk Rural Roads
HRRRP High Risk Rural Roads Program
HSIP Highway Safety Improvement Program
HSM Highway Safety Manual
HSP Highway Safety Plan
ITS Intelligent Transportation Systems
km/h kilometers per hour
LED Light Emitting Diode
LTAP Local Technical Assistance Program
MAP-21 Moving Ahead for Progress in the 21st
Century Act
mph miles per hour
MPO Metropolitan Planning Organization
MUTCD Manual on Uniform Traffic Control
Devices
NACE National Association of County Engineers
NACO National Association of Counties
NCHRP National Cooperative Highway Research
Program
NHI National Highway Institute
NHPP National Highway Performance Program
NHS National Highway System
NHTSA National Highway Transportation Safety
Administration
RPC Regional Planning Commission
RPO Regional Planning Organization
RRFB Rectangular Rapid Flash Beacon
RSA Roadway Safety Audit
SAFETEA-LU Safe, Accountable, Flexible Efficient Transportation Equity Act: A Legacy for Users
SHSP Strategic Highway Safety Plan
SLOSSS Suggested List of Surveillance Study Sites
SP&R State Planning & Research
STIP Statewide Transportation Improvement
Program
STP Surface Transportation Program
TAP Transportation Alternatives Program
TIP Transportation Improvement Program
TTAP Tribal Technical Assistance Program
TTP Tribal Transportation Program
TWLTL Two-Way Left Turn Lane
USC United States Code
USDOT United States Department of
Transportation
VMT Vehicle Miles Traveled
xii
ExEcutivE summAry
Transportation agencies across the United States use many treatments to improve safety on high risk rural roads (HRRR). This manual provides information and criteria associated with those improvements including the following:
• Safety benefits;
• Cost-effectiveness comparison of safety treatments;
• Applicability of treatment deployment with respect to identified need;
• Initial and reoccurring maintenance costs associated with treatment installation; and
• Decision-making process for treatment selection.
With the large number of safety treatments available, it can be challenging for practitioners to select the most effective treatment to implement with limited funds. This manual is intended to assist an agency in understanding the effectiveness of safety improvements on HRRR to aid in the treatment selection process.
Practitioners may use this manual to understand the potential use and applicable deployment locations for each treatment presented. The HRRR Treatment Matrix sorts through treatment selection and deployment criteria to identify potential improvements for a site. The manual includes overviews of safety program management, potential funding sources and funding processes, and provides decision-making tools for selecting appropriate safety treatments for given crash types and roadway characteristics.
1
1. introduction
This manual provides information on the costs and benefits of safety treatments on high risk rural roads (HRRR). Agencies can use this manual to determine the following information related to the treatments:
• Safety benefits;
• Cost-effectiveness comparison of safety treatments;
• Applicability of treatment deployment with respect to identified need; and
• Initial and reoccurring maintenance costs associated with countermeasure installation.
In addition, this manual provides information on the decision-making process necessary to identify treatments.
1.1. Purpose
With limited data specific to HRRR, it can be challenging for agencies to effectively use limited funds for treatments on HRRR. The purpose of this manual is to provide a comparison between the cost-effectiveness of safety treatments on HRRR, identify where the treatments may be more effectively used, and present initial and ongoing costs associated with installation. The objective is to assist agencies in finding effective ways to efficiently allocate safety improvement funds on HRRR to achieve a greater reduction in the number and severity of rural roadway crashes.
1.2. How to use this manual
This manual is organized to assist in selection of safety treatments based on roadway feature type (e.g., horizontal curves). The treatments are organized into 10 categories such that treatments can be compared at like locations. The safety treatments are separated into the following sections according to the corresponding roadway feature type and correlate to a color coded tab at the bottom of the page:
Federal Highway Administration | Office of Safety
10 10
4.1. Horizontal curves
Safety improvement treatments on horizontal curves range from low-cost improvements (such as signing) to high-cost improvements (such as modifying road geometry). This section covers safety improvement treatments that can be applied at horizontal curve locations. Some treatments in this section also appear in the sections on intersection improvements, signing, and roadside safety.1920
19 As discussed in Section 1.2, a BCR is only shown where data were available to calculate the ratio. Where data were unavailable, it has been left blank. 20 As stated in NCHRP Series 500 Reports (http://safety.transportation.org/guides.aspx). Proven: The safety effect for other similar applications has shown a proven benefit.
Tried: The treatment has indications that it can be expected to reduce crashes, but has some conflicting reports as to its associated safety effects or has been deployed and observed to be effective. Experimental: New treatments that still need to be tested and for which the safety effect is unknown. Unknown: Not enough is known about an associated safety performance.
SAFE Ty T REA TMENT For mo re inf orma tion, age t p visi C O ST Fre que ncy o f nce (yea tena Main rs) SAFE Ty BENEFIT BENEFIT -C O ST RAT IO 19 Ini tial Im ple menta tion Ongo ing tena Main nce NCHRP 500 Perf orma nce Ratin g Cras h Modifi cati on tor (CMF) Fac Low er V olume*, Optima l Wid th*** Hig her V olume**, l Condi Optima tion s***
Low er V olume*, owe Narr r Condi tion s****
Hig her V olume**, r Condi owe Narr tion s**** In sta ll C ur ve W ar nin g S ig ns 11 $ $ 5 P 0.70 33.8 270.1 43.5 428.4 In sta ll/U pg rade C ur ve W ar nin g S ig ns w ith Fl uo res cen t Y ello w S he et in g 12 $ – 5 P 0.66 63.1 490.4 75.1 739.9 D ou ble U se o f A dva nce d W ar nin g S ig ns f or Cur ves o r I nt er se ct io ns 13 $ T Us e o f O pt ica l S pe ed B ar s 14 $ In sta ll C he vr on S ig ns 15 $$ $ 5 P 0.75 10.6 84.7 13.0 127.7 In stal l A rr ow Si gn s a t H ori zo ntal Cur ve L oc at io ns 16 $$ – 10 P 27.9 222.8 34.1 336.1 In sta ll P os t-m oun te d D elin ea to rs a t H or izo nt al C ur ves 17 $$ – 10 P 5.3 42.4 6.5 63.9 In sta ll T ar get ed L on gi tudina l R um ble S tri ps on t he O utside o f H or izo nt al C ur ves 18 $$ T 0.85 In sta ll I cy C ur ve W ar nin g S ys tem 19 $$ E 0.82 Im pr ov e S up er ele va tio n a t H or izo nt al C ur ve Lo cat io ns 20 $$$$ P Rem ov e C om po un d H or izo nt al C ur ves 21 $$$$$ T M odif y H or izo nt al/V er tic al G eo m et ry 22 $$$$$ P Horizontal Curves C os t: $ = $0 t o $5,000 $$ = $5,001 t o $20,000 $$$ = $20,001 t o $50,000 $$$$ = $50,001 t o $100,000 $$$$$ = $100,001 a nd u p N CHRP 500 P erf orma nc e R at in g 20 P – P ro ven T – T rie d E – E xp er im en ta l U – U nk no w n *L ow er V ol um e ≤1000 vp d **H ig her V ol um e = B et w een 1,001 a nd 8000 vp d ***O pt im al C on di tio ns = 12-f oo t l an es, 6-f oo t p av ed s ho ulder s ****N ar ro w er C on di tio ns = 10-f oo t l an es a nd n o s ho ulder s Color Coded Section Tab Identifier Color Coded Safety Treatment Matrix Safety Treatment Section Title Horizontal Curves Intersections (Signalized) Intersections (Unsignalized) Non-Motorized User
Pavement and Shoulder Resurfacing Pavement Marking Roadside Signing Vertical Curves Safety Treatment Categories Other Treatments References to the treatment pages are hyperlinked
2
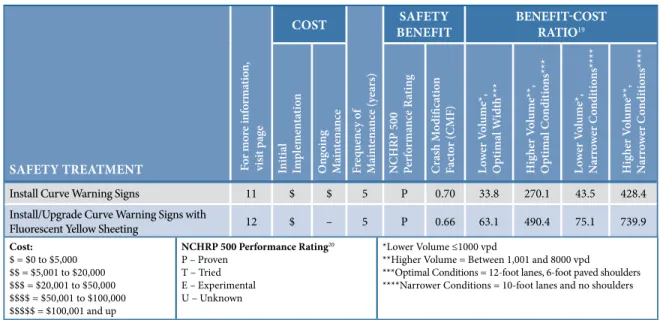
At the beginning of each treatment category section, a treatment matrix provides an overview of benefits and costs associated with each safety improvement in the section. The matrix may be used to help narrow the list of potential treatments by sorting through criteria specific to the practitioner’s needs and available resources. For example, if a practitioner would like to identify an intersection treatment with a maximum initial cost, the matrix can be used to narrow the treatments to only those falling within the maximum range. Figure 1 shows an abbreviated version of the Horizontal Curve Treatment Matrix.
Table 1. Example Treatment Matrix
Safety treatment For mo re inf orma tio n, vi sit p ag e CoSt Fr eq ue nc y o f M ain te na nce (y ea rs) Safety
Benefit Benefit-CoSt ratio19
Ini tia l Im pl eme nta tio n On go in g M ain te na nce N CHRP 500 Pe rf orma nce R atin g Cr as h M odifi ca tio n Fac to r (CMF) Lo we r V ol ume*, O ptima l W id th*** H ig he r V ol ume**, O ptima l C ondi tio ns*** Lo we r V ol ume*, N arr ow er C ondi tio ns**** H ig he r V ol ume**, N arr ow er C ondi tio ns****
Install Curve Warning Signs 11 $ $ 5 P 0.70 33.8 270.1 43.5 428.4 Install/Upgrade Curve Warning Signs with
Fluorescent Yellow Sheeting 12 $ – 5 P 0.66 63.1 490.4 75.1 739.9 Cost: $ = $0 to $5,000 $$ = $5,001 to $20,000 $$$ = $20,001 to $50,000 $$$$ = $50,001 to $100,000 $$$$$ = $100,001 and up nCHrP 500 Performance rating20 P – Proven T – Tried E – Experimental U – Unknown *Lower Volume ≤1000 vpd
**Higher Volume = Between 1,001 and 8000 vpd
***Optimal Conditions = 12-foot lanes, 6-foot paved shoulders ****Narrower Conditions = 10-foot lanes and no shoulders
The users of this manual can follow the decision flow charts in Chapter 6 to determine a range of treatment options based on the resources available to implement a treatment. This manual does not provide a full comprehensive list of every treatment available, and is only a guide to assist an agency in determining a potential range of treatments. An agency should always use an engineering study to determine if a specific treatment would be ideal at a location due to the site characteristics, agency standards, local driving laws, and other factors. In addition, the manual is focused on infrastructure safety improvements. It does not include enforcement, education, or emergency medical services treatments.
This manual only addresses treatments on HRRR, which are limited to rural collectors and rural local roads. While rural roads also include Interstate highways and arterials, those roadways are not addressed in this manual. Treatment costs were identified through a survey of State, local, and Tribal agencies with experience applying safety treatments on HRRR. Resulting treatments costs were averaged and may not be representative of costs required to employ the treatments at each applicable location or costs incurred by each agency.
For each treatment where cost information was provided by agencies in the survey, a benefit cost ratio (BCR) is shown. A BCR value greater than 1.0 reflects a return on investment. For example, a BCR of 2.5 suggests that for every one dollar spent, a $2.50 benefit can be expected. Additional information related to how BCRs for safety treatments are calculated can be found in Section 6.4.
When responding to the survey, agencies did not always provide benefit or cost information for each safety treatment. In these cases, benefits, costs, or BCRs were not included in the HRRR Treatment Matrix.
3
2. HigH risk rurAL roAds ovErviEw
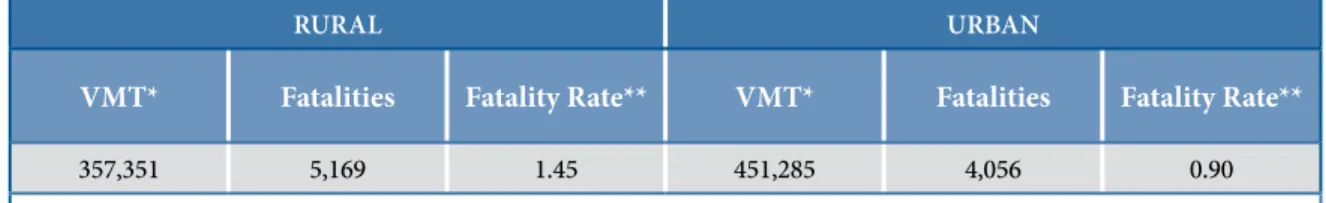
High risk rural roads include rural collectors and rural local roads.1 The fatality rate on rural collectors and rural
local roads is more than 1.5 times higher than the fatality rate on urban collectors and local roads, as shown in
Table 1.2
Table 2. 2010 Rural vs. Urban Collector and Local Road VMT and Fatality Rate Comparison
RURAL URbAN
VMT* Fatalities Fatality Rate** VMT* Fatalities Fatality Rate**
357,351 5,169 1.45 451,285 4,056 0.90
VMT = vehicle miles traveled
* In Millions ** Per 100 Million VMT
Example: To obtain the rural fatality rate, 1.45=(5,169*100)/357,351
2.1. High risk rural road safety
The higher roadway fatality rate on rural roadways is the result of many factors, including the following: The physical characteristics of the
roadways. Many rural roadways
on both the State and local systems lack shoulders and clear zones that provide an area of recovery for roadway departures, which is the most prevalent crash type on these roadways.
Behavioral issues such as higher speeds, reduced seat belt use, and
higher rates of impaired driving.3
On rural routes, the ability to drive at a higher speed is not limited by the congestion found in urban areas. Motorists in rural areas are also more likely to drive while under the influence of alcohol and drugs. Rural areas also exhibit lower seat belt use than urban
areas by nearly 20 percent.4
Increased Emergency Medical Services response time to incidents. When a severe crash occurs, the time it
takes for victims to receive medical care is sometimes a determining factor of the severity of crash-caused injuries. In particular, the “golden hour” (one hour immediately following a roadway crash) is especially important when 1 Per the Safe, Accountable, Flexible, Efficient Transportation Equity Act: A Legacy for Users (SAFETEA:LU) Title 23 Sec. 148 “Highway Safety Improvement Program” and
Moving Ahead for Progress in the 21st Century (MAP-21) Title 23 Sec. 1112 “Highway Safety Improvement Program.”
2 U.S. Department of Transportation, National Highway Traffic Safety Administration, “Traffic Safety Facts 2010,” Rural and Urban Comparison 2010 Data. July 2012. Available at: http://www-nrd.nhtsa.dot.gov/Pubs/811637.pdf.
3 Chandler, B. and R. Anderson, “Implementing the High Risk Rural Roads Program,” March 2010. Available at: http://safety.fhwa.dot.gov/local_rural/training/fhwasa10012/ fhwasa10012.pdf.
4 Strine, T.W., L.F. Beck , J. Bolen, C. Okoro, S. Dhingra, and L. Balluz, “Geographic and Sociodemographic Variation in Self-reported Seat Belt Use in the United States,” Accident Analysis & Prevention, 2010 July; 42(4): 1066-71. Epub 2010 Jan 4.
4
a crash occurs. Due to the reduced likelihood of passers-by witnessing a crash or its effects in rural areas, the distance emergency medical responders often must travel, and the distance between a crash location and the location of a trauma center, the risk of severe injury and fatality outcomes due to crashes on rural roads is high.
Challenges with limited data, safety expertise, and funding. The challenges of identifying safety improvements
are due in part to the limited data available and varying levels of expertise of local agencies. Rural road issues compete for funding against the need for safety and expansion of urban road systems.
Each of these factors present challenges towards solving the fatal and severe crash problem on HRRR.
2.2. challenges of Applying treatments to Hrrr
Nearly 80 percent of HRRR are found on the locally owned road system.5 As of 2012, there were 89,004 local
government units in the United States6 that vary in the size of the engineering staff (including many jurisdictions
with no engineering experience) and their expertise in making safety decisions. The financial responsibility for installing safety treatments in many locations is borne by the local agency, and competing community priorities may affect investment for upgrades in roadway safety.
Because local agencies maintain many of the HRRR, their challenges are important and include the following:
Insufficient Funding. Local transportation agencies often lack the funds needed to implement projects. Local
agencies are often unfamiliar with the requirements of the State’s Federal-aid funding application process,
procurement process, and Federal-aid requirements related to construction. In other cases a local agency may not be able to pay for the required matching funds or finance the upfront cost of the project prior to reimbursement. In addition, competition from the large number of local agencies for State or Federal funds can sometimes make it difficult to secure necessary safety funding.
Potential solutions: It is important to establish effective means of communication and coordination between
the local agencies and State DOTs so that local agencies can engage the State to best target available funds. Coordination between State and local agencies can include the State training local agencies about available funds for HRRR and educating them on how to apply.
Lack of Technical Expertise. Many local agencies have found it
difficult to identify and select safety treatments, as local agencies are often structured differently than the State DOT and may not have a dedicated safety program with funding or dedicated staff. A single local agency staff member with responsibility for roadway safety may also play several roles within the local agency. When safety technical expertise is limited, local agencies may be unable to select the most appropriate solutions.
Potential solutions: Local Technical Assistance Program (LTAP)- and Tribal Technical Assistance Program
(TTAP)-led training and technical workshops covering low-cost safety improvements on HRRR and HSIP processes can support HRRR efforts by offering technical training to local and Tribal agencies related to safety data and safety management programs and by providing information on problem identification and safety improvement implementation.
5 FHWA, Developing Safety Plans: A Manual for Local Rural Road Owners, FHWA-SA-12-017 (Washington, DC: March 2012). Available at: http://safety.fhwa.dot.gov/local_
rural/training/fhwasa12017/.
5
In addition to the potential solutions listed previously, several State and local agencies have developed innovative contracting strategies to apply funding quickly and efficiently on high risk rural roads. These agencies have taken the following actions:
• Used public forces for labor and bulk materials purchases to more efficiently use funds on HRRR.
• Initiated on-call contracts that have decreased the amount of time that elapses between project selection and
completion.
• Augmented DOT staffing with outside resources for data analysis, problem identification, project selection,
and administration.7
• Used special safety program coordinators at the State DOT district and local levels.
• Maintained websites with helpful HRRR-related information for locals.
For additional information related to funding resources and process, see Sections 5.2 and 5.3. More discussion related to identifying HRRR safety issues, even with limited data, is found in Sections 3.1 and 3.2, while assistance in navigating the process for identifying appropriate safety treatments is in Section 6.
Lack of Data. In addition to a lack of funds and technical expertise can be a lack of
understanding of which roadway and crash data are important to capture and how to go about the collection and evaluation process.
Potential solutions: Agencies can use the limited data available, regardless of how small or incomplete the data
set, to help determine a course of action. Data may include finite numerical values (quantitative data) or may come from conversations with law enforcement personnel and field staff to determine the types, contributing circumstances, and times of crashes that occur at specific locations (qualitative data). While specific volume data may not be available, agencies may be able to prioritize corridor-wide implementation by dividing roadways into low-, medium-, and high-volume categories.
3. idEntifying sAfEty trEAtmEnts
This chapter discusses several tools that can be used to identify and select safety treatments and presents the differences between the traditional methods of treating “spot” locations versus a systemic approach.
3.1. tools for identifying Hrrr safety issues
Technical expertise is cited as one of the most significant obstacles facing agencies when attempting to identify and implement safety treatments. Fortunately, many safety tools and opportunities for training exist for State and local transportation agencies. This section describes safety tools to assist with safety needs identification, use of available data—however limited—to make informed decisions with respect to selecting treatments, and additional resources and training opportunities.
7 FHWA, Implementing the High Risk Rural Roads Program, “Chapter 4. State Practices for Implementation,” FHWA-SA-10-012 (Washington, DC: March 2010). Available at:
6
Highway Safety Manual
The Highway Safety Manual (HSM) “Frequently Asked Questions” page describes the manual as providing: “... practitioners with information and tools to consider safety when making decisions related to design and operation of roadways. The HSM assists practitioners in selecting countermeasures and prioritizing projects, comparing alternatives, and quantifying and predicting the safety performance of roadway elements
considered in planning, design, construction, maintenance, and operation.”8
The HSM uses data to estimate the safety impacts of incorporating safety features for existing roads or future projects by determining the impacts of design and other decisions on the expected safety performance of a facility.
Safety Analyst
The Safety Analyst tool assists in making site-specific safety improvement recommendations that involve physical
modifications to the roadway, either through systemic or spot location applications. As spot locations are being examined, the tool can help to identify crash patterns at specific locations and determine whether those crash types are overrepresented and the frequency at which crashes occur. The tool can help to identify opportunities for
systemic solutions by identifying overrepresented crashes and clusters for highway segments or intersection types.9
Safety Analyst has the following capabilities to aid practitioners in each step of the safety management process,
from needs identification to implementation and evaluation:
• A system-wide screening tool identifies potential sites for safety improvements.
• A diagnostic tool detects the nature of safety problems at specific sites.
• A countermeasure selection tool assists users in selecting safety treatments to reduce crash frequency and
severity at spot locations.
• An economic appraisal tool performs a financial assessment of a specific countermeasure or several
alternative countermeasures for a specific site.
• A priority ranking tool provides a prioritized listing of sites and proposed improvements based on benefit and
cost estimates determined by the economic appraisal tool.
• The evaluation tool assists practitioners in conducting before-and-after evaluations of implemented safety
improvements.
Crash Modification Factor (CMF) Clearinghouse
The CMF Clearinghouse website10 provides a collection of calculated crash modification factors practitioners can
apply to estimate the benefits of specific safety treatments. The website can be used by searching for a particular treatment name, which can be further refined by crash type or severity, roadway or intersection type, area type (e.g., urban, suburban, rural), and intersection geometry. Each safety improvement in the clearinghouse shows a CMF and Crash Reduction Factor (CRF), in addition to the quality or rating of the CMF. The quality
rating indicates the quality or confidence in the results of the study producing the CMF.11 CMFs and CRFs are
accompanied with details of the research conducted to develop the CMF.
8 AASHTO, “Highway Safety Manual-Related Frequently Asked Questions (FAQs),” last modified June 14, 2013, http://www.highwaysafetymanual.org/support.aspx. 9 Safety Analyst website, accessed October 9, 2013. http://www.safetyanalyst.org/.
10 CMF Clearinghouse website, accessed October 9, 2013. http://www.cmfclearinghouse.org.
7
Road Safety Audits
A Road Safety Audit (RSA) is the formal safety performance examination of an existing or future road or intersection by an independent, multidisciplinary team. It qualitatively estimates and reports on potential road
safety issues and identifies opportunities for improvements in safety for all road users.12 RSAs can be integrated
into the project development process for new roads and intersections, on existing roads and intersections, and for future or existing work zones.
For HRRR, the multidisciplinary team’s expertise can include those familiar with rural issues, law
enforcement officers, emergency service providers, human factors experts, and engineering fields including design, traffic safety, operations and maintenance, and others. The team assesses site-specific conditions and recommends improvements based on the team’s road safety expertise in each member’s respective fields. RSAs can help to reduce crash severity and frequency while accounting for all road users. If performed during the design phase, RSAs serve as a proactive approach to improving safety before construction begins.
Training
Opportunities for and depth of training vary based on the agency’s need. Practitioners can inquire about training based on their own specific needs beginning with the following resources:
• Local Technical Assistance Programs (LTAP) and Tribal Technical Assistance Programs (TTAP). LTAPs
and TTAPs are a great technical resource and regularly provide training opportunities on many program areas. For more information, a visit to the national LTAP website can direct practitioners toward the LTAP or
TTAP in their area.13
• Highway Safety Manual. The HSM website Training Page has information on HSM courses currently
available.14 The National Highway Institute (NHI) offers courses related to the HSM.15 For more information
State and local departments of transportation can contact their FHWA Division Office for training assistance.
• Road Safety Audits. FHWA provides technical assistance and trainings for RSAs. For more information, see
FHWA’s RSA website.16
• National Association of County Engineers (NACE) and National Association of Counties (NACO).
NACE and NACO convene regularly, on both regional and national levels. The association is a forum for county engineers and staff to discuss safety and other issues related to the local road system. More
information can be found on the NACE and NACO websites.17,18
12 FHWA Road Safety Audit website. Accessed October 9, 2013. http://safety.fhwa.dot.gov/rsa/.
13 Local and Tribal Technical Assistance Program website, accessed December 3, 2013. http://www.ltap.org/.
14 Highway Safety Manual Training website, accessed December 3, 2013. http://www.highwaysafetymanual.org/Pages/Training.aspx. 15 National Highway Institute website, accessed December 3, 2013. https://www.nhi.fhwa.dot.gov/default.aspx.
16 FHWA Road Safety Audit website, accessed December 3, 2013. http://safety.fhwa.dot.gov/rsa.
17 National Association of County Engineers website, accessed December 3, 2013. http://www.countyengineers.org. 18 National Association of Counties website, accessed December 3, 2013. http://www.naco.org.
8
3.2. systemic implementation and spot Location treatments
A challenge in addressing safety in rural areas is that crashes tend to be widely dispersed geographically. The high number of lane miles and the dispersed nature of crashes make it difficult to target specific locations for assessment and improvement. Therefore, applying a systemic approach to addressing safety issues is a beneficial method for proactively addressing widespread safety concerns and cost-effectively minimizing crash potential. Rather than focus on specific crash locations, a systemic approach targets common risk factors in crashes throughout the roadway network. A systemic improvement is widely implemented based on high-risk roadway features that are correlated with particular crash types rather than location-based crash frequency. The systemic problem identification entails a system-wide crash analysis targeting specific crash characteristics at the system level.
Systemic solutions can reduce overall severe crashes of certain types in a jurisdiction more effectively than choosing a small number of spot locations. This approach allows an agency to compensate for incomplete and lower quality crash history or roadway data, as it is less vital for that information to be perfect when many locations or segments are addressed with low-cost treatments.
With the systemic approach, implementation must be widespread enough to make a region-wide impact.
Additionally, it can sometimes be difficult to convince stakeholders to apply safety treatments (even if low-cost) at locations that do not have a history of crashes.
Traditionally, a common approach has been to identify “black spots,” or locations with the highest crash frequency. While specific implementation sites are easily identified using roadway and crash data, this approach does not adequately deal with the randomness of the location of fatal and severe injury crashes. The traditional approach does not directly account for the most prevalent risk types associated with system-wide crashes.
This manual presents safety treatments that can be applied systemically, specifically at spot locations, or using both implementation methods.
For additional information on spot location and systemic safety treatment installations, please visit the following resources:
• A Systemic Approach to Safety: Using Risk to Drive Action.
Available at: http://safety.fhwa.dot.gov/systemic/index.htm
• Roadway Safety Information Analysis: A Manual for Local Rural Road Owners.
4. sELEcting sAfEty trEAtmEnts
This chapter features safety improvements used on HRRR that were identified by a survey of State, local, and Tribal agencies. The treatments are separated by section under the following categories. Each category has a color coded tab on the bottom of the page to assist with locating specific sections:
9
Applicability of “Urban” Treatments to HRRR
Several agencies identified treatments used on high risk rural roads even though the treatments are typically viewed as treatments used in urban areas. In these cases, the functional classification of a HRRR did not change when the road passed through a small city or town and was still classified as rural. These treatments include, but are not limited to:
• Shared-used paths adjacent to the roadway;
• Shoulders for non-motorized users;
• Exclusive bicycle lanes;
• Bicycle trail grade separation structures;
• Sidewalks;
• Crosswalks at targeted locations;
• Pedestrian hybrid beacons (or high intensity activated crosswalk, known as HAWK)
• Rectangular rapid flash beacons;
• Staggered and raised median islands;
• Curb extensions; and
• Pedestrian signal heads added to existing signalized intersections.
Horizontal Curves Intersections (Signalized) Intersections (Unsignalized) Non-Motorized User
Pavement and Shoulder Resurfacing
Pavement Marking Roadside
Signing Vertical Curves Other Treatments
10 10
4.1. Horizontal curves
Safety improvement treatments on horizontal curves range from low-cost improvements (such as signing) to high-cost improvements (such as modifying road geometry). This section covers safety improvement treatments that can be applied at horizontal curve locations. Some treatments in this section also appear in the sections on
intersection improvements, signing, and roadside safety.1920
19 As discussed in Section 1.2, a BCR is only shown where data were available to calculate the ratio. Where data were unavailable, it has been left blank.
20 As stated in NCHRP Series 500 Reports (http://safety.transportation.org/guides.aspx). Proven: The safety effect for other similar applications has shown a proven benefit. Tried: The treatment has indications that it can be expected to reduce crashes, but has some conflicting reports as to its associated safety effects or has been deployed and observed to be effective. Experimental: New treatments that still need to be tested and for which the safety effect is unknown. Unknown: Not enough is known about an associated safety performance.
SAFE Ty T REA TMENT For mo re inf orma tion, age t p visi C O ST Fre que ncy o f nce (yea tena Main rs) SAFE Ty BENEFIT BENEFIT -C OS T RAT IO 19 Ini tial Im ple menta tion Ongo ing tena Main nce NCHRP 500 Perf orma nce Ratin g Cras h Modifi cati on tor (CMF) Fac Low er V olume*, l Condi Optima tion
s***
Hig her V olume**, l Condi Optima tion
s***
Low er V olume*, owe Narr r Condi
tion s****
Hig her V olume**, r Condi owe Narr tion s**** In sta ll C ur ve W ar nin g S ig ns 11 $ $ 5 P 0.70 33.8 270.1 43.5 428.4 In sta ll/U pg rade C ur ve W ar nin g S ig ns w ith Fl uo res cen t Y ello w S he et in g 12 $ – 5 P 0.66 63.1 490.4 75.1 739.9 D ou ble U se o f A dva nce d W ar nin g S ig ns f or Cur ves o r I nt er se ct io ns 13 $ T Us e o f O pt ica l S pe ed B ar s 14 $ In sta ll C he vr on S ig ns 15 $$ $ 5 P 0.75 10.6 84.7 13.0 127.7 In stal l A rr ow Si gn s a t H ori zo ntal Cur ve L oc at io ns 16 $$ – 10 P 27.9 222.8 34.1 336.1 In sta ll P os t-M oun te d D elin ea to rs a t H or izo nt al C ur ves 17 $$ – 10 P 5.3 42.4 6.5 63.9 In sta ll T ar get ed L on gi tudina l R um ble S tri ps on t he O utside o f H or izo nt al C ur ves 18 $$ T 0.85 In sta ll I cy C ur ve W ar nin g S ys tem 19 $$ E 0.82 Im pr ov e S up er ele va tio n a t H or izo nt al C ur ve Lo cat io ns 20 $$$$ P Rem ov e C om po un d H or izo nt al C ur ves 21 $$$$$ T M odif y H or izo nt al/V er tic al G eo m et ry 22 $$$$$ P Horizontal Curves C os t: $ = $0 t o $5,000 $$ = $5,001 t o $20,000 $$$ = $20,001 t o $50,000 $$$$ = $50,001 t o $100,000 $$$$$ = $100,001 a nd u p N CHRP 500 P erf orma nc e R at in g 20 P – P ro ven T – T rie d E – E xp er im en ta l U – U nk no w n *L ow er V ol um e ≤1000 vp d **H ig her V ol um e = B et w een 1,001 a nd 8000 vp d ***O pt im al C on di tio ns = 12-f oo t l an es, 6-f oo t p av ed s ho ulder s ****N ar ro w er C on di tio ns = 10-f oo t l an es a nd n o s ho ulder s
11 Install Curve Warning Signs 11
Install Curve Warning Signs
Some of the most serious crashes on rural roads occur at horizontal curves. Horizontal alignment signs,
informally called curve warning signs, can improve safety by alerting drivers to changes in roadway geometry that may not be apparent or expected. These signs provide visual information for the driver about the nature of the curve they are approaching, letting them know whether it’s a gradual curve, a sharp turn, a hairpin turn, or some combination. Different types of curve warning signs are identified in the MUTCD.
Where to Use: Curve warning signs should be applied
to any curve or turn with a history of roadway departure crashes and curves or turns with similar geometry or traffic volumes yet to experience crashes. According to the 2009 MUTCD, warning signs are required on curves or turns where the advisory speed is 10 mph less than the posted speed.
Studies have shown that reductions in crashes due to the installation of curve warning signs are more prominent at locations with higher traffic volumes, sharper curves, or hazardous roadsides.
Top Recommended Resources:
1. University of California, Berkley, Institute of Transportation Studies, Technology Transfer Program, Tech
Transfer Newsletter, “Signs for Curves and Turns.” Available at:
http://www.techtransfer.berkeley.edu/newsletter/08-2/signs-for-curves-and-turns.php.
2. FHWA, Roadway Departure Safety: A Manual for Local Rural Road Owners, January 2011. Available at:
http://safety.fhwa.dot.gov/local_rural/training/fhwasa1109/fhwasa1109.pdf. Install Curve Warning Signs
- Initial Investment: $2,400
- Cost of Maintenance: $1,280
- Frequency of Maintenance: 5 years
Benefit-Cost Ratio NCHRP 500 Performance Rating Crash Modification Factor (CMF)
Lower Volume Optimal Conditions 33.8 Proven 0.70 Higher Volume Optimal Conditions 207.1 Proven 0.70 Lower Volume Narrower Conditions 43.5 Proven 0.70 Higher Volume Narrower Conditions 428.4 Proven 0.70
12 12
Install/Upgrade Curve Warning Signs with Fluorescent Yellow Sheeting
Fluorescent yellow sheeting can improve the effectiveness of curve warning and delineation signs by increasing the conspicuity, or prominent visibility, of the sign, especially during dark conditions.
Where to Use: Connecticut DOT used fluorescent
yellow sheeting to improve signing at horizontal curves between 2002 and 2006. These curves were selected through a regular program called the Suggested List of Surveillance Study Sites (SLOSSS), which uses crash data, traffic volumes, and roadway characteristics to identify intersections and road segments with higher than expected crash rates.
Top Recommended Resource:
1. FHWA, Safety Evaluation of Improved Curve Delineation, September 2009. Available at:
http://www.fhwa.dot.gov/publications/research/safety/09045/09045.pdf Install/Upgrade Curve Warning Signs with
Fluorescent yellow Sheeting
- Initial Investment: $1,280
- Cost of Maintenance: n/a
- Frequency of Maintenance: 5 years (2 applications)
Benefit-Cost Ratio NCHRP 500 Performance Rating Crash Modification Factor (CMF)
Lower Volume Optimal Conditions 63.1 Proven 0.66 Higher Volume Optimal Conditions 490.4 Proven 0.66 Lower Volume Narrower Conditions 75.1 Proven 0.66 Higher Volume Narrower Conditions 739.9 Proven 0.66
13 13
Double Use of Advanced Warning Signs for Curves or Intersections
Doubling the use of either Intersection Ahead warning signs or Curve Ahead warning signs (i.e., on the left and right) is recommended for locations where the crash rates have not been reduced after installation of a single advanced warning sign.
Where to Use: This treatment may be used at locations where crashes indicate that motorists do not heed existing
advanced warning signs and additional conspicuity is needed.
Top Recommended Resource:
1. FHWA, Low Cost Treatments for Horizontal Curve Safety, December 2006. Available at:
http://safety.fhwa.dot.gov/roadway_dept/horicurves/fhwasa07002/.
Safety Treatment Implementation Initial
Cost
NCHRP 500 Performance
Rating
Double Use of Advanced Warning Signs $0 to $5,000 Tried
14 14
Use of Optical Speed Bars
Optical speed bars are transverse stripes spaced at gradually decreasing distances. The rationale for using them is to increase drivers’ perception of speed and cause them to reduce speed, which can be helpful near intersections or horizontal curves. The Optical speed bar name comes from this intended visual effect on drivers’ speed as they react to the spacing of the painted lines. These white transverse stripes are 18 inches long and 12 inches wide. The preferred material is thermoplastic because of the exposure to traffic volume over time.
Where to Use: This treatment may be used at locations where speed reductions are needed, such as near
intersections and horizontal curves.
Top Recommended Resource:
1. FHWA, Low Cost Treatments for Horizontal Curve Safety, December 2006. Available at:
http://safety.fhwa.dot.gov/roadway_dept/horicurves/fhwasa07002/.
Safety Treatment Implementation Initial
Cost
Use of Optical Speed Bars $0 to $5,000
15 15
Install Chevron Signs
Chevron signs (or curve delineation signs) indicate to drivers the alignment of the roadway when they are within the actual horizontal alignment of a curve. The signs show the shape and degree of curvature, and they guide drivers through the entire curve or turn.
Where to Use: Chevrons should be installed at any
curve or turn with a history of roadway departure crashes and at curves or turns with similar geometry or traffic volume yet to experience crashes. According to the 2009 MUTCD, alignment delineation (or a single-directional large arrow) is required on curves or turns where the advisory speed is 15 mph less than the posted speed limit. They can be installed at locations where no chevrons currently exist, or to supplement chevrons that are already in place.
Top Recommended Resource:
1. FHWA, Roadway Departure Safety: A Manual for Local Rural Road Owners, January 2011. Available at:
http://safety.fhwa.dot.gov/local_rural/training/fhwasa1109/fhwasa1109.pdf. Install Chevron Signs
- Initial Investment: $7,200
- Cost of Maintenance: $3,600
- Frequency of Maintenance: 5 years
Benefit-Cost Ratio NCHRP 500 Performance Rating Crash Modification Factor (CMF)
Lower Volume Optimal Conditions 10.6 Proven 0.75 Higher Volume Optimal Conditions 84.7 Proven 0.75 Lower Volume Narrower Conditions 13.0 Proven 0.75 Higher Volume Narrower Conditions 127.7 Proven 0.75
16 16
Install Arrow Signs at Horizontal Curve Locations
The One-Direction Large Arrow sign is used to define a change in horizontal alignment. It can be used alone or to supplement other curve warning signs, such as chevrons.
Where to Use: The sign is typically placed on
the outside of the curve directly in line with the approaching tangent section. The MUTCD guidance regarding the application of this sign is to install either the One-Direction Large Arrow sign or the Chevron Alignment sign when the Hairpin Curve sign or the Loop sign is installed. Based on standard practice, this sign is limited to sharper curves (turns). It should not be used when there is no advisory speed plaque.
Top Recommended Resource:
1. FHWA, Low Cost Treatments for Horizontal Curve Safety, December 2006. Available at:
http://safety.fhwa.dot.gov/roadway_dept/horicurves/fhwasa07002/. Install Arrow Signs at Horizontal Curve Locations
- Initial Investment: $5,600
- Cost of Maintenance: n/a
- Frequency of Maintenance: 10 years
Benefit-Cost Ratio
NCHRP 500 Performance
Rating
Lower Volume Optimal Conditions 27.9 Proven Higher Volume Optimal Conditions 222.8 Proven Lower Volume Narrower Conditions 34.1 Proven Higher Volume Narrower Conditions 336.1 Proven
17 17
Install Post-Mounted Delineators at Horizontal Curves
When used within horizontal curves, post-mounted delineators with
retroreflective sheeting the full length of the post improves driver lane position both at the entry to the curve and at its midpoint.
Where to Use: For best results,
post-mounted delineators are to be installed on each chevron support post and coupled with edge line and center line pavement markings.
Top Recommended Resource:
1. FHWA, Low Cost Treatments for Horizontal Curve Safety, December 2006. Available at:
http://safety.fhwa.dot.gov/roadway_dept/horicurves/fhwasa07002/. Install Post-Mounted Delineators at Horizontal Curves
- Initial Investment: $5,600
- Cost of Maintenance: n/a
- Frequency of Maintenance: 10 years
Benefit-Cost Ratio
NCHRP 500 Performance
Rating
Lower Volume Optimal Conditions 5.3 Proven Higher Volume Optimal Conditions 42.4 Proven Lower Volume Narrower Conditions 6.5 Proven Higher Volume Narrower Conditions 63.9 Proven
18 18
Install Targeted Longitudinal Rumble Strips on the Outside of Horizontal Curves
Shoulder or edge line milled rumble strips can be used on roads with a history of roadway departure crashes. While it is recommended that rumble strips be applied systematically along an entire route instead of only at spot locations, where appropriate, they can be used on the outside of horizontal curves and the tangent leading to the curves.
Where to Use: This treatment may be used at
horizontal curve locations with a high frequency of roadway departure crashes.
Top Recommended Resource:
1. FHWA, Low Cost Treatments for Horizontal Curve Safety, December 2006. Available at:
http://safety.fhwa.dot.gov/roadway_dept/horicurves/fhwasa07002/.
Safety Treatment Implementation Initial
Cost NCHRP 500 Performance Rating Crash Modification Factor (CMF)
Install Targeted Longitudinal Rumble Strips on the
Outside of Horizontal Curves $5,001 to $20,000 Tried 0.85
19 19
Install Icy Curve Warning System
Icy curve warning systems may be installed at problematic areas where ice formation frequently recurs. Using in-pavement weather sensors, icy curve warning signs are activated to alert motorists of upcoming icy conditions.
Where to Use: This treatment may be useful in locations that experience
recurring icy conditions, such as horizontal curves located in mountain passes.
Top Recommended Resource:
1. Ye, Z., D. Veneziano, and I. Turnbull, Safety Effects of Icy Curve Warning Systems, 2012. Available at:
http://www.westernstates.org/projects/coats/Documents/TRB2012/Fredonyer%20ICWS_TRB%20Safety%20 Paper_2012-1-23_FINAL.pdf.
Safety Treatment Implementation Initial
Cost NCHRP 500 Performance Rating Crash Modification Factor (CMF)
Install Icy Curve Warning System $5,001 to $20,000 Experimental 0.82
20 20
Improve Superelevation at Horizontal Curve Locations
Superelevation is the rotation of the pavement on the approach to and through a horizontal curve and is intended to assist the driver in negotiating the curve by counteracting the lateral acceleration produced by tracking. In other words, the road is designed so that the pavement rises as it curves, offsetting the horizontal sideways momentum of the approaching vehicle.
Where to Use: Superelevation is expressed as a decimal representing the ratio of the pavement slope to width,
ranging from 0 to 0.12 feet. The adopted criteria allow for the use of maximum superelevation rates from 0.04 to 0.12. Maximum superelevation rates for design are established by policy by each State. Selection of a maximum superelevation rate is based on several variables, such as climate, terrain, highway location (urban vs. rural),
and frequency of very slow-moving vehicles. Specific guidance on superelevation rates can be found in A Policy
on Geometric Design of Highways and Streets, AASHTO, 2011 and Guidelines for Geometric Design of Very
Low‑Volume Local Roads (ADT ≤ 400), AASHTO, 2001.
Top Recommended Resources:
1. FHWA, Mitigating Strategies for Design Exceptions, July 2007. Available at:
http://safety.fhwa.dot.gov/geometric/pubs/mitigationstrategies/.
2. NCHRP Project 17-18(3), Strategy 15.2 A12: Improve or Restore Superelevation (P). Available at:
http://safety.transportation.org/htmlguides/horz_crvs/default.htm.
3. AASHTO, Guidelines for Geometric Design of Very Low‑volume Local Roads (ADT 400), January 2001.
4. AASHTO, A Policy on Geometric Design of Highways and Streets, November 2011.
Safety Treatment Implementation Initial
Cost
NCHRP 500 Performance
Rating
Improve Superelevation at Horizontal Curve Locations $50,001 to $100,000 Proven
21 21
Remove Compound Horizontal Curves
Drivers typically expect a single steering setting while negotiating a horizontal curve. Replacing compound curves with a single radius curve better adheres to driver expectations.
Where to Use: This treatment may be used on HRRR with locations
of compound horizontal curves that experience a high frequency of roadway departure crashes. This treatment is especially applicable where other treatments have been applied at the curve location and have not been successful in reducing crashes.
Safety Treatment Implementation Initial
Cost
NCHRP 500 Performance
Rating
Remove Compound Horizontal Curves $100,001 and up Tried
Remove Compound Horizontal Curves
Top Recommended Resource:
1. NCHRP Project 17-18(3), Strategy 15.2 A13: Modify Horizontal Alignment (P). Available at:
22 22
Modify Horizontal/Vertical Geometry
Horizontal and vertical geometry may be reconstructed in a variety of ways. For example, horizontal and vertical curves may benefit from increased radii, thereby increasing sight distance. Modifying road geometry may also include eliminating horizontal or vertical curves and providing a more direct alignment.
Where to Use: This treatment may be used at locations
where improved sight distance is needed and at locations that experience head-on collisions and run-off-road crashes.
Top Recommended Resource:
1. NCHRP Project 17-18(3), Strategy 15.2 A13: Modify Horizontal Alignment (P). Available at:
http://safety.transportation.org/htmlguides/horz_crvs/default.htm.
Safety Treatment Implementation Initial
Cost
NCHRP 500 Performance
Rating
Modify Horizontal/Vertical Geometry $100,001 and up Proven
23
4.2. intersections (signalized)
Signalized intersection-specific safety treatments assist drivers in recognizing they are at or approaching
signal-controlled intersecting routes, provide storage for turning traffic,21 and give positive guidance to motorists
through the intersection.2 3
21 Turn lane storage is the length of turn lane provided based on anticipated traffic needs.
22 As discussed in Section 1.2, a BCR is only shown where data were available to calculate the ratio. Where data were unavailable, the BCR has been left blank.
23 As stated in NCHRP Series 500 Reports (http://safety.transportation.org/guides.aspx). Proven: The safety effect for other similar applications has shown a proven benefit. Tried: The treatment has indications that it can be expected to reduce crashes, but has some conflicting reports as to its associated safety effects or has been deployed and observed to be effective. Experimental: New treatments that still need to be tested and for which the safety effect is unknown. Unknown: Not enough is known about an associated safety performance.
SAFE Ty T REA TMENT For mo re inf orma
tion, age t p visi
C O ST Fre que ncy o f nce (yea tena Main rs) SAFE Ty BENEFIT BENEFIT - C OS T RAT IO 22 Ini tial Im ple menta tion Ongo ing tena Main nce NCHRP 500 Perf orma nce Ratin g Cras h Modifi cati on tor (CMF) Fac Low er V olume* Hig her V olume** Im pr ov e T ra ffic S ig na l V isi bi lity (L ar ger Di am et er L en s or I ns ta ll B ac k P lat e) 24 $ P 0.85 Pr ov ide I nt er se ct io n L ig ht in g 25 $$ $ 1 P 0.41 -0.88 26.9 93.8 In sta ll P edes tri an S ig na l H ead s t o E xi stin g S ig na liz ed In te rs ec tio ns