THE ECONOMIC VALUE OF CLICKSTREAM DATA
FROM AN ADVERTISER’S PERSPECTIVE
Nottorf, Florian and Funk, Burkhardt
Leuphana Universit¨at L¨uneburg, Scharnhorststraße 1, 21335 L¨uneburg,
{nottorf, funk}@uni.leuphana.de
Abstract
With the increasing share of online advertising, the amount of highly detailed data available on an in-dividual consumer level has substantially increased over the last few years. Because there are costs associated with collecting, analyzing, and storing this type of data, it is important to understand the value of this specific type of personal data. In this paper, we illustrate the economic value of clickstream data by highlighting the direct and interaction effects of multiple types of online advertising on an in-dividual user-level. By developing a binary logit model with Bayesian estimation techniques to predict consumer behavior and by analyzing clickstream data from a large financial service provider, we find strong differences in the effects of repeated ad exposures. Along with uncovering important insights, such as the positive cross-channel effects of display and paid search advertising, which are important when managing online advertising campaigns, we demonstrate how the value of clickstream data can be estimated to support decision-making in the emerging context of real-time bidding (RTB).
keywords: personal data valuation, clickstream analysis, online advertising efficiency, consumer be-havior, Bayesian estimation
1
Introduction
By the 1960s and 1970s, the value of personal data had already been recognized. Since then, it has been a matter of debate whether data privacy leads to market inefficiencies as was argued by the Chicago School (Posner, 1978, 1981) or whether it might increase economic welfare (Hermalin and Katz, 2006). However, it is clear that the benefits and costs of disclosing and collecting personal data differ between the two major stakeholders involved: (i) data subjects, who protect or disclose their data, and (ii) data holders, who collect, analyze, and leverage personal data for their economic activities (Acquisti, 2010). While data subjects disclosing personal data might profit from targeted offerings, be it products, services, or personalized information (Varian, 1996), the potential advantages for the data holders encompass increased revenues through price discrimination using personal data (Acquisti and Varian, 2005) and efficiency gains (e.g., increased advertising efficiency). In this paper, we focus on the latter and show how a company investing in online advertising can estimate the value of clickstream data.
In the last decade, the options for online advertising have become increasingly complex, leading to the necessity of making sophisticated decisions. At the same time, new technologies offer companies the potential to “follow‘” individual users across multiple types of online advertising on a highly detailed, individual consumer level (Kauffman et al., 2012; Lambrecht and Tucker, 2011). These clickstream data are collected through cookie tracking by companies’ advertising servers and is associated with substantial costs. Both the financial investments and the availability of personal data have awakened new interest in correctly attributing online advertising success to multiple types of online advertising.
Companies doing online advertising often use standardized metrics and simple heuristics to evaluate the profitability of each specific online advertising campaign. However, these ratios do not capture the consumers’ decision-making processes over time and do not account for the interaction effects between multiple advertising activities. Using clickstream data while accounting for the cross-channel effects of online advertisement exposures may reveal important economic insights for advertising agencies (i.e., relocate advertising specific spending) and increase efficiency in regard to real-time bidding (RTB). Although there have been attempts to attribute success to multiple types of online advertising (Dalessan-dro et al., 2012b; Shao and Li, 2011), the effect of advertising on the individual behavior of consumers has not yet been comprehensively analyzed. Therefore, with this work, we can contribute to the exist-ing knowledge in several ways. Specifically, we analyze whether the costs of trackexist-ing and analyzexist-ing user-journeys—such as consumers’ touch-points (impressions) across multiple types of advertising—are economically reasonable. We develop a binary logit model using Bayesian estimation techniques that accounts for the direct and interaction effects of online advertising on consumer click probabilities. Al-though the “click” is just one of multiple options to evaluate online advertising activities (Dalessandro et al., 2012a), that click is still a mandatory step for a channel-specific conversion that reveals important insights into the effectiveness of current and past advertising activities.
This remainder of the paper is structured as follows: first, we briefly review the previous research related to this work. Second, we specify how to model the click probabilities of display ads and simultaneously account for multiple online advertising efforts. The model is then applied to empirical data from a large financial service provider. After outlining our findings and discussing our results, we conclude this work by highlighting its limitations and providing suggestions for future research.
2
Related Work
The click-through rates (CTR) of banner advertising decreased from 2% in 1995 (Cho and Cheon, 2004) to 0.3% in 2004 to 0.08% in 2010 (Chapman, 2011). Repeated exposure to advertising is often considered
annoying and less effective with regard to click-through rates (Cho and Cheon, 2004; Edwards et al., 2002; Li et al., 2002). Nonetheless, Manchanda et al. (2006) and Yoon and Lee (2007) show that banner advertising intrinsically enhances consumer clicking and purchasing behavior. Their findings imply that the CTR may be an inadequate indicator for analyzing the effectiveness of banner ads. Dalessandro et al. (2012a) confirm this and demonstrate that considering only the click may mislead managers when evaluating online advertising campaigns. The authors show that there are alternative proxies to evaluate and optimize online advertising campaigns (such as onsite clicks and time on a company’s website). New types of display advertising, such as contextually targeted (Goldfarb and Tucker, 2011) or emotionally personalized ads (Meyer et al., 2011), add further complexity and require additional advertising measures (Lambrecht and Tucker, 2011).
In recent years, paid search advertising has become the favored tool in online advertising because it produces higher CTRs compared with banner advertising (Ghose and Yang, 2009). An emerging stream of research is analyzing paid search advertising from the advertiser’s perspective and providing important insights into consumer clicking and purchasing behavior (see, for instance, Rutz et al. (2012) and Nottorf and Funk (2013)). Although the number of studies on paid search advertising has increased significantly, there have been few attempts to examine an integrated model of online advertising efforts (Dinner et al., 2011; Wiesel et al., 2011) or to standardize attribution for online advertising as an alternative from the “last cookie” wins attributions (Dalessandro et al., 2012b; Shao and Li, 2011). For example, there is just one work that investigates the effects of the interaction between display and paid search advertising on an individual user level (Nottorf, 2013).
3
The Valuation of User-Level Data Across Multiple Online Advertising
Channels
3.1 Model Specification
In our approach, we account for the consumers’ user-journey and the effects of exposure to multiple display advertisements and paid search advertising to model the consumers’ individual click probabili-ties. We interpret all of the ads that a consumer is exposed to over time as a repeated number of discrete choices (Bucklin and Sismeiro, 2003). For example, consumers can decide whether to obtain additional information regarding a product after each exposure to each display ad, which results in a click/non-click decision. Note that we model the consumer choice of clicking or not clicking on a display ad (binary choice) by incorporating the effects of exposure to repeated display ads, such as banner or video ads, and paid search ads, as explanatory variables. We consider short-term advertising effects on consumers’ click probabilities by adding variables to the model specification that vary across timet (Xist) as well
as their long-term effects by incorporating variables that only vary across sessionss(Yis). To model the
individual contribution of each advertising effort and its effect on the probability that a consumeriwill click on a display ad, we specify a binary logit choice model that extends the specification of Chatterjee et al. (2003). The probability that consumericlicks on a display ad at timetin sessionsis modeled as follows:
Clickist=
(
1 if usericlicks on a display ad at timetin sessions
0 otherwise, (1)
with the probability
Pr(Clickist=1) =
exp(Iistαi+Xistβi+Yisγi+εist)
1+exp(Iistαi+Xistβi+Yisγi+εist)
where Iistis a vector of advertisement-specific intercept terms;Xistare variables varying within (t), across
sessions (s), and across consumers (i);Yisare variables varying across sessions (s) and consumers (i); and αi,βi, andγiare consumer-specific parameters to be estimated.
After introducing our general model specification, we specify the covariates in greater detail:
Iist ={Ibanist ,Iretist,Ividist}, (3)
where Ibanist , Iretist, and Ividist are indicator functions that assume the value of 1 if consumeriis exposed to
the respective advertising type at timetin sessions. All three variables account for the propensity of an individual consumer to click on a banner ad, retargeted ad, or video ad, independent of the total number of ads that the consumer has been exposed to.1 The prior research states that consumer responses to banner ads are highly dependent on individual involvement (Cho, 2003; Danaher and Mullarkey, 2003) and exhibit strong heterogeneity (Chatterjee et al., 2003).
To account for the effects within a consumer’s current session across multiple advertising types, we define several variables incorporated byXist:
Xist={xbanist ,xretist,xvidist,x ban|sea ist ,x
ret|sea
ist ,xclickis(t−1),
Clickis(t−1),TLClickist}.
(4)
We expect the effect of repeated ad exposure to vary depending on the type of display ad that is repeated and whether the consumer has previously clicked on a paid search ad. We generally expect stronger wear-in effects2from the advertising activities after the consumers have searched and clicked on a paid search ad—paid search ads appear in response to a consumer’s own queries and are far less intrusive and more appealing to consumers—this interaction may therefore positively increase the subsequent effects of repeated exposure to display ads. This assumption is based on previous research by Danaher and Mullarkey (2003), who found that online advertising is more effective for consumers in a goal-directed mode.
Thus,xbanist , xretist, andxistvid refer to the cumulative number of banner, retargeted, and video ads to which consumerihas been exposed until timetin sessionsif that consumer has not previously clicked on a paid search ad.xbanist |seaandxretist|seaalso represent the cumulative exposure to banner and retargeted ads within sessions until timet but are nonzero only if consumerihas previously clicked on a paid search ad.3
xclickis(t−1)is the cumulative number of clicks on display ads untilt−1 in the current sessions. Clickis(t−1)
is an indicator function that assumes the value 1 if a consumer clicked on the previous display ad int−1. TLClickist refers to the logarithm of time since a consumer last clicked on an ad. If a consumer has not
clicked on an ad, the variable remains zero.
The variablesYis, which vary across sessions and consumers, are specified as follows:
Yis={ybanis ,yretis,yvidis ,y ban|sea is ,y
ret|sea is , yclicki(s−1),ISTis,Sessionis}.
(5)
ybanis ,yretis, andyvidis refer to the number of normal banner, retargeted, and video ad exposures, respectively, in previous sessions that have been exposed if a consumer has not yet clicked on a paid search ad.
1We define banner ads as nonspecific “generic” display ads that are delivered to consumers. Retargeted (banner) ads are delivered to “known” consumers. Video ads are multimedia ads that are displayed on YouTube. See section “User-Level Data” for further details.
2Exposures to ads are believed to wear in at a particular level of repetition if they have a significant positive effect on consumers (Pechmann and Stewart, 1988).
3Please note that we also incorporatedxvid|sea
ist in the model specification but omitted this variable from the final specification
ybanis |sea andyretis|sea capture the long-term effects of banner and retargeted ad exposures, respectively, if a consumer previously clicked on at least one paid search ad.yclicki(s−1)is the cumulative number of clicks on display ads in the previous sessions. ISTisis the logarithm of the intersession duration between sessions
ands−1 and remains zero if a consumer is active in only one session. Sessionisrefers to the number of
sessions during which a consumer has already been exposed to ads.
3.2 User-Level Data
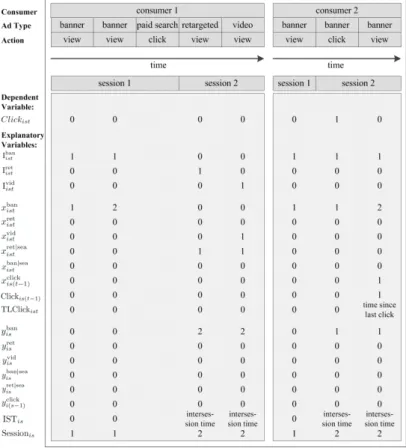
Figure 1: Schematic Illustration of Converting Raw User-Level Data for Clickstream Modeling
We use a unique dataset from a large European financial service provider that wants to remain anonymous. The com-pany operates several display and paid search advertising campaigns to adver-tise products such as giro accounts and instant access savings accounts. User-level data that follows consumers across multiple advertising channels and types is collected through cookie-tracking. This tracking enables us to distinguish the following types of advertisements on an individual consumer-level. First, we distinguish(normal) banner ads, which are nonspecific “generic” ads that are delivered to consumers. The second type areretargeted (banner) ads, which are delivered to “known” consumers.4 For all types of banner ads, the financial service provider advertises its product in the same manner. Third, thevideo ads
in this study are multimedia ads that are displayed on YouTube. Furthermore, the dataset contains information on con-sumer clicks onpaid search ads.5 Be-cause we model only a consumer’s
di-rect response to display ad exposures (banner, retargeted, and video), we consider the consumer activi-ties on search engines that occur chronologically between display ad exposures (seexbanist |seaandxretist|sea). Please further note that due to a lack of data, we are not able to control for past conversions. Although there might be consumers who purchased something from the company in question and might be exposed to display advertisements afterwards, the effect of past conversions can be neglected to some extent be-cause the number of users who purchased and later were exposed to display advertisements is very small. Especially in the financial sector investigated here (where a conversion is a very rare event), including information on past conversions would not significantly affect the parameter estimates.
The dataset contains a random sample of 150,000 users from a 48-day period (November 27, 2011 to January 13, 2012) and, therefore, only represents a small cohort from a short investigation period.
Gen-4These retargeted ads are served by the Google Display Network on the basis of a cookie that is stored on a consumer’s personal computer (i.e., because of the previous browsing history for financial products or previous visits to the website of the company in question).
5Because of technical restrictions, there is no information on individual searches by consumers that do not include clicking on a paid search ad.
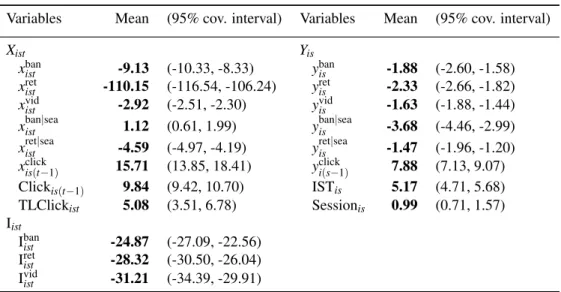
Variables Mean (95% cov. interval) Variables Mean (95% cov. interval)
Xist Yis
xbanist -9.13 (-10.33, -8.33) ybanis -1.88 (-2.60, -1.58)
xretist -110.15 (-116.54, -106.24) yretis -2.33 (-2.66, -1.82)
xvidist -2.92 (-2.51, -2.30) yvidis -1.63 (-1.88, -1.44)
xbanist |sea 1.12 (0.61, 1.99) ybanis |sea -3.68 (-4.46, -2.99)
xretist|sea -4.59 (-4.97, -4.19) yretis|sea -1.47 (-1.96, -1.20)
xclick
is(t−1) 15.71 (13.85, 18.41) yclicki(s−1) 7.88 (7.13, 9.07)
Clickis(t−1) 9.84 (9.42, 10.70) ISTis 5.17 (4.71, 5.68)
TLClickist 5.08 (3.51, 6.78) Sessionis 0.99 (0.71, 1.57)
Iist
Ibanist -24.87 (-27.09, -22.56) Iretist -28.32 (-30.50, -26.04) Ividist -31.21 (-34.39, -29.91)
Table 1: Parameter estimates of the proposed model. Notes: We report the mean and the 95% coverage interval; significant estimates are in boldface.
erally, the company exposes millions of unique users with display advertisements each day. Because there is no explicit information available on the number of consumer sessions and their duration, we manually define a session as a sequence of ad exposures with breaks not exceeding 60 minutes. Further-more, we only consider consumers who were exposed to a minimum of six display ads (i.e., providing enough observations for each consumer to demonstrate out-of-sample fit performance). Thus, the sam-ple was reduced to 4,878 users who clicked 496 times on 96,302 display ads in total (38,343 banner ads, 57,457 retargeting ads, and 502 video ads). Figure 1 schematically illustrates how we converted the initial dataset to enable clickstream modeling.
4
Results
Similar to Chatterjee et al. (2003), we use a Bayesian standard normal model approach to account for consumer heterogeneity and to determine the set of individual parameters. We apply an MCMC algo-rithm including a hybrid Gibbs Sampler with a random walk Metropolis step for the coefficients for each consumer and utilize theR-packagebayesmby Rossi et al. (2005). We perform 60,000 iterations and use every twentieth draw of the last 20,000 iterations to compute the conditional distributions.
As was argued in chapter 2, the results of the analysis (see Table 1) show a very low click tendency (see I...ist). The logits of these estimates indicate a click probability that ranges from 1.6∗10−11to 2.8∗10−14.
Apart from this finding, it appears that the consumers either click on one of the first ad exposures or are unlikely to ever click on an ad within a discrete session, as the repeated exposures to display ads have a significant negative effect on the click probability of consumers (seex...ist). In particular, the repeated exposure to retargeted ads within a current session strongly reduces the consumers’ click probability (seexretist). Our results indicate that the expected click probability of a consumer is the highest for the first ad exposure and subsequently decreases. Note that this finding does not apply to the repeated banner effects to which consumers are exposed after they have clicked on a paid search ad (seexbanist |sea). This positive effect (from previous clicks on paid search ads) on the effectiveness of banner and retargeted ad exposures was not discovered previously and is consistent with our prior expectations: the previous interaction with a paid search ad (i.e., searching for related terms and clicking on a company ad) increases the effect of downstream display ad exposures.
In contrast to the prior findings of Chatterjee et al. (2003) from ten years ago, the long-term effects of repeated display ad exposure are negative (seey...is). As expected, the number of previous clicks by con-sumers positively influences their click probability in the next ad exposure (seexclickis(t−1), Clickis(t−1), and
yclicki(s−1)). The consumers who had already clicked on a link demonstrated a higher probability of clicking again than the consumers who clicked less or who had not yet clicked at all. Those consumers who had clicked can be regarded as “locked-in” consumers because they have either already been successfully attracted by the services and products of the company in question or have already actively noticed the ads, compared with consumers who have not yet clicked.
5
The Valuation of Personal Data
We have successfully demonstrated how to model consumer clickstreams. Next, we derive and discuss the economic value of revealing insights regarding the cross-channel advertising effects and the value of having and analyzing the available clickstream data in the context of real-time bidding (RTB).
5.1 Cross-Channel Insights
The availability of clickstream data offers companies doing online advertising the ability to understand the consumer process of repeated display advertising exposure and to more precisely account for the spe-cific effects from the ads on consumer behavior. These findings are extremely helpful when managing and evaluating online advertising campaigns. For example, while we find that retargeted banner adver-tisements appear to be perceived as obtrusive in the short term, their effects do not strongly differ from the normal banner ads in the long term. In contrast to banner or retargeted ad exposures, video advertise-ments do not appear to be perceived as particularly obtrusive: we find that consumers’ repeated exposures to rich media advertisements such as videos are helpful in building and increasing brand awareness (i.e., in branding campaigns) because they only barely negatively affect consumer clicking behavior. Further-more, we investigated the predominantly positive interaction effects from paid search ad exposures on the effects of exposure to repeated display ads. While we provide important insights on the direct as well as the interaction effects of online advertising on consumer behavior, we leave the question of acorrect
attribution for cross-channel advertising activities on the companies’ overall success measures open for future research.
5.2 Real-Time Bidding
To demonstrate the economic value of having and analyzing user-level data in the context of RTB6, we first highlight the out-of-sample fit performance of our proposed model. Therefore, we predict the actual outcome for each consumer for the next period (click/no click) and compare them with the actual, observed choices. As reported in Table 2, the prediction for the consumers’ actual choices int+1 is quite good (e.g., 43.7% of the clicks can be forecast correctly.). However, for the companies using RTB, it may not only be important to separate the consumer into two types (click/no click) but also to differentiate their actual bidding behavior (e.g., maximum bid for a display impression) along the consumers’ individual success rates (in our case: consumers’ individual click probabilities).
6In RTB, display ad impressions are bought in an auction-based process and displayed in real time on the individual con-sumer level. That is, the knowledge of a concon-sumer’s success probability (such as a click or a conversion) at any given time is vital for accurately evaluating each ad type and appropriately adjusting financial resources.
Observed Choice Click No Click
Click (71) 31 40
No click (4,807) 32 4,775
Total (4,878) 63 4,815
Hit rate 43.7 99.3
Table 2: Out-of-sample fit perfor-mance for t+1.
Let us now assume the position of an advertiser that engages in a RTB setting. Depending on the individual setting (i.e., contribution margin of the advertised product), companies usu-ally determine a specific maximum amount of money that they are willing to spend to acquire new customers (cost per order - CPO). In the following example, we assume a constant con-version rate for reasons of simplicity and thus can translate a maximum CPO to a maximum cost per click (CPC) that com-panies will not outbid when using RTB.
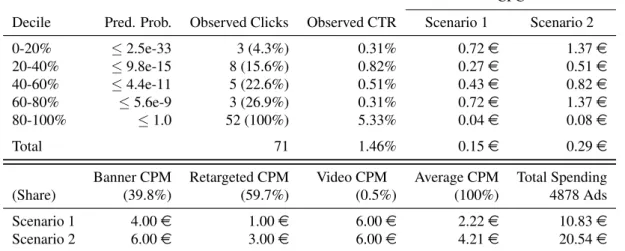
We demonstrate the economic value of clickstream data by running a second out-of-sample test. We rank order all consumers by their individual click probabilities at timet+1,7 separate them into quintiles, check how many clicks each of the quintiles actually receives int+1, and calculate their respective CTR (see Table 3).8For example, the quintile with the lowest 20% of click probabilities (0-20%) receives 1.5% of the total clicks in the next period, whereas 20% of the consumers with the highest click probability (80-100%) receive nearly 75% of the clicks. Concentrating the company’s bidding behavior on these upper quintiles bins may uncover potential savings.
For demonstration purposes, we simply assume a cost per mile (CPM) for display advertising int+1 (in RTB, the CPM might vary from impression to impression, but this would only marginally change the following procedure for estimating the value of clickstream data). Based on the expected CTR, we are able to calculate the expected CPC. We do this for two scenarios with different CPM for each quintile (see the right hand side of Table 2). For the sake of clarity, let us consider an example and assume a maximum CPC of 0.25e. Given that maximum,9we see that in scenario 1, 20% of consumers with respect to the expected CPCs should be exposed to a display ad because the CPC of all of the other consumers is expected to be higher than 0.25e. A company that does not have information on the clickstream data would have exposed every consumer to display ads in the first scenario because the company would not have categorized consumers along their individual click probabilities and, with 0.15e, the total expected CPC is less than the maximum CPC. In the second scenario with an increased CPM, the company would not expose any consumer, although the consumers with the highest expected CTR should have been exposed to display ads.
The procedure outlined above leads to additional profit (pro f itadd) in contrast to a company that does
not hold and analyze consumer-level data. To illustrate this result for scenario 1, we must consider the opportunity cost of a “lost” click (costopp) of a consumer (that we do not expose to display ads because we
focus on the consumers with the topmost click probabilities) times the number of lost clicks (clickslost).
Simultaneously, we save on the consumers (userlost) that we do not expose to display advertising due to
an expected CPC that is too high:
pro f itadd=userlost∗ CPM
1000−clickslost∗costopp (6) We assume the cost of a lost click to be equal to the maximum CPC (0.25e). Given that assumption, the expected profit is 3.91efor scenario 1.10 In the second scenario, a company that does not use the
7That is, the model was estimated on the basis oftimpressions per consumer.
8We do so following Chatterjee et al. (2003) with respect to Morrison (1969), who suggested to ranking observations in decreasing order to their predicted probabilities and classifying the firstxas clicks (wherexis the total number of clicks observed in the holdout sample) because the behavior to be predicted is relatively rare and the base probability of the outcome is very low. As Chatterjee et al. also point out, with a large number of nonevents (no clicks) and very few events (clicks), logistic regression models can sharply underestimate the probability of the occurrence of events.
9In a real setting, these expected CPCs should be calculated repeatedly: first, because the parameter estimates may change over time and second, to analyze the probabilities of new consumers.
CPC
Decile Pred. Prob. Observed Clicks Observed CTR Scenario 1 Scenario 2
0-20% ≤2.5e-33 3 (4.3%) 0.31% 0.72e 1.37e 20-40% ≤9.8e-15 8 (15.6%) 0.82% 0.27e 0.51e 40-60% ≤4.4e-11 5 (22.6%) 0.51% 0.43e 0.82e 60-80% ≤5.6e-9 3 (26.9%) 0.31% 0.72e 1.37e 80-100% ≤1.0 52 (100%) 5.33% 0.04e 0.08e Total 71 1.46% 0.15e 0.29e
Banner CPM Retargeted CPM Video CPM Average CPM Total Spending
(Share) (39.8%) (59.7%) (0.5%) (100%) 4878 Ads
Scenario 1 4.00e 1.00e 6.00e 2.22e 10.83e
Scenario 2 6.00e 3.00e 6.00e 4.21e 20.54e
Table 3: Illustration of the economic value of evaluating consumer-level data. Notes: We rank order all consumers by their predicted click probabilities at time t+1, classify them by quintiles, check how many clicks each of the quintiles actually receives in t+1, and calculate CTRs and CPCs for the different scenarios based on multiple CPM assumptions.
information derived from clickstreams would lose 8.89ebecause it misses 20% of the consumers with the highest predicted probabilities.11 Please note that this profit/loss applies only to the small sample of 4,878 consumers. In a real world scenario, a company that engages in RTB makes millions of decisions and may save thousands of dollars each day. For example, in the first scenario and given only 1 million decisions, the company would save 801eby classifying users along the predicted click probabilities.
5.3 Limitations
Although we analyzed a large dataset at a highly detailed, individual user-level, these clickstream data are just one small excerpt from consumers’ daily surf routines. The user-journey that we analyzed only consists of touchpoints with the company in question. That is, there is no user-level information if the company in question has not exposed the user to a display ad (or, e.g., a 1×1 view-pixel). Another defi-ciency in our research methodology and its underlying data is that we only take into account a “click” as the indicator for the success or failure of the advertising campaign (without any information on consumer conversions). As noted earlier, the click is one but not the only approximation for an economic evalu-ation of online advertising activities (Dalessandro et al., 2012a). For example, in branding campaigns, the focus lies in creating and increasing brand awareness; direct responses to online advertisements (i.e., clicks or conversions) are not the primary concern.
Furthermore, there are certain limitations to tracking consumers through the application of cookies that should not be overlooked. For example, we do not have combined information for the consumers who use web browsers across multiple devices (i.e., personal computers at work versus at home), and thus we are unable to model complete sessions for all consumers. That is, we handle each cookie on a personal computer as one consumer and do not consider the use of the same personal computer by
should have been considered in the calculation above. For reasons of demonstration, these cost are negligible. For example, the size of the initial dataset of 150,000 consumers is about 30MB and prices for data storage of 1GB are less than 0.10eat Amazon web services. While estimating the model (as summarized in section 4) is computationally expensive, determining the click-through probability is not. Therefore, we can neglect the costs for the computation of the expected click probability for an individual ad exposure.
11loss
exp=4878∗0.2∗
4.21e
multiple consumers (i.e., families) or the switching between workstations or browsers by consumers across multiple devices. Furthermore, current web browsers (i.e., Internet Explorer, Firefox, Chrome, or Safari) allow the usage of particular routines to delete cookies from personal computers (i.e., after each session or every day).
In our modeling approach, each parameter estimate linearly adds to another, which might not realistically describe click probabilities across all consumers. For example, there may be some users who have seen many retargeted display ads but still click on a display ad; within our additive logit approach, that consumer would have a click probability of nearly 0. These extreme cases may be better explained by the use of an exponential approach. We leave this interesting question open for further research.
Estimating the economic value of consumer-level data, the context of RTB only provides a lower limit to the true value of personal data from the perspective of the data holder. For example, there was no additional information available (such as internal, customer-relationship data or consumer-specific data such as income, interests, and age) which might have further improved the accuracy of the model’s estimation. Nonetheless, together with uncovering important insights into the cross-channel effects of display and paid search advertising as well as their different effects on individual consumer behavior, we demonstrated a variety of economic advantages that come together with clickstream data.
6
Conclusion
There are potential advantages for data holders that encompass increased revenues through price discrim-ination and efficiency gains using personal data (Acquisti and Varian, 2005). In this paper, we focus on the latter and derive the economic value of collecting, storing, and analyzing consumer-level data from the online advertising perspective. We developed a binary logit model with a Bayesian normal prior approach that models consumer clickstreams across multiple online advertising channels and considers the effects of the interaction between several types of online advertising.
We found that the availability (collecting and storing) and analysis of consumer-level data makes good economic sense for multiple reasons. First, the identification of individual consumer behavior is essential for understanding and evaluating multiple online advertising channels simultaneously. To be specific, our results indicate that repeated exposure to display ads decreases the consumers’ probability of clicking. The results further show that the repeated effects of display advertising strongly differ depending on which type of display ad is being exposed to a consumer. For example, the repeated exposure to video ads only barely negatively affects the consumers’ click probability (that is, the probability of the consumer choosing to click on an ad is nearly identical for each video ad exposure), but the click probability significantly decreases when the consumers are repeatedly exposed to banner ads. The most negative effect is observed for repeated exposures to retargeted (banner) ads. The effect of the repeated display ad exposures within a current session becomes less negative (retargeting) or even positive (banner) if the consumers previously searched for keywords related to the product that the company advertises and clicked on a paid search ad. This positive effect—from previous clicks on paid search ads—on the effectiveness of banner and retargeted ad exposures was not discovered previously, but is consistent with the prior research that finds that online advertising is more effective for consumers in a goal-directed mode (Danaher and Mullarkey, 2003).
Second we ran two out-of-sample tests to demonstrate fit performance. In the first test, we successfully predicted consumer clicks with our proposed model (43.7% of the clicks int+1 were forecast correctly). In the second test, we rank ordered all consumers by their individual predicted click probabilities and calculated CTRs and CPCs for two different scenarios. We further derived significant economic profits from having and analyzing clickstream data. The outlined procedure appears to be especially applicable
in regard to real-time bidding (RTB), where ads are bought and displayed in real time on an individual consumer level.
Although we provide a new perspective on consumer online behavior and on how online advertising influences this behavior, there is still room for further analyses. First, the integration of information on consumer conversions could uncover interesting insights because the conversion probabilities might also differ across several types of online advertising. Second, consumer-specific information, such as gender or interests, would further enrich the analysis of individual click and conversion probabilities. Finally, we also see the application of a field experiment as very important for practitioners, in which the findings from the analysis of the consumer’s individual click and conversion probabilities are applied and compared to approaches that are already used in companies’ daily activities.
References
Acquisti, A. (2010). The economics of personal data and the economics of privacy.
Acquisti, A. and Varian, H. R. (2005). Conditioning prices on purchase history. Marketing Science, 24(3):367–381.
Bucklin, R. E. and Sismeiro, C. (2003). A model of web site browsing behavior estimated on clickstream data. Journal of Marketing Research, 40(3):249–267.
Chapman, M. (2011). What clicks worldwide? rich media can help lift click-through—but only a little.
Chatterjee, P., Hoffman, D. L., and Novak, T. P. (2003). Modeling the clickstream: Implications for web-based advertising efforts. Marketing Science, 22(4):520–541.
Cho, C.-H. (2003). Factors influencing clicking of banner ads on the www. CyberPsychology & Behavior, 6(2):201–215.
Cho, C.-H. and Cheon, H. J. (2004). Why do people avoid advertising on the internet? Journal of Advertising, 33(4):89–97.
Dalessandro, B., Hook, R., Perlich, C., and Provost, F. J. (2012a). Evaluating and optimizing online advertising: Forget the click, but there are good proxies.
Dalessandro, B., Perlich, C., Stitelman, O., and Provost, F. (2012b). Causally motivated attribution for online advertising. In Proceedings of the Sixth International Workshop on Data Mining for Online Advertising and Internet Economy, ADKDD ’12, pages 7:1–7:9, New York, NY, USA. ACM.
Danaher, P. J. and Mullarkey, G. (2003). Factors affecting online advertising recall: A study of students. Journal of Advertising Research, 43(3):252–267.
Dinner, I. M., van Heerde, H. J., and Neslin, S. A. (2011). Driving online and offline sales: The cross-channel effects of digital versus traditional advertising.
Edwards, S. M., Li, H., and Lee, J.-H. (2002). Forced exposure and psychological reactance: Antecedents and consequences of the perceived intrusiveness of pop-up ads. Journal of Advertising, 31(3):83–95.
Ghose, A. and Yang, S. (2009). An empirical analysis of search engine advertising: Sponsored search in electronic markets. Management Science, 55(10):1605–1622.
Goldfarb, A. and Tucker, C. (2011). Online display advertising: Targeting and obtrusiveness. Marketing Science, 30(3):389–404.
Hermalin, B. E. and Katz, M. L. (2006). Privacy, property rights and efficiency: The economics of privacy as secrecy: Quantitative marketing and economics. 4(3):209–239.
Kauffman, R. J., Srivastava, J., and Vayghan, J. (2012). Business and data analytics: New innovations for the management of e-commerce: The role of business analytics in e-commerce. Electronic Commerce Research and Applications, 11(2):85–88.
Lambrecht, A. and Tucker, C. (2011). When does retargeting work? timing information specificity.
Li, H., Edwards, S. M., and Lee, J.-H. (2002). Measuring the intrusiveness of advertisements: Scale development and validation. Journal of Advertising, 31(2):37–47.
Manchanda, P., Dub´e, J.-P., Goh, K. Y., and Chintagunta, P. K. (2006). The effect of banner advertising on internet purchasing. Journal of Marketing Research, 43(1):98–108.
Meyer, M., Balsam, M., O’Keeffe, A., and Schl¨uter, C. (2011). Admotional: Towards personalized online ads. IJCSA, 8(2):59–80.
Morrison, D. G. (1969). On the interpretation of discriminant analysis. Journal of Marketing Research, 6(2):156–163.
Nottorf, F. (2013). Modeling the clickstream across multiple online advertising channels using a binary logit with bayesian mixture of normals. (submitted to Electronic Commerce Research and Applica-tions, ECRA).
Nottorf, F. and Funk, B. (2013). A cross-industry analysis of the spillover effect in paid search advertis-ing. Electronic Markets (forthcoming).
Pechmann, C. and Stewart, D. W. (1988). Advertising repetition: A critical review of wearin and wearout. Current Issues & Research in Advertising, 11(2):285.
Posner, R. A. (1978). The right of privacy. Georgia Law Review, 12(3):393–422.
Posner, R. A. (1981). The economics of privacy. The American Economic Review, 71(2):405–409.
Rossi, P. E., Allenby, G. M., and McCulloch, R. E. (2005). Bayesian statistics and marketing. Wiley, Hoboken, NJ.
Rutz, O. J., Bucklin, R. E., and Sonnier, G. P. (2012). A latent instrumental variables approach to modeling keyword conversion in paid search advertising. Journal of Marketing Research, 49(3):306– 319.
Shao, X. and Li, L. (2011). Data-driven multi-touch attribution models. In Proceedings of the 17th ACM SIGKDD international conference on Knowledge discovery and data mining, KDD ’11, pages 258–264, New York, NY, USA. ACM.
Varian, H. R. (1996). Economic aspects of personal privacy.
Wiesel, T., Pauwels, K., and Arts, J. (2011). Marketing’s profit impact: Quantifying online and off-line funnel progression. Marketing Science, 30(4):604–611.
Yoon, H.-S. and Lee, D.-H. (2007). The exposure effect of unclicked banner advertisements. Advances in International Marketing, 7(18):211–229.