Nebraska Department of Health and Human Services
Division of Public Health
Office of Minority Health and Health Equity
Equalizing health outcomes and eliminating health disparities
College of Saint Mary
Center for Transcultural Learning
Responding to the gifts and needs of our growing multicultural community
Interpreters Speak Out
Nebraska Language Access Survey
Report of Findings
By Anne Marie Kenny, MOL
Correspondence and Requests for Reprints Addressed to:
Anne Marie Kenny, MOL Diane Lowe, MAM
Director, Center for Transcultural Learning Health Program Manager, Congressional District 1 College of Saint Mary Office of Minority Health & Health Equity
7000 Mercy Road Nebraska Department of Health & Human Services Omaha, NE 68106 www.dhhs.ne.gov/minorityhealth
Phone: 402-390-1927 Phone: 402-471-0881
Email: [email protected] Email: [email protected]
Suggested Citation:
Kenny, Anne Marie (2008). Interpreters Speak Out: Nebraska Language Access Survey. College of Saint Mary, Center for Transcultural Learning, Omaha, Nebraska. Report prepared for the Nebraska
Department of Health and Human Services, Division of Public Health, Office of Minority Health and Health Equity, Lincoln, Nebraska. Available: www.dhhs.ne.gov/minorityhealth or www.csm.edu/ctl
T
T
a
a
b
b
l
l
e
e
o
o
f
f
C
C
o
o
n
n
t
t
e
e
n
n
t
t
s
s
Interpreters Speak Out
Nebraska Language Access Survey
Report of Findings
Chapter 1 Preface ... 4
Chapter 2
Highlights... 7
Chapter 3
Background ... 13
Chapter 4
Results ... 24
Chapter 5
Considerations ... 57
Chapter 6
Acknowledgements ... 61
List of Tables and Figures ... 65
References… ... 66
Chapter 1
P
P
R
R
E
E
F
F
A
A
C
C
E
E
This survey has been created and conducted in addition to the writing of this Report of Findings
by the Center for Transcultural Learning (CTL) at College of Saint Mary (CSM) at the request of the Office of Minority Health and Health Equity, Nebraska Department of Health and Human Services. Survey software consultation, analysis of survey results, and editing has been provided by the Nebraska Office of Minority Health and Health Equity.
Due to the rapidly changing demographics in the state of Nebraska, interpretive services and language access provision in the health care setting have cried out loudly in the state of Nebraska over the past few years, building to a crescendo in the summer of 2007. Three statewide conferences focused exclusively or in part on the issues and challenges of
interpretive service provision: Missing Links I in July, Nebraska Association of Translators and Interpreters (NATI) Conference in August, and Nebraska Minority Health Conference in August. Lincoln’s New Americans Task Force, Omaha’s Refugee Task Force subcommittee for health care interpreting, and the Region V CLAS Coalition are other strong examples of the
commitment and concern among individuals and groups responding to the need for Nebraska’s health care systems to reach out to all persons seeking health care regardless of ethnicity, country of origin, and English language ability. The question of national certification for health care interpreters is being raised more and more frequently. States, language agencies, and academic institutions are making valuable headway in developing assessment instruments, with the end goal of quality assurance.i Members of the Refugee Task Force in Omaha, the Douglas County Health Department, and the College of Saint Mary are currently leading an initiative to design an assessment tool to verify at least a minimum skill level in Nebraska health care interpreters.
In the recent past, there have been efforts to garner qualitative and quantitative data about the availability and caliber of language access services within Nebraska’s health system. One such example is a ten-question survey completed in 2006 to assess the attitudes of Lincoln/Lancaster County medical providers. The survey was conducted by the Medical Translation &
Interpretation (MTI) Leadership Group, a community task force out of Lincoln, Nebraska.ii The 72% response rate was noteworthy with 126 surveys sent and 91 completed and returned. It was evident in the findings that a significant proportion of medical providers are either not aware
of or are unclear about their responsibilities in providing quality interpretive services or qualified bilingual staff and clinicians in order to communicate with patients of limited English proficiency. Most notably, 68% of the providers said that they are most likely to use patients’ family and friends to provide interpretation and translation services. Of those 118 respondents who were most likely to use friends and family to interpret, 49 (or 41%) reported this method as probably or definitely adequate. Moreover, 58% of all respondents claim they do not offer written health information or forms, such as teaching sheets and discharge instructions, in other languages.
The purpose of our survey is to help eliminate health disparities caused by lack of adequate and quality language access services to limited-English-proficient (LEP) and non-English-proficient (NEP) patients in the state of Nebraska by gathering information about:
1. What is working well and where there may be gaps or barriers regarding language access services within our state's health care system; and
2. The quality of interpreter skills as reflected in their professionalism, education, training, and knowledge.
To expand our understanding of the quality of language services available in Nebraska’s health care settings, we asked people who interpret in those settings about their experiences. We also assessed the characteristics of Nebraska health care interpreters such as education level, interpreter training, and knowledge of ethics related to health care interpretation. As a member of the treatment team who, due to his/her role, consistently observes medical encounters objectively, the interpreter is an excellent eye and ear witness to the manner in which
organizations provide culturally and linguistically appropriate care to all patients regardless of country of origin, culture, or preferred language. In addition to the analysis of data gleaned from the interpreters’ voice, this narrative offers highlights of the data, with considerations and recommendations for the level of the interpreter, the organization, and the state.
Chapter 2
H
H
I
I
G
G
H
H
L
L
I
I
G
G
H
H
T
T
S
S
The need for language access services in Nebraska’s health care system (as in all sectors) is driven by the quantitative reality, as revealed in the U.S. Census Bureau data, that our state’s foreign-born population is growing at an exponential rate – faster than 43 of the other 49 states. The Nebraska Department of Education in 2007 reports 76 languages spoken in Omaha public schools and 48 in Lincoln public schools. iii
Until now, no study in Nebraska has explored the landscape of language access in a systematic fashion from the point of view of the people on the ground providing the language services. This report highlights findings from the survey data collected in addition to comments within each section related to local and national contextual issues surrounding the challenging task to provide safe, quality health care to all persons regardless of national origin and language.
The 30-question survey was generously completed by interpreters who work in various health care settings all across the state of Nebraska. This chapter briefly outlines the results detailed in Chapter Four.
A GLANCE AT RESPONDENTS’ CHARACTERISTICS
• 179 persons completed the survey
• 68% have two years or more experience in health care interpreting
• 94% have high school diplomas, 86% have some college education, 29% have a Bachelor’s Degree, 10% have a Master’s Degree, and 5.8% have not graduated from high school
• 31% were born in the U.S. and 69% were born outside the U.S.
• 19 languages were spoken among the respondents (excluding English)
• 71% are Spanish language interpreters
• 40% conduct more than 35 sessions per month, 54% conduct more than 20, and 66% conduct at least 10 per month
• Each interpreter on average works in 2.5 different types of facilities
• 60% are hired as interpreters and/or translators; 40% are not hired with the position of interpreter in their primary title or are in a dual-role position
• 34% work full-time, 18% part-time, 40% on-call, and 8% on-call either part- or full-time
• 43% earn $8-15 per hour, 23% earn $15-20, 15% earn $20-25, 10% earn $25-30, and 8% earn over $40 per hour
• American Sign Language Interpreters consistently earn the highest pay
• 79% have had some medical interpreter training, yet it is unclear whether the training was a brief 1-2 hour session or full-length course of 40+ hours
• Nearly 60% of those with medical interpreting training earn above the lowest salary range; only 44% of those with no specific medical interpreter training are above the lowest range
ASSESSING INTERPRETER COMPETENCIES
In an attempt to measure competencies, we chose three areas for which professional medical interpreters should have a high degree of expertise:
1. Role of culture broker
2. Professional standards and ethical codes 3. Briefing pre-session
The role of culture broker should be assumed by an interpreter only when cultural differences lead to a misunderstanding on the part of the provider or patient. From our sample:
• 37% have a misconception of the culture broker role
• 28% seem to understand the culture broker role but did not cite an example
• 35% clearly understand the culture broker role and cited appropriate examples
We explore in this report the correct utilization of the role of culture broker, possible reasons for the misconceptions, and the impact training and standards of practice have on this critical role.
Standards of practice are a set of guidelines that define what an interpreter does in the performance of his or her role. Standards are concerned with the “hows” and codes of ethics focus on the “shoulds.” 30% did not respond to the question about which standards they follow, and 15% answered “none.” It could be assumed that 45% do not follow any professional guidelines. Of those that identified a set of standards:
• 26% follow the National Council for Interpreting in Health Care
• 17% follow American Medical Interpreters Translators Association
• 5% follow Registry of Interpreters for the Deaf
• 2% follow California Healthcare Interpreters Association
• 2% follow Massachusetts Medical Interpreter Association
The briefing pre-session gives the interpreter the opportunity to obtain patient demographic and appointment information, explain how the interpretation will work,
determine the linguistic level of the patient, and ensure that all messages are communicated in a complete and accurate manner.
• 25-31% did not conduct a briefing pre-session.
• 75% always or often conducted the pre-session.
• From the 25% who did not conduct briefing pre-sessions, only 45% had some medical interpreter training, compared with the 75% who always or often conduct a pre-session, 90% of those have had medical interpreter training.
• Interpreters following NCIHC Standards of Practice most often conduct pre-sessions.
ASSESSING ORGANIZATIONAL EFFORTS
From the interpreters’ perspective, how well do Nebraska health care organizations fulfill their responsibilities to provide equal care to all patients regardless of language and cultural differences? Without overtly naming the Culturally and Linguistically Appropriate Services (CLAS) Standards, five survey questions gave us an insight into the level of organizational compliance to CLAS mandates # 4, 5, 6, and 7. Here are the interpreters’ ratings:
• Are organizations hiring bilingual staff? 38% rate organizational efforts as excellent to very good; and 62% say fair, inadequate, or poor.
• Do organizations inform limited-English-proficient patients of their right to a professional interpreter? 55% say excellent or very good, and 45% say fair, inadequate, or poor.
• Are organizations ensuring that patients have a professional medical interpreter rather than allowing family and friends to interpret? 60% say excellent or very good, and 40% rate them as poor, inadequate, or fair.
• Do organizations display signs in multiple languages for patients to see? 52% give a higher rating and 48% say that organizations are poor, inadequate, or fair.
• Are organizations making health documents readily available in multiple languages for patients? 55% say excellent or very good, and 45% say poor, inadequate, or fair.
Following are the most frequent responses to a series of questions about the quality of services to LEP patients delivered by Nebraska health care organizations:
What constitutes an organization’s quality service to LEP patients?
1. Having interpreters and bilingual staff available 2. The quality of the interpreter staff
3. Treating the patient well
What do organizations need to improve in their service to LEP patients?
1. Lack of respect and/or quality services for LEP patients 2. Not enough interpreters
3. No interpreters on staff or no interpreters at all 4. Allowing family and friends to interpret
Are there incidents in the medical interpretive encounter that interpreters are reporting? • 20 did not respond; 113 said “no;” 46 said “yes” with top reasons given:
1. Abuse or intent to harm self or others 2. Provider blatant disrespect toward patient 3. Incompetent interpreter
What are the main barriers faced by LEP patients?
1. Lack of language access services 2. Lack of health insurance
3. Cultural differences
4. Lack of bilingual health providers
INTERPRETERS SPEAK OUT ABOUT THEIR PROFESSION
An interpreter is a member of the treatment team who consistently observes medical encounters yet rarely has the opportunity to voice their observations about the manner in which LEP patients are served. How do they feel and think about their role and how others perceive their role within the organization?
• Interpreters feel more valued and respected by patients compared to staff or providers.
What are interpreters’ most positive experiences?
1. Opportunity to help people 2. Working in the health care field 3. Using language skills
What are interpreters’ most negative experiences?
1. Lack of respect for interpreters as professionals 2. Providers’ lack of cultural competence
3. Having to give bad news 4. Lack of proper training
SAMPLE SIZE AND REPRESENTATION
In this statewide survey, careful attention was paid to ensure that sample size was representative of the whole state and proportionate to the foreign-born population. The foreign-born population in the capital city of Lincoln is 7.38% of its total population, compared with 5.35% for the Omaha Metro area, and 4.88% in the rest of the state. With our sample as indication, Lincoln and Omaha Metro have nearly the same ratio of medical interpreters per foreign-born (25 per 10,000), with 25% fewer interpreters per foreign-born (19 per 10,000) outside these two large city areas. In terms of the three Congressional Districts, Districts Two and Three have similar ratios of 24 medical interpreters per 10,000 foreign-born, compared with District One at 13% fewer (21 per 10,000).
KEY ISSUES
The findings from this survey prompt us to focus attention on several issues: the professionalization and validation of the role of the medical interpreter in the state of Nebraska; the quagmire into which dual role interpreters are placed; the impact of organizational compliance in regards to effective language access service delivery; the importance of substantive interpreter training especially in the areas of standards of practice, culture brokering, and briefing pre-sessions; the educational needs of
organizations, staff, and providers about the role of professional interpreters and language access regulations; and the positive impact excellence in culturally and linguistically appropriate services has on health disparities, patient satisfaction, and the outcomes of care. These key issues are addressed in greater detail within the report. Further
Chapter 3
BACKGROUND
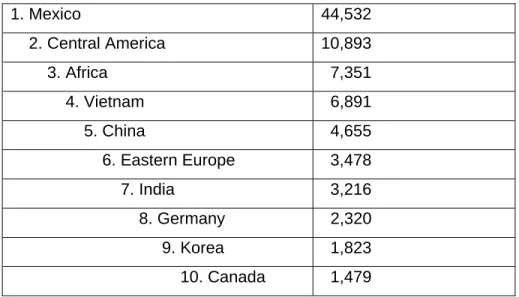
As a sparsely populated state in the center of the country, Nebraska can be perceived by east and west coasters to be in the middle of nowhere. Not so, says Mary Pipher, in her book The Middle of Everywhere: The World’s Refugees Come to our Town,iv a bestseller about Nebraska’s diverse immigrant population. U.S. Census data in 2000 ranked Nebraska as the 7th fastest growing state in the country in terms of foreign-born population. Nebraska is a desirable destination for immigrants and refugees due in large part to the employment opportunities in the agricultural and meat processing industries. Latino population growth and consequently its complex diversity are other reasons why Nebraska is designated as a new and resurgent immigrant destination. These changes will shape the future of the state.v Forty-five percent of the state’s overall population growth consists of people born abroad, and the top ten birthplaces as:
Table 3.1: Top 10 Nebraska Foreign-Born Birthplaces
1. Mexico 44,532 2. Central America 10,893 3. Africa 7,351 4. Vietnam 6,891 5. China 4,655 6. Eastern Europe 3,478 7. India 3,216 8. Germany 2,320 9. Korea 1,823 10. Canada 1,479
U.S. Census Bureau, American Community Survey 2006
One prominent example is the city of Schuyler, where the immigrant population soared from 4 percent to 32 percent during the 1990’s, ranking it sixth among all United States cities in terms of increased percentage of foreigners. “This year’s kindergarten class is 140 children, the largest ever, with only about 20 white pupils,” Schuyler Community Schools
NEBRASKA IOWA DAWSON ADAMS HALL SALINE LANCASTER MADISON COLFAX DOUGLAS CRAWFORD WOODBURY DAKOTA Lexington Grand Island Schuyler Lincoln Denison Sioux City NEBRASKA IOWA DAWSON ADAMS HALL SALINE LANCASTER MADISON COLFAX DOUGLAS CRAWFORD WOODBURY DAKOTA NEBRASKA IOWA DAWSON ADAMS HALL SALINE LANCASTER MADISON COLFAX DOUGLAS CRAWFORD WOODBURY DAKOTA Lexington Grand Island Schuyler Lincoln Denison Sioux City
1990 have created the need for language access services. The chart below list the Nebraska cities with the largest change in LEP population from 1990-2000.
Table 3.2: Nebraska Cities with No English or Don’t Speak English Well
CITY COUNTY 1990 2000
Schuyler Colfax 3.4% 33.5% Lexington Dawson 1.3% 31.9% Madison Madison 4.5% 20.6% South Sioux City Dakota 3.7% 15.2%
U.S. Census Data 2000
Nebraska counties with the highest percentages of persons who claimed “No English” or “Don’t speak English well” were highlighted in the 2000 Census Data for Central Nebraska and Western Iowa. Counties with high Limited English Proficient (LEP) populations are shown below.
Figure 3.1: Nebraska Counties with high LEP
U.S. Census Data 2000
The Omaha Public Schools’ (OPS) Board Report in June 2007 listed 76 different languages spoken by OPS students. The Lincoln/Lancaster County Report to the Nebraska
Department of Education in September 2007 listed 48 languages and dialects. Limited English Proficiency (LEP) presents a daunting challenge to schools, businesses, law enforcement, courts, and health care. These challenges lead to an imbalance in services rendered.
Ethnic and racial inequalities are documented across the country, across sectors, and across minority groups. As we focus this report on the health care sector, and specifically the quality of language access services in Nebraska, it is helpful to look at local and national data and regulations. The Institute of Medicine in its report Unequal Treatment: Confronting Racial and Ethnic Disparities in Health Care revealed that “racial and ethnic minorities tend to receive less care than non-minorities for the same condition, and when they receive care, it is often of lower quality, even when access-related factors such as patients’ insurance status and income are controlled.” vii
In December 2000, the Office of Minority Health, U.S. Department of Health and Human Services published the final recommendations on national standards for Culturally and Linguistically Appropriate Services (CLAS) in health care. Federal and State health agencies and policy makers now have a blueprint to follow to build culturally competent health care organizations, and to begin the elimination of the inequalities in care and treatment of patients with limited English proficiency and culturally diverse backgrounds. The CLAS standards are the foundation from which several questions of this survey were derived. The survey aimed to solicit the opinions of the Nebraska medical interpreter about the
effectiveness and efficiency of language access services in our state.
DESIGN AND METHOD OF RESEARCH
Because our target group was medical interpreters, any person who had experience interpreting in a medical/health care setting was eligible to take part in the survey, regardless of his or her official job title. The survey was not limited to interpreters of oral foreign languages. American Sign Language (ASL) interpreters who provide services in health care settings also participated.
Instrument Development
A committee of five persons was formed to assist in devising the questions for the
instrument, to reflect the objectives and purpose of the survey. The committee consisted of the training coordinator and the director of the Center for Transcultural Learning, a member of the board of directors from the National Council on Interpreters in Health Care, an
Nebraska county health department. The committee did not have access to confidential data on returned surveys.
The survey design was a written, structured, self-administered questionnaire in English, with a combination of open-ended, closed-ended, and fixed alternative questions. The survey consisted of 30 questions which, according to respondents, took 15-20 minutes to complete.
One part-time research assistant, two consultants, a statistician, and an interpreter trainer assisted in coding the open-ended questions. All persons with access to the returned surveys and data signed a confidentiality agreement.
Data Collection
Data was collected via hospitals, clinics, community health clinics, county departments, interpreter agencies, interpreter training programs, and interpreter organizations across the state of Nebraska that staff, utilize, or work with interpreters. The interpreters were given a choice regarding the method of survey distribution: hard copy version, email version, or telephone survey. When sending hard copies by mail, we included pre-addressed postage-paid envelopes to make it easy for respondents to return their surveys.
Our strategy to maximize response rate was to initially telephone the interpreters or facilities and agencies with connections to interpreters, to inform them of the background and reason for the study. We asked how many other interpreters were in their department, facility, or network. We then sent the survey to each person willing to participate, asking him or her to forward it to all persons in their network. Our research project was announced and the surveys distributed at three statewide conferences in August 2007: Nebraska Association of Translators and Interpreters (NATI): Speaking of the Future: Enhancing Language
Proficiencyviii; Missing Links I: Improving Health Care by Removing Language Barriersix; and the Nebraska Minority Health Conference: Equalizing Health Outcomes and Eliminating Health Disparities.x As a result of these efforts 179 completed surveys were collected.
Some of the respondents serve in more than one area or congressional district, creating a larger number of “responses” than respondents to the question “In which cities or towns do you provide interpretive services; list all if more than one.” Nebraska’s three congressional
districts range narrowly in population from 546 to 572 thousand inhabitants. There was considerable thought and dialogue about what constitutes representation of the entire state, and from which population to compare the sample group. Although the Bureau of Labor Statistics 2006 estimates there are 420 Translators and Interpreters in the state of
Nebraska, our survey was not intended to target translators (those who interpret written text) nor was it focused on interpreters in general (court, legal, community, or education
interpreters). Only interpreters who serve in a health care setting were asked to participate, no matter their job title. Indeed, lack of “interpreter” in the job title of employees who provide this function is one of the major challenges in the field of interpreting. Some organizations often require dual-role functions from their bilingual employees, such as clerical workers “dubbing” as interpreters, and consequently remain under the radar when it comes to compliance with interpreter quality standards and training.
These are but some of the reasons it was determined that adequacy of sample size should be in comparison to foreign-born population in the areas and congressional districts of Nebraska. The following tables and graphs offer a glimpse of Nebraska’s total population and its foreign born population with a comparison ratio to sample.
See maps of congressional districts below.
Figure 3.2
Nebraska Congressional Districts
U.S. Census Wall Mapsxi
District One encompasses
most of the eastern quarter of the state. It includes the state capital, Lincoln, Fremont, Norfolk, Beatrice, and South Sioux City.
District Two encompasses the core of the Omaha metropolitan area. It includes all of Douglas County and the urbanized areas of Sarpy County.
District Three
encompasses the western three-fourths of the state; it is one of the largest non-at-large Congressional districts in the country. It includes Grand Island, Kearney, Hastings, North Platte, Scottsbluff, and Columbus.
Table 3.3:Representation of Sample Size to Total and Foreign-born Population
179 respondents serving in more than one area and district create a larger number of “responses” than “respondents.”
Number of Respondents 179 AREAS Respo n ses Total Population (2005) Ratio Interp Services per 10,000 Total Foreign Born Population (2005) Ratio Interp Services per 10,000 Ratio Foreign Born to Total Population Lincoln Area 42 226,062 1.86 16,678 25.18 7.38%
Omaha Metro Area 107 761,544 1.41 42,115 25.41 5.53%
Outside Lincoln/Omaha 71 765,620 .93 37,334 19.02 4.88% Total Responses AREAS Served 220 1,753,226 96,127 5.48% CONGRESSIONAL DISTRICTS Subtotal District 1 65 572,745 1.13 31,190 20.84 5.45% Subtotal District 2 107 587,927 1.82 44,905 23.83 7.64% Subtotal District 3 48 546,304 .88 20,032 23.96 3.67% Total Responses DISTRICTS Served 220 1,706,976 96,127 5.63%
Note: Some respondents wrote “All of Nebraska” as the city or town in which they provided services. For this table these 16 responses were distributed respectively – 5-5-6 – into the three districts and areas. See Figure 4.10 for a detailed listing of the cities and towns.
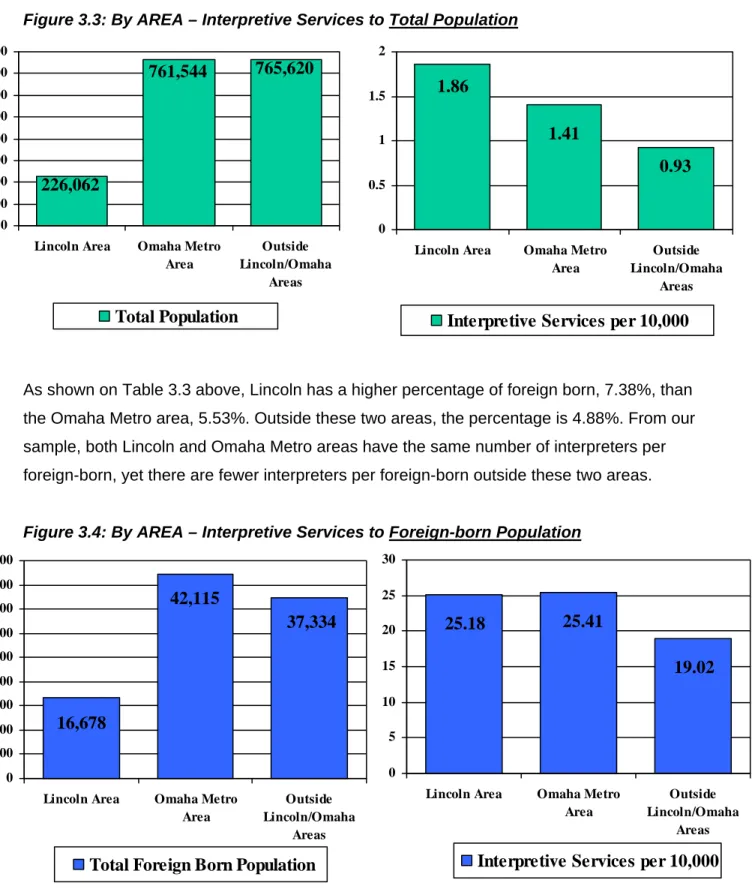
Our sample indicates that there are more medical interpreters per 10,000 serving in Lincoln, and even fewer in the area outside Lincoln and Metro areas.
Figure 3.3: By AREA – Interpretive Services to Total Population
As shown on Table 3.3 above, Lincoln has a higher percentage of foreign born, 7.38%, than the Omaha Metro area, 5.53%. Outside these two areas, the percentage is 4.88%. From our sample, both Lincoln and Omaha Metro areas have the same number of interpreters per foreign-born, yet there are fewer interpreters per foreign-born outside these two areas.
Figure 3.4: By AREA – Interpretive Services to Foreign-born Population
765,620 761,544 226,062 0 100,000 200,000 300,000 400,000 500,000 600,000 700,000 800,000
Lincoln Area Omaha Metro Area Outside Lincoln/Omaha Areas Total Population
1.86
1.41
0.93
0 0.5 1 1.5 2Lincoln Area Omaha Metro Area
Outside Lincoln/Omaha
Areas
Interpretive Services per 10,000
16,678 37,334 42,115 0 5,000 10,000 15,000 20,000 25,000 30,000 35,000 40,000 45,000
Lincoln Area Omaha Metro Area
Outside Lincoln/Omaha
Areas Total Foreign Born Population
25.18 25.41 19.02 0 5 10 15 20 25 30
Lincoln Area Omaha Metro Area
Outside Lincoln/Omaha
Areas Interpretive Services per 10,000
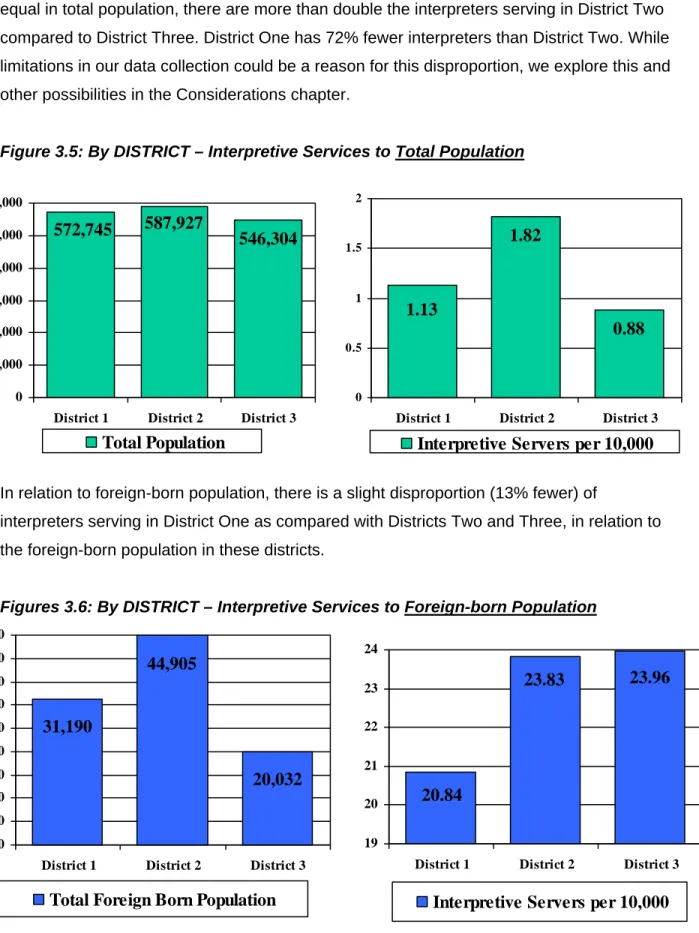
Continuing our look at the interpreter survey sample size, below is the relationship of
congressional districts, total population, and interpreters. While the three districts are almost equal in total population, there are more than double the interpreters serving in District Two compared to District Three. District One has 72% fewer interpreters than District Two. While limitations in our data collection could be a reason for this disproportion, we explore this and other possibilities in the Considerations chapter.
Figure 3.5: By DISTRICT – Interpretive Services to Total Population
In relation to foreign-born population, there is a slight disproportion (13% fewer) of
interpreters serving in District One as compared with Districts Two and Three, in relation to the foreign-born population in these districts.
Figures 3.6: By DISTRICT – Interpretive Services to Foreign-born Population
546,304 572,745 587,927 0 100,000 200,000 300,000 400,000 500,000 600,000
District 1 District 2 District 3 Total Population 0.88 1.82 1.13 0 0.5 1 1.5 2
District 1 District 2 District 3 Interpretive Servers per 10,000
31,190 44,905 20,032 0 5,000 10,000 15,000 20,000 25,000 30,000 35,000 40,000 45,000
District 1 District 2 District 3 Total Foreign Born Population
23.96 23.83 20.84 19 20 21 22 23 24
District 1 District 2 District 3 Interpretive Servers per 10,000
Confidentiality
Strict rules of confidentiality were followed during data collection, analysis, and reporting of this survey project. Respondents were requested to refrain from writing their names on the completed survey forms. As surveys were returned, we attributed a numeric code in order to track the input of data in the software and enable our research assistant to check and double check for errors in data entry.
Included with the survey was a cover letter or email with instructions for completing and returning the survey and a promise of confidentiality and anonymity. The promise was reiterated at the top of the survey tool stating:
“We do not need your name on the survey. Your individual identity will not be revealed. The written survey results will be presented in grouped data only, and the individual surveys will remain confidential. Thank you very much for your help in our mission to eliminate health disparities.”
The committee of interpretive services experts that were chosen to assist in the formulation of questions for the instrument was not shown the results of the returned surveys. We mandated a strict adherence to procedures protecting the confidentiality of the information linking the identification, numbers, or codes. Only key project personnel have access to information linking groups who returned the surveys with numbers or codes.
Data Analysis
With the assistance of Anthony Zhang, Health Surveillance Specialist for the Office of Minority Health and Health Equity, the survey questions were set up in a data file in SPSS software. After the data entry was completed, Mr. Zhang lent his expertise by providing the raw data and comparative data analysis as the basis for this report. The responses to open-ended questions were written out in full, and later coded by giving variable attributes. To determine inter-rater reliability, three raters were assigned to each variable response, to ensure different raters gave consistent coding of the same response. Responses where no common characteristics were found among other responses to same questions were coded as “other.”
Chapter 4
21.2%
47.5%
15.6%
15.6%
4 years or more
2-4 years
1-2 years
less than a year
R
R
E
E
S
S
U
U
L
L
T
T
S
S
D
D
E
E
M
M
O
O
G
G
R
R
A
A
P
P
H
H
I
I
C
C
S
S
O
O
F
F
R
R
E
E
S
S
P
P
O
O
N
N
D
D
E
E
N
N
T
T
S
S
EXPERIENCE
It was important for research purposes to gain an insight into Nebraska’s language access services from the perspective of interpreters who had sufficient experience in health care settings in the state. When asked how long the respondent has been serving as a medical interpreter, all 179 respondents answered the question. Thirty-four, or 19%, have been working in this capacity for over ten years. Almost half have been in the field for more than four years, and over 68% have had experience interpreting in the health care field for two years or more.
Figure 4.1: Years as Medical Interpreter
Figure 4.2: Number of Sessions per Month
NUMBER OF SESSIONS
In terms of number of medical interpretive sessions conducted monthly, 174 of the 179 responded to the question “How many interpretive sessions do you currently have each month?” Of those who responded, 40% conduct more than 35 sessions per month, 54% conduct more than 20 sessions per month; and 66% conduct at least ten sessions per month.
12% 14% 12% 28% 34% less than 10 from 10-20 from 20-35 from 35-50 more than 50
WORKPLACE
Interpreters are working in various types of medical and health care facilities. The 179
respondents offered a total of 465 answers to the question “What type of facility do you interpret (or work) for?” On average, each interpreter works in 2.5 different facilities. Hospitals, Doctors’ Offices, and Medical Clinics comprised 70% of the answers.
Figure 4.3: Types of Facilities Worked For
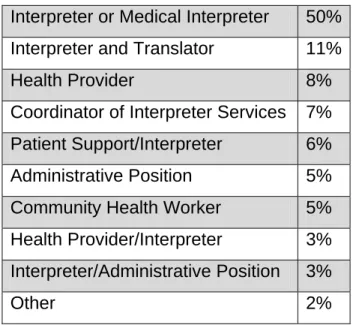
JOB TITLE
When asked about their job title, 18 of the 179 did not respond. Similar titles, such as Secretary
and Receptionist, were consolidated to Administrative. Half of the 161 identified their title as
Interpreter or Medical Interpreter. Interpreter-Translator was identified by 10.6%. Almost 40% were not hired with the position of interpreter in their primary title. If the assumption is correct that those not responding to this question do not have the formal title of interpreter, then approximately 50% were not hired primarily as interpreters.
The issue of “Dual Role Interpreters” is prevalent in regard to the potential
de-professionalization of medical interpreters. At the first annual membership meeting in August 2007 of the National Council on Interpreting in Health Care (NCIHC), one of the five breakout sessions was entitled “Dual Role Interpreters: Where Do they Fit in a Language Access Program.” The key questions and discussion were about the benefits and drawbacks of programs that promote dual role interpreters; whether dual-role interpreters have a place in language access and if so, what that is; and the key steps to assuring the quality of interpreting when dual role interpreters are used. To read the report from this breakout session, please see the NCIHC reference.xii
6% 7% 8% 9% 20% 23% 27% Other Business Public Health Setting Community Health Center Doctor's Office M edical Clinic Hospital
Utilizing Dual Role Interpreters can be challenging for the interpreter, the organization, and ultimately the patient. The responsibilities of the primary role are often in direct conflict with the role of interpreter. The interpreter has a finite set of limitations about how and when to interact with patients, whereas most other roles have much wider parameters in the communication and relationship with the patient. There are also issues of productivity, training, and the patient being confused about which role the person is in at the time. Other reasons Dual Role Interpreters should be utilized with caution are that the hiring and training requirements are often
overlooked. Self-identification as bilingual is inadequate and is not the same as possessing the skills of interpreting. As the Office on Civil Rights noted in its limited-English proficient (LEP) guidance, self-identification as bilingual is not necessarily indicative of an individual’s ability to interpret or translate. Thus concomitant with ensuring linguistic diversity, it is vital that bilingual individuals have sufficient competency to interpret, translate, or provide services directly in a non-English language.xiii The first half of CLAS Standard #6, one of the four mandates, places the responsibility for training on the organization: “Health care organizations must assure the competence of language assistance provided to limited English proficient patients by
interpreters and bilingual staff.”xiv When an employee is hired as a “bilingual liaison” or
“receptionist/interpreter” or “patient support specialist,” and is serving as an interpreter during a solid portion of their time on duty, that person needs the formation and foundation of the
professional skills of interpreting. In the table below, the position title separated by a slash (/) indicates a dual role position. Titles other than Interpreter, Medical Interpreter, and Translator normally indicate the respondent is acting in a dual role position.
Table 4.1: Job Title
Interpreter or Medical Interpreter
50%
Interpreter and Translator
11%
Health Provider
8%
Coordinator of Interpreter Services 7%
Patient Support/Interpreter
6%
Administrative Position
5%
Community Health Worker
5%
Health Provider/Interpreter
3%
Interpreter/Administrative Position
3%
EMPLOYEE OR CONTRACTOR
One-hundred-twenty-four of the 166 interpreters are hired as employees, revealed by the question “Are you on the payroll as an employee, or do you contract out your services?”
Twenty-nine interpreters, or almost 18%, are an employee at one organization and a contractor at another. There was only one person who indicated she/he provided medical interpretive services on a volunteer basis. We know from a previous question that our respondents are on average working at 2.5 facilities, which could be with the same employer, especially if the employer is a large health system including hospitals, clinics, doctor’s offices, etc. It should be noted that “employee” does not necessarily mean full-time, as some health care organizations choose to hire their interpreters as part-time or on-call employees. When asked whether
respondents were serving as medical interpreter full-time (over 30 hours per week) or other, 162 responded. Of those, 34% were working full-time, 18% were part-time, 40% were on-call, and an equal number, 3.7% each, were both on-call and either full- or part-time.
Figure 4.4: Employee Status Figure 4.5: Full-time or Part-time Status
SALARY
One-hundred-twenty-three respondents answered the question about approximate hourly salary. As only 26 respondents answered the question about monthly salary we can make the assumption that most of the respondents are paid hourly. Of those who responded, 43% earn the lower end of $8-15 per hour; 22.8% earn between $15-20, and six persons (almost 5%) earn $45-$66 per hour.
Employee
only
74%
Contractor
only
18%
Both
7%
Volunteer
1%
34% 4% 4% 40% 18%PT and On Call
FT & On Call
On-Call
Part Time
Full Time
Figure 4.6: Hourly Salary
Of the 10 people in the $40+ hourly range, only four also listed the language for which they interpret. Those four were American Sign Language (ASL) interpreters. Unlike Nebraska medical interpreters of foreign spoken languages who have no certification process, ASL
interpreters must receive a sign language interpreter license from the Nebraska Commission for the Deaf and Hard of Hearing (NCDHH).xv It is likely that for reasons of state certification, and because the NCDHH has been well organized since its inception in 1979, ASL interpreters are paid substantially more for their professional services.
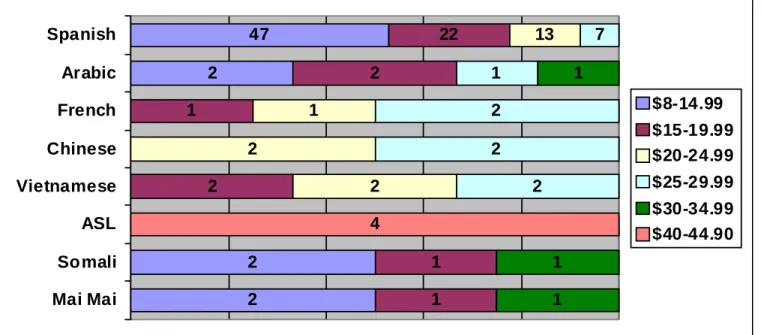
Of the 53 persons earning the lowest hourly rate, the languages interpreted for are: 47 Spanish, 2 Nuer; 2 Arabic, 2 Somali, 2 Mai Mai (a Somali language), 1 Kizi Gua (a Somali Bantu
language), and 1 Shilluk (the third largest minority ethnic group of South Sudan).
Figure 4.7: Hourly Salary based on Language Interpreted
2% 7% 10% 15% 23% 43% $8 -14.99 $15-19.99 $20-24.99 $25-29.99 $30-39.99 $40 - 65 2 2 2 47 1 1 2 1 2 22 2 2 1 13 2 2 2 1 7 1 1 1 4 Mai Mai Somali ASL Vietnamese Chinese French Arabic Spanish $8-14.99 $15-19.99 $20-24.99 $25-29.99 $30-34.99 $40-44.90
37 1 1 1 1 1 1 1 1 2 2 2 3 3 4 5 5 6 6 11 29 56 No Response Ukraine Tunisia Spain Panama Iraq El Salvador Cuba Burma Venezuela Guatemala Dominican Republic Puerto Rico Honduras China Somalia Chile Vietnam Sudan Columbia Mexico United States COUNTRY OF ORIGIN
Thirty-seven people did not respond to the question “What is your country of origin?” Of those who did respond, 31% were born in the United States and 16% were born in Mexico.
Figure 4.8: Country of Origin
Our sample group parallels the foreign-born population in Nebraska, with the top four birthplaces, in order: • Mexico • Central America • Africa • Vietnam LANGUAGES
One hundred ninety-five languages are interpreted among the 177 interpreters who responded to the question “What language(s) do you interpret for, excluding English?” Seventy-one percent or 139 interpret for Spanish-speaking patients; 4.6% or nine persons interpret for the deaf and hard of hearing; 3.6% or seven interpret for the Arabic speakers; 3.1% or six for Vietnamese patients; 2.6% or 5 each interpret for French, Chinese Mandarin,
and Mai Mai speaking patients. In the graph below, the “Other” section includes another 19 respondents and their respective languages: 4 Somali; 3 Nuer; 2 Dinka; 2 Portuguese; and one each for Burmese, Russian, Shilluk, Muzi Cuwa, Mina, German, Karen, and Kizi Gua.
Figure 4.9 Languages Interpreted For
G
G
E
E
O
O
G
G
R
R
A
A
P
P
H
H
I
I
C
C
A
A
R
R
E
E
A
A
S
S
WHERE ARE SERVICES PROVIDED
All 179 persons taking the survey responded to the question “In which cities or towns do you provide interpretive services?” There were 220 cities and towns named; therefore, the average person in our survey provides interpretive services for 1.5 cities.
Figure 4.10: CONGRESSIONAL DISTRICTS Figure 4.11: AREAS
Where Services are Provided Where Services are Provided
48%
30%
22%
District 1
District 2
37% 46% 17% Lincoln Omaha Metro 4% 3% 3% 5% 2% 70% 3% 3% 7% Spanish Arabic Chinese Vietnamese American Sign Somali Mai Mai French OtherFigure 4.12: 81 Cities/Towns included in “Outside Lincoln/Omaha Metro Area”
“All of Nebraska” responses are grouped and included as “Outside” [exclusively] the Omaha and Lincoln areas.
Table 3.3 distributes these 16 responses among the 3 areas and congressional districts.
E
E
D
D
U
U
C
C
A
A
T
T
I
I
O
O
N
N
A
A
N
N
D
D
T
T
R
R
A
A
I
I
N
N
I
I
N
N
G
G
FORMAL EDUCATION
Of the 179 respondents, 172 indicated their level of formal education question. Of those, 86% had at least some college. Twenty-nine percent had a college Bachelor’s Degree (more than half of those had some masters/graduate level courses). Almost 10% had a Master’s Degree. Only 5.8% had not graduated from high school. If our sample is representative, Nebraska medical interpreters are well educated, with 94% having high school diplomas compared to our state’s high school graduation rate of 88.7%.xvi
Effective interpreting requires a high degree of cognitive skills such as a sharp and considerable memory capacity. Integrated Interpreter Skills refers to the full compliment of skills that a
competent interpreter calls upon to ensure the accuracy and completeness of each converted message.xvii Simultaneous Interpreting is an even more complex skill in which language
16 1 1 1 1 2 2 2 3 3 4 9 11 11 14 All of Nebraska Madison Blair Seward Wilber Alliance Norfolk Fremont West Point Kearney Schuyler Lexington Crete Grand Island/Hastings Scottsbluff/Gering
comprehension and production take place at the same time in two languages.xviii For this reason there is debate among groups researching national certification about whether professional interpreters should have a higher degree of formal education. Another advantage for college-level education comes from the NCIHC, which recommends that interpreters are tested in all languages in which they will be interpreting with the exception that candidates with a college education earned in a particular language would not require testing in that language. They would, however, require testing in the integrated interpreter skills.xix
Figure 4.13: Educational Background (172 responses out of 179 surveyed)
PROFESSIONAL TRAINING
There were 140 “Yes” answers from the 177 persons who responded to the question “Have you had training specifically for medical interpreting?” A follow up question was asked for those who responded affirmatively: “If yes, what kind of training was it?” The choices given were “On-the-job training,” “Course or Seminar,” and “Both.” Some persons listed more than one answer totaling 146 responses.
Figure 4.14 Figure 4.15
Medical Interpreter Training Type of Medical Interpreter Training
The courses and 34%
44% 22% Both Course or seminar On the job training
NO
20.9%
YES
79.1%
2% 10% 29% 11% 34% 8% 6% Post-Grad Degree Master's Bachelor's Associate's Som e College HS diploma Some H.S.seminars for medical interpreters offered in the state of Nebraska vary in range, length, and type. From the data collected, it was not possible to easily identify the number of hours that coincided with the names of the specific courses listed due to the limited responses to the latter part of the question “Please give the name of the course and the number of hours.”
The data did not determine whether those who claim to have medical interpreter training actually received a solid foundational course that covered essential topics such as Code of Ethics, Standards of Practice, Memory Skills, and Roles of the Interpreter including Cultural Brokering, Briefing Pre-Session, and Positioning. In order to learn these professional skills, it is widely agreed among those in the field that a minimum of 40 hours is needed. However, some training courses were listed which are known to be 40+ hours in length. Bridging the Gap, one of the first nationwide training programs created by Cross Cultural Health Care Program (CCHCP), consists of 40 hours. Southeast Community College in Lincoln, District One, and College of Saint Mary in Omaha, District Two, offer introductory and intermediate levels of medical interpreter training with minimum of 40 contact hours for each level; and University of Nebraska at Kearney, District Three, also offers 40+ hour courses.
In our survey, an example of unknown length of the training is demonstrated by 11 respondents who wrote “NATI,” without specifying the number of hours. The Nebraska Association of
Translators and Interpreters (NATI) organizes an annual conference that provides training workshops ranging in length from 90 minutes to a full day. Some workshop topics may be specific to health care, yet most are not.
Another inconclusive variable in the survey is whether or not the interpreter successfully
completed the courses. Some programs have rigorous criteria that must be met before receiving the certificate or college credits. In the pilot introductory level medical interpreter course offered at College of Saint Mary’s Center for Transcultural Learning, close to 30% did not pass the final exam on the first attempt. Upon retaking the final exam, the majority of those successfully passed, but the several who failed again were not awarded the certificate. In spite of this, for the purposes of this survey, they could technically answer affirmative to the question about
receiving training.
Below is a chart according to districts where the medical interpreter trainings took place, based on 129 open-ended responses naming 11 different places where training was received.
Figure 4.16: Nebraska Districts Where Medical Interpreter Training Took Place
(95 persons offered 129 responses)
In the order of most frequently named places in which respondents received their training, below are the specific institutions or cities identified:
Table 4.2: Place of Training
District 1
• Southeast Community College
• International Communications Inc. (ICI)
District 2
• College of Saint Mary • Metro Community College • Alegent
• Children’s Hospital
• Hope Medical Outreach Coalition
District 3
• Grand Island, Nebraska
• University of Nebraska at Kearney
DISTRICTS & HOURS OF MEDICAL INTERPRETER TRAINING
The following graph cross-tabulates the districts where interpreters provide service with the number of hours the interpreter has undergone medical training. Thirty-seven people serving in Congressional District One have received 31-50 hours of medical interpreter training, compared
13
66
32
9
9
Other Outside NE District 3 District 2 District 1with 55 people in District Two, and 25 in District Three. Of those with fewer than 30 hours of medical interpreter training, 16 are from District One, 18 from District Two, and 8 from District Three. Of the respondents with more than 50 hours of training, one is serving in District One, six in District Two, and one in District Three.
Figure 4.17: Number of Hours Trained in Medical Interpreting
Based On Districts where Service Is Provided
SALARY & MEDICAL INTERPRETER TRAINING
Sixty percent of those with specific medical interpreting training earn $15 or more per hour, compared with only 44% of those who have no specific medical interpreter training. Of the 140 respondents in our survey who have had medical interpreter training (see Education and Training Section), 122 of them also answered the question about hourly salary. Of those 122 respondents, 95 had medical interpreter training and 27 had not been trained specifically in medical interpreting. Although the duration of the training is not known, for example, whether it was a 40+ hour foundational course or a brief half-day workshop, on the whole, those with any kind of medical interpreting training receive higher salaries. 40% of the 95 with medical
interpreter training are in the lowest hourly range, while 56% of the 27 without medical interpreter training are in the lowest range. A greater percentage of interpreters with training specific to medical interpreting are earning middle to higher ranges from $15-30 per hour. It levels off in the $40-45 range, and changes in the highest range. One explanation that a greater percentage of people in the highest salary range are from the “no medical interpreter” training group could be reflected in Figure 4.7: “Hourly Salary Based on Language Interpreted.” Four out
16 18 8 37 25 1 6 1 55 0 10 20 30 40 50 60
District 1 District 2 District 3
of ten in the entire sample earning $45-65 per hour are certified American Sign Language interpreters who have extensive training not specific or exclusive to health care interpreting.
Figure 4.18: Hourly Salary compared to Yes or No Medical Interpreter Training
SALARY & OTHER INTERPRETER TRAINING
Does any interpreter training, health care focused or not, increase an interpreter’s chances of earning more money as a medical interpreter? Apparently, yes. In the group with some
interpreter training, albeit not medical, only 28% are earning the lowest salary range, compared to 51% of interpreters with no other training earning the lowest range. As the salary ranges increase, the percentages of those with any other interpreter training increases, with the exception of the $30-35 range, although there were too few (0 & 2) in this category to be of significance. 0 10 20 30 40 50 60
$8-14.99
$15-19.99
$20-24.99
$25-29.99
$30-34.99
$40-44.99
$45-65
Figure 4.19: Hourly Salary compared with Yes or No Other Interpreter Training 0 10 20 30 40 50 60 $8-14.99 $15-19.99 $20-24.99 $25-29.99 $30-34.99 $40-44.99 $45-65
% with other interpreter training % NO other interpreter training
P
P
R
R
O
O
F
F
E
E
S
S
S
S
I
I
O
O
N
N
A
A
L
L
I
I
S
S
M
M
There were three questions created with the intention to gain insight into the professionalism and knowledge of the unique skill set necessary to be an effective medical interpreter.
Bilingualism is a prerequisite to entering the field of health care interpreting, and proficiency with extensive medical vocabulary necessitates ongoing learning. Although there are many areas in which professionalism could be measured, we chose three competencies for which trained, experienced medical interpreters should have a high degree of knowledge and practical application:
1) The role of culture broker
2) Professional standards and ethical code 3) Briefing pre-session
CULTURE BROKER ROLE
In the role of Culture Broker, the interpreter provides a necessary cultural framework for understanding the message being interpreted. This role should be taken on only when cultural differences are leading to a misunderstanding on the part of either provider or patient.xx The survey question about culture broker was written in two parts, to ensure that those who were not familiar with the term could still show their knowledge and understanding of the importance of clarifying cultural misunderstandings should the misunderstanding lead to miscommunication. The open-ended question on the survey was “Under what circumstances do you find that you need to step out of your interpreter role as a conduit and into the role of culture broker… in other words, what situations require you to explain cultural differences?”
Cultural Awareness
The NCIHC National Standards of Practice – Article 15
The interpreter alerts all parties to any significant cultural misunderstanding that arise. For example, if a provider asks a patient who is fasting for religious reasons to take an oral
medication, an interpreter may call attention to the potential conflict. xxi
Figure 4.20: Understanding the Role of Cultural Broker
The 94 responses to this question were coded into three categories:
• Misconception of culture broker role (35 persons)
• Seems to understand culture broker role without citing example (26 persons)
• Does understand culture broker role and cited an appropriate example (33 persons)
Seems to understand 27.7% Misconception 37.2% Definitely understands 35.1%
The missing link in many of the “misconception” and “seems to understand” categories was the important point that interpreters should only step into a culture broker role if the cultural
differences are leading to a misunderstanding between the patient and provider in the clinical encounter. It is not appropriate to interrupt the dialogue in order to educate the provider or patient on a cultural difference unless it is relevant to the understanding of the message or the outcome of the encounter. For the 85 (47.5%) non-responses to this question, it could be assumed they do not understand the role of cultural broker. If this is the case, then 67% of the sample are not effective or appropriate culture brokers, and are not appropriately alerting the other parties to significant cultural misunderstanding that can lead to unintended negative outcomes. Below are some examples of actual written responses:
Table 4.3: Examples of Cultural Broker Understanding
Understands culture broker role
• “When there is a difference in cultural habits/traditions that may lead to
misunderstanding, or hurt the feelings of either side, or even affect the treatment” • “When a normal health care practice for a culture elsewhere is misunderstood here in
America as ‘not rational or educated’”
• “When someone in the medical staff looks obviously at the patient as if they were ignorant by something that they said. I explain to them [staff] the cultural difference” • “When superstitions come into play or when cultural beliefs in medicine are not
understood by the provider”
Seems to understand the culture broker role
• “When providers or patients don’t understand why something is done in a certain way, or why it is done at all”
• “When a provider has a difficult time understanding a behavior based off culture or cultural practices”
• “In general in some situations that could be explaining cultural differences to the staff and sometimes to the patient”
Misconception of culture broker role
• “Any circumstance where it is required to facilitate understanding between provider and patients”
• “In surgery, I need to be there when the patients wakes up to let them know how things went; that they are ok”
• “When patients use dialects”
• “Financial explanation of our sliding fee scale and the need for household income even when patient has Medicaid”
• “I don’t think it’s necessary”
PROFESSIONAL STANDARDS AND ETHICAL CODES
In general, standards of practice are a set of guidelines that define what an interpreter does in the performance of his or her role, that is, the tasks and skills the interpreter should be able to perform in the course of fulfilling the duties of the profession. These are a set of “best practices” used by the profession to ensure a consistent quality of performance. They define acceptable ways by which interpreters can meet the core obligations of their profession, which are the accurate and complete transmission of the messages between a patient and provider who do not speak the same language in order to support the patient-provider therapeutic relationship. As in all professions, the field of interpreting is guided by ethical principles. Standards of
practice are concerned with the “hows” and codes of ethics focus on the “shoulds.” The codes of ethics provide “guidelines for making judgments about what is acceptable and desirable
behavior in a given context or in a particular relationship.”xxii
The question on the survey asked “Which professional Standards of Practice and/or Code of Ethics do you follow as a medical interpreter?” The interpreter was offered a listing of the leading national standards of practice: National Council for Interpreting in Health Care (NCIHC); American Medical Interpreters Translators Association (AMITAS), American Translators
Association (ATA), Registry of Interpreters for the Deaf, California Healthcare Interpreters Association, and Massachusetts Interpreter Association. Respondents could mark none or
other. Thirty percent, or 54 persons, did not respond to this question. Adding them to the 27 persons who ticked the choice “none,” it could be assumed that 45% either do not know about or do not follow professional guidelines.
Figure 4.21: Standards of Practice/Code of Ethics
27 19 3 3 6 13 21 33 None Other MA Medical Interpreter Association CA Healthcare Interpreters Association Registry of Interpreters for the Deaf ATA AMITAS NCIHC
BRIEFING PRE-SESSION
In order to ensure an effective and accurate medical interpretation, it is critical that the interpreter conduct a pre-session discussion with patient representatives, patients, and providers. The pre-session gives the interpreter the opportunity to obtain patient demographic and appointment information, explain how the interpretation will work, determine the linguistic level of the patient, and ensure that all messages are communicated in a complete and accurate manner.xxiii
The question on the survey was “Do you typically conduct a briefing pre-session before an interpretation?” There were four choices for answers: 1) Yes always; 2) Yes often; 3) No, I do not think it is necessary; and 4) No, I am not sure what a briefing pre-session is. Of the 164 who responded, 75% always or often conduct a briefing pre-session and 25% either do not think it is necessary or are unsure what a briefing pre-session is. Fifteen persons did not answer the question at all, and they may be added to the 41 respondents who do not understand the nature or necessity of a briefing session. If that is the case, 31% are not conducting briefing pre-session.
Figure 4.22:
Do You Conduct a Briefing Pre- Session?
CONDUCTING BRIEFING SESSIONS & STANDARDS FOLLOWED
The importance of conducting a briefing pre-session is paramount to effective interpretive encounters. From this cross-tabulation, the greatest numbers of interpreters who are always or often conducting a briefing session prior to the interpreted event are those following NCIHC’s Standards of Practice at 90%. In second place for those always or often conducting briefing pre-sessions are the interpreters following the American Medical Interpreter and Translator
Unsure what it is 15% No 10% Often 53% Always 22%
2 5 10 7 3 8 7 3 3 4 18 10 7 3 2 1 2 3 3 11 5 1 1 1 0% 10% 20% 30% 40% 50% 60% 70% 80% 90% 100% N one Other MA Med Interp Assoc CA Healthcare Interp Assoc Registry of Interp for the Deaf National Council on Interp in Health Care American Med Interp & T rans Assoc American Translators Assoc
Always conduct Often conduct Do not conduct
Not sure what briefing pre-session is
Association’s Standards of Practice at 82%, and thirdly, are those following the American Translators Association’s Standards of Practice at 77%. Those who follow no standard of practice rank the lowest, with only slightly more than 40% conducting briefing sessions.
Figure 4.23: Do You Conduct a Briefing Pre-Session?
(based on Standards of Practice followed)
CONDUCTING BRIEFING SESSIONS & MEDICAL INTERPRETER TRAINING
There is a highly significant impact that training in the field of medical interpreter has on whether interpreters are conducting a briefing pre-session. Of those always conducting a briefing
session, 89% have had medical interpreter training. Of those who often conduct a briefing session, 91% have had medical interpreter training. Of the 47 respondents who do not conduct or are not sure what a briefing pre-session is, only 45% have had medical interpreter training. We do not know the duration of the medical interpreter training for any of the categories in this cross-tabulation.
Figure 4.24: Do You Conduct a Briefing Pre-Session?
(based on medical interpreter training?)
ORGANIZATIONAL EFFORTS
This project sought to assess what is working well and where there may be gaps or barriers regarding language access services within our state's health care system. Our sample of medical interpreters, each of whom works on average in 2.5 different facilities and in 1.5
different cities or towns, has distinctively first-hand experience within the health care facilities to view the manner in which the facility attempts to provide services to the immigrant and limited-English proficient populations.
The national report from the Joint Commission and California Endowment released earlier this year, entitled Hospitals, Language, and Culture: A Snapshot of the Nation explored cultural and linguistic services in the national’s hospitals. They found that hospitals identified many
challenges related to providing care to culturally and linguistically diverse patient populations. The most frequently cited challenges related to language and staffing.xxiv
11
10
79
32
12
7
8
4
0% 20% 40% 60% 80% 100%Not sure what it is Do not conduct Often conduct Always conduct
Taken from the four mandates of the CLAS Standards listed below, we created five survey questions that would give an insight into the level of compliance to the CLAS standards Nebraska organizations are attaining.
Without mentioning the CLAS Standards, the question on the survey was: “From your
experience at any health organization with which you are familiar, please rate the organization’s efforts being made in the following areas. Circle the number from 5 (excellent) to 1 (poor).” Of these five questions, there was one question each for Standards 4, 5, and 6, and two questions based on Standard 7.
National Standards on Culturally and Linguistically Appropriate Services (CLAS)xxv
The CLAS standards are primarily directed at health care organizations; however, individual providers are also encouraged to use the standards to make their practices more culturally and linguistically accessible.
The principles and activities of culturally and linguistically appropriate services should be integrated throughout an organization and undertaken in partnership with the communities being served. CLAS mandates are current Federal requirements for all recipients of Federal funds (Standards 4, 5, 6, and 7).
Standard 4: Health care organizations must offer and provide language assistance services,
including bilingual staff and interpreter services, at no cost to each patient/consumer with limited English proficiency at all points of contact, in a timely manner during all hours of operation.
Stan