NCHRP Project 20-7/ Task 215
STATEWIDE INCIDENT REPORTING SYSTEMS –
BUSINESS AND TECHNOLOGY PLAN
FINAL REPORT
Prepared for:
National Cooperative Highway Research Program
Transportation Research Board
National Research Council
L.M. Burgess, P. Pretorius and J. Dale
Kimley-Horn and Associates, Inc.
7878 North 16th Street, Suite 300
Phoenix, Arizona 85020
ACKNOWLEDGEMENT OF SPONSORSHIP
This work was sponsored by the American Association of State Highway and Transportation Officials, in cooperation with the Federal Highway Administration, and was conducted in the National Cooperative Highway Research Program, which is administered by the Transportation Research Board of the National Research Council.
Project Panel:
Galen McGill – Oregon Department of Transportation (Chair) Darrell Bingham – Arizona Department of Transportation John Corbin – Wisconsin Department of Transportation David Helman – Federal Highway Administration Greg Laragan – Idaho Transportation Department
Joel Markowitz – Metropolitan Transportation Commission, Oakland, CA James McGee – Nebraska Department of Roads
Robert Rupert – Federal Highway Administration
James Schultz – Michigan Department of Transportation William Stoeckert – I-95 Corridor Coalition
Lieutenant Steve Turcott – Washington State Police NCHRP Project Staff:
B. Ray Derr, Adrienne Blackwell
DISCLAIMER
This is a final report as submitted by the research agency. The opinions and conclusions expressed or implied in the report are those of the research agency. They are not necessarily those of the Transportation Research Board, the National Research Council, the Federal Highway Administration, the American Association of State Highway and Transportation Officials, or the individual states participating in the National Cooperative Highway Research Program
Statewide Incident Reporting Systems
NCHRP Project 20-7/Task 215Business and Technology Plan
Table of Contents
Executive Summary ...iii
Chapter 1 – Introduction...1
1.1 Project Overview and Purpose ...1
1.2 Overview of SAFETEA-LU 1201 ...2
1.3 Other Initiatives ...2
1.4 Organization of Business and Technology Plan...3
Chapter 2 – Data Collection and Methodology ...4
2.1 Initial Request for Information Web Survey...5
2.2 Interviews with Candidate Sites ...6
2.3 Expert Panel Discussions ...6
2.3.1 CAD Integration Expert Panel...7
2.3.2 Multi-State Incident Reporting Systems Expert Panel...8
2.3.3 Private Data Sources for Statewide Incident Reporting Expert Panel...8
2.4 Statewide Incident Reporting Workshop ...9
Chapter 3 – Statewide Incident Reporting – Status, Challenges and Trends ...11
3.1 Status of Statewide Incident Reporting Systems...11
3.2 System Data Collection and Information Exchange...13
3.2.1 Types of Facilities Included in Statewide Reporting Systems ...14
3.2.2 Incident Types included in Reporting Systems ...15
3.2.3 Data Collection Methods and Sources ...16
3.3 Focus Areas for Incident Reporting System Operations and Functionality...19
3.3.1 CAD Integration...19
3.3.2 Multi-State Incident Reporting Coordination...23
3.3.3 Use of Private Sector Data to Support Statewide Incident Reporting ...26
3.3.4 ITS Standards for Data Exchange...27
3.4 Summary of Key Issues and Trends ...30
Chapter 4 – Challenges and Options for Developing Integrated Statewide Incident Reporting Systems ...32
4.1 Incident Data and Data Collection...32
4.1.1 Types of Incidents...32
4.1.2 Data Elements ...33
4.1.3 Location of Incidents...34
4.1.4 Data Collection ...34
4.1.5 Standards ...35
4.1.6 Gaps in Current Practices ...36
4.1.7 Key Issues and Barriers...36
4.2 Statewide Incident Reporting System Functions and Operations ...37
4.2.2 Benefits of Integrated Incident Reporting Systems ...38
4.3 Resources and Institutional Relationships ...39
4.3.1 Cost Requirements ...40
4.3.2 Gaps and Strategies to Close Gaps ...40
Chapter 5 – Next Steps: Deployment and Implementation Recommendations, Responsibilities...42
5.1 Priority Strategies for AASHTO SSOM and Task Force ...44
5.2 Additional Actions and Strategies ...45
Appendix A – Resources and Reference Documentation ...52
Appendix B – On-Line Web Survey Questions and Summary of Responses ...56
Appendix C – State Interview Questionnaire ...57
Appendix D – Workshop Attendees...63
List of Charts Chart 1 – Types of Systems in Use (Geographic Coverage) ...11
Chart 2 – Primary Uses of Incident Reporting System Data ...13
Chart 3 – Roadway Facilities Included in Reporting System...14
Chart 4 – Types of Incidents Captured...16
Chart 5 – Sources of Incident Data ...17
Chart 6 – Automated Interfaces between Reporting Systems and Other Agencies...18
List of Tables Table 1 – State Representatives Interviewed Through Detailed Survey...6
Table 2 – Expert Panel Participants and Agencies...7
Table 3 – Incident Location Referencing and Identifiers ...15
Table 4 – Transportation Standards to Support Incident Reporting and Related Operational Functions ...28
Table 5 – Public Safety Standards Related to Incident Reporting and Coordination with DOT...30
Table 6 – Overview of Strategies and Action Plans...47
List of Figures Figure 1 – Outreach and Data Collection Sources and Activities...4
Executive Summary
AASHTO, the Transportation Research Board, and the National Cooperative Highway Research Program embarked on an 7-month research effort to document current
statewide incident reporting systems and strategies, issues and systems that are currently in place with state DOTs. The emphasis of this effort was to develop a Business and Technology Plan to identify current state-of-the-practice relative to real-time incident reporting, and identify strategic directions and actions needed to meet the SAFETEA-LU real-time system management information program objectives.
Over time, and as state DOTs have responded to increased operations demands, statewide incident reporting systems have become mission critical tools. To help state DOTs
continually improve and expand their incident reporting capabilities, key partnerships with public safety, law enforcement, neighboring states, and local jurisdictions have proved successful, yet many states still face challenges for sustaining and enhancing their incident reporting capabilities and strategies.
This plan documents feedback and input received through an extensive stakeholder outreach effort, including web-based surveys, detailed discussions with selected state DOTs, a full-day workshop held in June 2006.
§ Thirty-four state DOTs responded to the web survey and provided
information about their current statewide reporting systems including types of data collected, partnerships for data collection, operational areas supported by their system, in-house vs. vendor developed systems, and any future plans for system enhancements.
§ From the web surveys, 10 states were selected for more detailed discussions about their reporting systems, which included data formats, standards issues, resource requirements for operating and maintaining their system, lessons learned, and benefits.
§ Expert panel conference calls were held to obtain input about CAD/DOT reporting system integration, use of private sector data for incident reporting, and multi-state incident reporting issues.
§ A full-day workshop was held in Boston in June 2006 which included the project panel and representatives from several states to discuss the research findings, identify key issues, challenges, priorities, and identify important next steps.
Outreach and Data Collection Literature and Documentation Initial National Scan (Web Survey) Interviews with State
Focus Area Summaries
CAD/DOT Reporting System Integration
Recognizing that public safety and law enforcement is a key information source for highway incident data, several states are in the process of implementing interfaces between public safety CAD systems and DOT reporting systems to facilitate incident information exchange. Oregon, Washington, Utah and Arizona are using various CAD/DOT integration models. Each state represents different approaches and models, and each articulated key institutional, technical and procedural challenges and lessons learned in establishing this vital interface for sharing incident data:
§ Leadership (and funding) for establishing CAD/DOT interfaces rests primarily with the DOT, and there are sometimes challenges with selling the benefits of this integration to public safety partners.
§ Competing standards at the national level are in different directions to support true interoperability and seamless data sharing.
§ There are gaps in data from Public Safety CAD systems – DOT reporting systems often rely on information fields, whereas pertinent information in CAD is often in free-form text, requiring DOT operators to extract relevant information to input to the pre-defined fields in their reporting system.
§ Automated interfaces to CAD incident data still rely on DOT operator judgment and experience for effective information management.
Multi-State Incident Reporting
Three multi-state organizations were interviewed as part of this research effort: § Gary-Chicago-Milwaukie Coalition
§ I-95 Corridor Coalition § North/West Passage Corridor
These three organizations present different stages of development for information sharing across state boundaries.
Challenges of developing a multi-state incident reporting system lie in both physical obstacles and organizational boundaries. Some of the physical obstacles surface due to the variations in the operations of the various reporting systems. Other variations are evident based on the type of incidents the systems were designed to capture.
All three expert panel participants support a Systems Engineering approach to developing a multi-state incident reporting system. This process invites the input of all stakeholders and guides the organization through the development of requirements prior to looking at any design alternatives.
The dynamic nature of system development and operations of multiple systems makes it difficult to design a solution that actually integrates the data. Most states are supportive of the multi-state organizations, but have limited sources for fiscal contributions. These organizations stressed the importance of developing a business plan and investigate funding options for the implementation and ongoing operations/enhancements.
ITS Standards for Data Exchange
Standards become increasingly important when exchange of data is occurring between two or more entities. The issue of ‘competing’ and ‘disconnected’ standards, at the federal level, was raised by several states. FHWA and Homeland Security are going down separate paths when it comes to requiring agencies to apply standards to promote consistency and interoperability.
State DOTs are using federally-endorsed standards to support information sharing for real-time traffic management, traveler information, incident management and other key operational functions (IEEE 1512, SAE J2540-2 and J2354, TMDD and others).
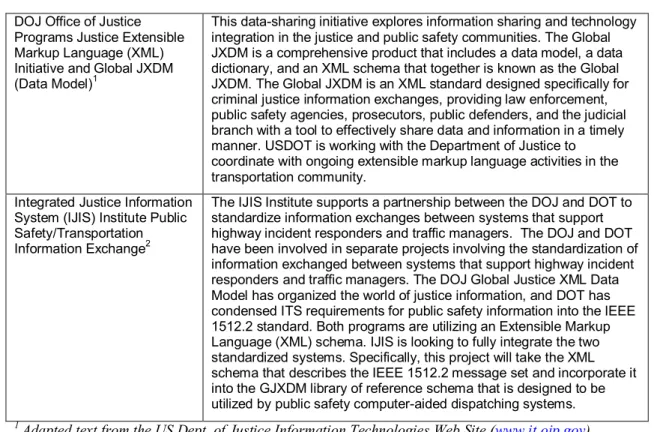
The Department of Justice/Homeland Security is promoting the use of the Global Justice XML for public safety applications. DOT-oriented system developers are following the FHWA mandated standards, and CAD developers need to adhere to a different set. A few states indicated that although these standards have greatly helped to support more robust and consistent incident reporting and information exchange, there are still several areas where standards are not meeting needs. Two major concerns with the existing state of standards are the number of standards that are available and the divergence that
different agencies, most importantly DOT and public safety, are creating by following the standards established by separate organizations. Another challenge inherent with
standards is the fact that it is a dynamic process – trying to apply new standards to legacy systems does not always ensure compliance. As reporting systems are expanded,
enhanced and in some cases completely replaced, standards should be a part of the development and design process.
For there to be long-term success, there needs to be coordination at the federal level to harmonize these standards efforts. To assist in closing the gaps being created by the varying standards organizations, it is important to bring representatives from the
stakeholder agencies together to develop interagency relationships and look at long term incident management goals. One role that AASHTO could play would be to become a champion of coordinating the development of more unified incident management standards.
Private Sector Data Sources for Incident Reporting
Although common in metropolitan areas for DOTs to partner with private traffic
reporting firms and media to share and disseminate incident information, on a statewide level this relationship is not common. One exception is weather data; several of the states that responded to the initial web survey indicated that they do use forecasted weather data from the National Weather Service (NWS) or similar weather information provider. Private sector provision of incident data to public agencies, other than On-Star’s partnerships with a select few states, is limited in the industry.
Restrictions on the use of data from the private sector vary depending on the terms of a contract or an agreement. Public sector data is often provided to multiple partners – both public and private – typically at no charge. Private sector, on the other hand, needs to be able to assess a value on the data they collect through their infrastructure. Often times this is reflected in a contractual fee arrangement or restrictions on the public sector being able
to use the data for purposes outside of traffic management (such as providing travel times through a public website).
Recommended Priorities
In September 2006, the AASHTO Subcommittee on Systems Operations and Management met in Orlando, Florida. At this meeting, the task force identified key priorities to take on in the next few years. Although there were several potential next steps identified from this Business and Technology Plan, the following represent the high priority items for AASHTO that the task force recommends moving forward:
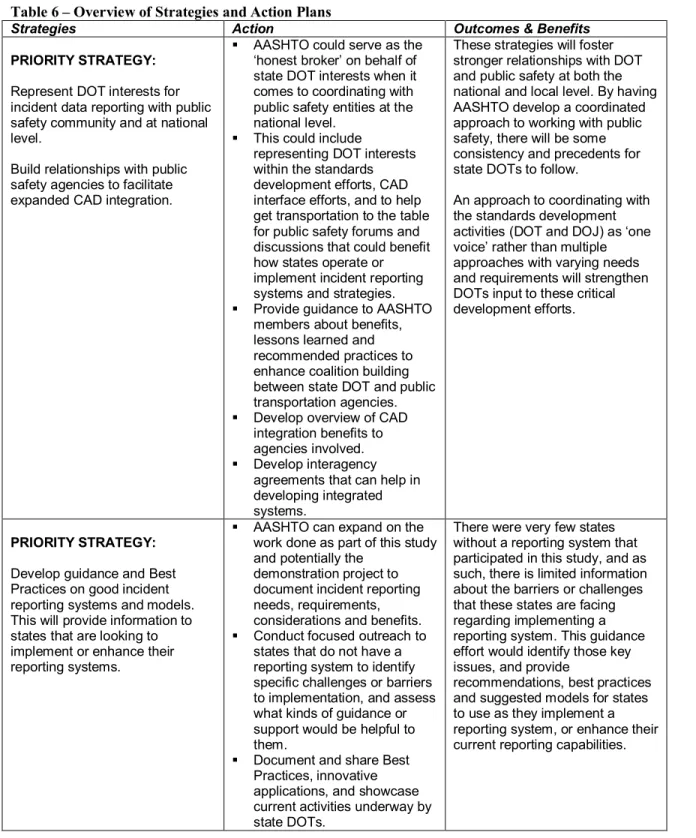
§ Coordination with the public safety community on a national level. CAD integration with DOT reporting systems was identified as a key priority, and while there are several state DOTs that are successfully partnering with public safety, there is a more concerted effort needed to engage public safety at a national level. Coordination among AASHTO, ITE, ITS America, FHWA, the National Traffic Incident
Management Coalition (NTMIC) and Association of Public Safety Communications Officials (APCO), among others, will help to maintain an important dialogue between transportation and public safety. It will also help AASHTO and these entities to identify where synergies among efforts can occur to advance this coordination to support incident reporting objectives.
§ Outreach and information sharing about incident reporting best Practices.There is a need to document and share best practices, benefits, and innovative approaches that state DOTs are implementing relative to incident reporting. There are still many states that have not yet implemented a statewide reporting system – due to budget
restrictions, competing priorities, lack of technical resources, and other reasons. These states could benefit from a centralized source of information on Best Practices and current activities nationally to help justify the need within their own states for investing in a statewide reporting system. The information gathered as part of this Business and Technology Plan provides a good starting point, and the SSOM task force agreed that continuing to build the Best Practices resources can help to document current activities, identify benefits, demonstrate how other states have overcome challenges and barriers, and innovative approaches for incident reporting. § Coordination with National ITS and Public Safety Standards Development Efforts.
Several sections in this Business and Technology plan discuss the challenges with conflicting standards in the DOT community as well as the public safety community. AASHTO can represent state DOT needs and interests as part of activities to close the gap between the standards development efforts. Key activities as part of this strategy would be to coordinate with states to define state DOT reporting system data needs, required fields and articulate the real-time data requirements. Identifying where there are opportunities to reach out to the CAD vendor industry would also help in
Chapter 1 – Introduction
1.1 Project Overview and Purpose
As state departments of transportation are faced with increasing 24/7 operations and management responsibilities, mission-critical functions like traffic management, incident management and traveler information require tools and resources for effective, efficient and consistent operations.
Statewide incident reporting systems have become a critical part of DOT operations and functions. Many states initially implemented their reporting systems to support better coordination and communication of planned construction or maintenance activities along roadway facilities for which they are responsible. Major incidents could also be noted and identified so that DOT resources would be aware of any restrictions or closures. Over time, and as state DOTs have responded to increased operations demands, statewide incident reporting systems have become mission critical tools. To help state DOTs continually improve and expand their incident reporting capabilities, key partnerships with public safety, law enforcement, neighboring states, and local jurisdictions have proved successful, yet many states still face challenges for sustaining and enhancing their incident reporting capabilities and strategies.
The SAFETEA-LU legislation (Section 1201) includes a significant emphasis on real-time system monitoring and information reporting, and includes requirements for Statewide Incident Reporting system. Currently there is no guidance or common understanding of what qualifies as a statewide incident reporting system and what is required to develop or maintain such a system; however, the draft FHWA guidance on SAFETEA-LU 1201 does provide some guiding definitions on what constitutes “real time”.
§ Construction closures / openings within 30 minutes; 15 minutes in metro areas § Confirmed road or lane blocking incident information within 15 minutes § Roadway weather conditions updated at least 30 minutes
§ Congestion information updated at least 15 minutes § Travel times reflect conditions no older than 10 minutes § Transit disruptions updated at least 30 minutes
AASHTO, the Transportation Research Board, and the National Cooperative Highway Research Program embarked on a seven-month project to document current statewide incident reporting strategies, issues and systems that are currently in place with state DOTs. The emphasis of NCHRP Project 20-7/215 was to identify current state of the practice relative to real-time incident reporting, and identify strategic directions and actions needed to meet the SAFETEA-LU real-time system management information program objectives. This Business and Technology Plan serves as a synthesis of the outreach activities, information obtained through surveys and interviews, as well as recommended roles and actions for key stakeholders at the national level.
1.2 Overview of SAFETEA-LU 1201
The intent of Section 1201 of the SAFETEA-LU legislation is to establish a program that will support the development of a system for monitoring and sharing real-time conditions on major highways in all States. The emphasis on real-time system monitoring and reporting is intended to improve security, congestion, and the response to incidents affecting the transportation system. The transportation system is currently defined as limited access roads in the National Highway System (NHS) and major arterials in metropolitan areas. Five different types of conditions have also been outlined in the current guidelines and include road and lane closures, adverse weather conditions,
congestion, travel times in congested metropolitan areas, and transit service disruptions in metropolitan areas. Some tools that have been suggested for outcomes of the program include a publicly available web site, 511, updated regional ITS Architectures, and access to data through the Internet. The implementation of an effective system could provide users of the transportation system with valuable information and empower them to make better decisions.
The impact on state DOTs is not clearly defined at this point as the implementation details of Section 1201 requirements are still being developed. There are no new funding sources being established to support projects focused on meeting Section 1201
requirements, but the projects are available to utilize Federal–aid from National Highway System (NHS), Surface Transportation Program (STP), Congestion Mitigation and Air Quality (CMAQ) funds for deployments, while State Planning and Research (SPR) funds can be applied for the planning phases of real-time monitoring systems.
1.3 Other Initiatives
On May 4, 2006, the FHWA posted a Federal Register as FHWA Docket No. FHWA-06-24219 requesting comments on the Real-Time System Management Information Program as outlined in SAFETEA-LU Section 1201. This request for
information was followed by several presentations at ITS America and other conferences, requesting feedback on some of the recommendations. Initial responses appear to
represent viewpoints from a majority of the state DOTs as well as other transportation agencies and organizations. The AASHTO Subcommittee of Systems Operations and Management (SSOM) submitted a response on July 3, 2006 based on feedback from the committee members that represent 12 states. This response is included with the Appendix of this report and can also be viewed at the following link,
http://highways.transportation.org/sites/scoh/docs/Real-Time%20Info%20RFI%20response%20-%20draft%206-15-06.pdf.
Weather information and weather condition/impact reporting is a key topic among many state DOTs, particularly with the increased deployment of traveler information systems. There are many variations on how weather impacts are communicated, there are some commonalities. As an example, fog, foggy conditions, reduced visibility due to fog, heavy fog are all terms that a motorist should be able to interpret, but there is not consistency from state to state in how those conditions are reported or communicated. The AASHTO 511 Coalition conducted a survey of states and documented what kinds of terminology are being used to document and report weather conditions and impacts, and this revealed a wide range of variations on some common conditions but no standard for
how weather impacts are being reported. Another related weather reporting and weather data collection and exchange effort, is theClarus Program which is analyzing the
implementation of an national Road Weather Management system.Clarus is an initiative that is partnering the USDOT and the National Oceanic and Atmospheric Administration (NOAA) focused on providing “information to transportation managers and users to alleviate the affects of adverse weather (e.g. fatalities, injuries, and delay).” The current schedule anticipates a demonstration to be in place by early 2007. Roadway weather conditions and the impact of weather on the transportation system are key incident types that are being analyzed as part of the Statewide Incident Reporting System.
1.4 Organization of Business and Technology Plan
This document is organized into the following key sections: § Executive Summary
§ Chapter 1 – Introduction: Includes an overview of the study and key objectives, identifies other related efforts, and the potential impact of the SAFETEA-LU 1201 requirements on real-time incident reporting.
§ Chapter 2 – Data Collection and Methodology: This chapter describes the data collection and outreach efforts with state DOTs about their incident reporting capabilities. It includes a description of the national web survey, detailed interviews with selected states, expert panels focused on specific topics related to incident reporting, and a stakeholder workshop held in Boston in June 2006.
§ Chapter 3 – Statewide Incident Reporting – Status, Challenges and Trends: This chapter provides results of the feedback received about statewide incident reporting systems that are currently in use. It includes information about data collection and information exchanges, types of systems that have been implemented, and the coverage area and types of incidents that are currently being captured. It also documents feedback from panels focused on CAD integration, multi-state incident coordination, ITS standards for data exchange and use of private sector data for incident reporting.
§ Chapter 4 – Challenges and Options for Developing Integrated Statewide Reporting Systems: Chapter 4 outlines some of the challenges states are currently facing for statewide data collection, issues with conflicting standards from the transportation and public safety communities, data exchanges among partners, and costs for system implementation and enhancements. It also summarizes benefits and strategies for how to address gaps in data collection, operational policies and other facets of their
incident reporting programs.
§ Chapter 5 – Next Steps: Deployment and Implementation Recommendations,
Responsibilities: This section summarizes the key issues and challenges identified in this study, and serves as an action plan for AASHTO and its federal partners in how to best support state DOTs as they move toward more real-time and enhancement incident reporting systems. Priority actions for the SSOM and Task Force are also identified.
Chapter 2 – Data Collection and Methodology
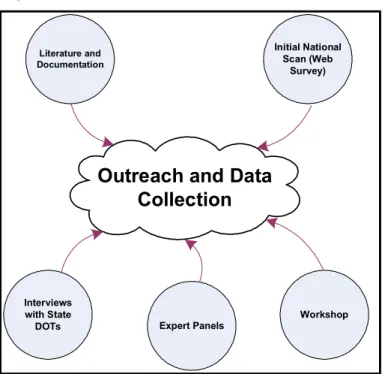
The data collection effort for this project consisted of several individual steps (shown in Figure 1) that were each focused on a specific audience and certain feedback:
§ The initial effort was a high-level web survey sent to DOT representatives (via the AASHTO SSOM Committee List) to determine what states are currently doing with respect to statewide incident reporting.
§ From the survey, 10 states were selected for in-depth interviews to discuss more details about their existing systems, functions, how the systems are integrated with other systems and operational areas, and to document lessons learned.
§ Expert panel conference calls were coordinated to gain insight into three key areas of Statewide Incident Reporting Systems: CAD Integration, Multi-State Incident
Coordination and Private Sector Data to Support Incident Reporting (note: The Private Sector Panel was modified to instead obtain feedback from a NATMEC conference panel focused on cell phone probes, as well as individual discussions with states that have experience integrating data obtained from the private sector)
§ The final effort was a workshop in Boston, Massachusetts that involved
representatives from state agencies, multi-state coalitions, and the private sector.
Figure 1 – Outreach and Data Collection Sources and Activities
More details about the structure and intent of these data collection efforts and a summary of the feedback that was collected are included in this section. An overarching component to this research effort was to identify, review and document applicable literature. A resource list of documents and web-based links is included inAppendix A.
Outreach and Data Collection Literature and Documentation Initial National Scan (Web Survey) Interviews with State
DOTs Expert Panels
2.1 Initial Request for Information Web Survey
The first phase of data collection was focused on generating a wide range of responses and providing the project team with a broad overview of what is currently in place for statewide incident reporting systems. A web survey tool provided by AASHTO was selected as an appropriate mechanism for this effort based on the ability to reach a large number of recipients, a simple format, and a minimal amount of time required to respond. The twelve questions and multiple choice answers were developed based on the format allowed by the web survey tool and the format of the summary that was generated. The web survey tool generated a report of summary charts providing a cross-section view of the responses and a spreadsheet containing text for the detailed responses.
One of the primary goals for this data collection effort was to generate a candidate list of approximately ten states for a more detailed interview. In an effort to develop the most comprehensive list of candidate states to represent the current state-of-the-practice, the project team wanted to reach a large number of possible respondents. To achieve this, multiple outreach efforts were utilized to expand knowledge of the survey. The original request for responses was distributed to the AASHTO SSOM Committee. The request was then forwarded to other agency representatives that were identified as potential information sources. Finally, members of the project team and oversight committee coordinated personal contact with various agency representatives to encourage feedback through the online survey. The multiple outreach efforts were successful and generated a total of thirty-four individual responses.Appendix B includes the questions that were asked through the on-line survey.
The detailed survey responses from the web survey were reviewed closely to identify ten candidate states to be contacted for more in-depth interviews. The candidate state
selection process weighed several parameters. Some states without statewide incident reporting systems were selected in order to capture what technical or institutional
limitations exist. Both states with in-house and vendor developed systems were selected. The states with vendor provided systems were further selected so that multiple vendors were represented. Some states were selected based on their level of integration with public safety CAD data, their integration or coordination with multi-state systems, or their use of private data sources. The final list of ten states included Oregon, Arizona, Washington, Kansas, Minnesota, North Carolina, Maryland, Connecticut, Virginia, and Florida. The determination of the final list of candidate states provided a strong cross-section for the key areas of focus for this project.
2.2 Interviews with Candidate Sites
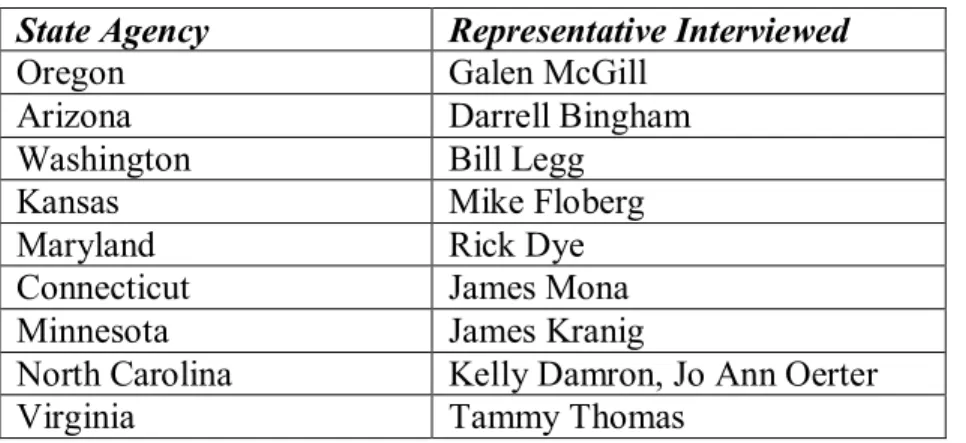
From the survey responses, the project panel selected the following states for detailed interviews about their reporting systems:
Table 1 – State Representatives Interviewed Through Detailed Survey
State Agency Representative Interviewed
Oregon Galen McGill
Arizona Darrell Bingham
Washington Bill Legg
Kansas Mike Floberg
Maryland Rick Dye
Connecticut James Mona
Minnesota James Kranig
North Carolina Kelly Damron, Jo Ann Oerter
Virginia Tammy Thomas
The detailed survey was broken into ten specific sections focused on collecting detailed feedback from the candidate states. Each of the following ten sections consisted of multiple questions intended to guide a conversation between the interviewer and the agency representative:
§ Section 1 addressed the candidate’s biographical information such as the state being interviewed, the name or names of the representatives participating in the interview, and any other agencies that may be involved with the incident reporting system. § Section 2 focused on the characteristics, functionality and the development of the
Statewide Incident Reporting System.
§ Section 3 captured the agency’s current use of an incident severity index and the definition of any severity thresholds that may be in place.
§ Sections 4, 5, and 6 looked at the integration and coordination with the data from computer aided dispatch (CAD) systems, multi-state systems, and private data sources, respectively.
§ Section 7 focused on the benefits and limitations in ITS Standards for data exchange. § Sections 8 and 9 summarized the agency’s role in data archiving and in data quality. § Section 10 captured the agency’s lessons learned and perceived benefits from
implementing a Statewide Incident Reporting System.
A copy of the questionnaire used for the state interviews is included inAppendix C.
2.3 Expert Panel Discussions
In parallel with the candidate state interviews, expert panel conference calls were
coordinated to collect further data in four distinct subject areas. Based on a review of the web survey results and through references from the oversight committee, expert panel participants were identified for each of the subject areas including: CAD Integration, Multi-state Incident Reporting Systems, Private Data Sources for Incident Reporting, and
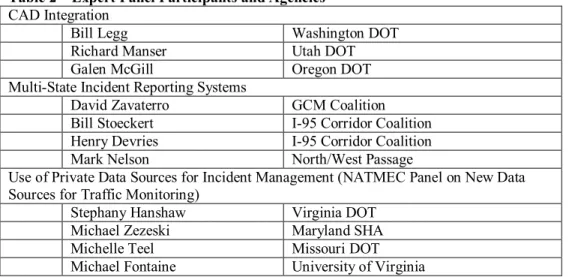
ITS Standards for Data Exchange. Unfortunately, numerous schedule conflicts and tight project schedule prohibited participants from conducting the ITS Standards conference call, and it was decided that information about private sector data sources for incident reporting would be gathered from a round-table session at the NATMEC conference (Minneapolis, MN, June 2-4, 2006).Table 2 shows the participants and corresponding agencies for each expert panel that was successfully conducted.
Table 2 – Expert Panel Participants and Agencies
CAD Integration
Bill Legg Washington DOT
Richard Manser Utah DOT
Galen McGill Oregon DOT
Multi-State Incident Reporting Systems
David Zavaterro GCM Coalition
Bill Stoeckert I-95 Corridor Coalition
Henry Devries I-95 Corridor Coalition
Mark Nelson North/West Passage
Use of Private Data Sources for Incident Management (NATMEC Panel on New Data Sources for Traffic Monitoring)
Stephany Hanshaw Virginia DOT
Michael Zezeski Maryland SHA
Michelle Teel Missouri DOT
Michael Fontaine University of Virginia
2.3.1 CAD Integration Expert Panel
The CAD Integration expert panel included representatives from the Washington DOT, Utah DOT, and Oregon DOT, which all currently have a data feed from at least one public safety agency CAD system. Arizona DOT was also interviewed in detail about their TOC/CAD connection as part of their system interview. Each agency that provided input had a different level of integration between the transportation and public safety systems – these ranged from direct users of the State Police CAD, to system-to-system interfaces and viewing privileges of CAD data that affected the transportation network. Key lessons learned emphasized that there were a range of institutional and technical issues that varied from state to state. Coordination between transportation, public safety and CAD vendors was paramount, including involving Information Technology
personnel early in the process, coordinating with CAD vendor schedules, and maintaining good dialogue among the key participants (changes in personnel on all sides can
significantly delay implementation).
Some issues related to data sharing exist with the variance between the DOTs’ data fields in the incident reporting systems and the public safety’s text fields within the CAD system. Another issue is the competing federal standards between the DOTs’ real-time management approach (IEEE 1512) and the public safety’s records management
approach (DOJ Global Justice XML). The feedback collected from the CAD integration expert panel conference call provided some insight about issues and lessons learned that could be presented for discussion during the workshop.
More detail about specific CAD and statewide reporting system interfaces, as well as standards issues that impact seamless data sharing, is included in subsequent sections.
2.3.2 Multi-State Incident Reporting Systems Expert Panel
The three organizations represented on the Multi-State Incident Reporting Systems expert panel were the GCM (Gary-Chicago-Milwaukee) Coalition, the I-95 Corridor Coalition, and the North/West Passage. These organizations represent three different regions in size, geographical composition, and at varying stages of development with regard to
information sharing. Despite these variations, each coalition has taken a slow and
deliberate approach to developing a sound multi-state relationship because they recognize this foundation as the most important step in their development and success.
§ The GCM Coalition is a coordinated traffic management effort covering seventeen (17) counties in Indiana, Illinois, and Wisconsin and utilizes The Gateway Central System to collect, fuse, and share data. The GCM Coalition has seen benefits from the interstate relationships and the information sharing programs that have been developed. The GCM Coalition was formed in 1993 and has developed The Gateway Central System as an information clearinghouse while continuing to maintain three individual transportation management centers in each urban area.
§ The I-95 Corridor Coalition is a partnership of state departments of transportation, regional and local transportation agencies, toll authorities, and related organizations, including law enforcement, port transit and rail organizations, from Maine to Florida, with affiliate members in Canada. The I-95 Corridor Coalition has seen that a key component to sharing incident data is through involving the operations level personnel and building the inter-agency relationships prior to building inter-system connections. The I-95 Corridor Coalition began in the early 1990’s as a means to better communicate and manage major incidents along the I-95 corridor. Since the inception, the Coalition has expanded its focus to all modes of transportation and is leading an effort to develop an integrated information sharing system for its members. § The North/West Passage involves eight states in the I-90 and I-94 corridors and is
very young in comparison to the GCM and I-95 Corridor Coalitions. Since the population centers in this region are not typically close to the states’ borders, the primary focus of the data sharing initiative is planned to focus on weather impacts to the two interstate corridors. The North/West Passage was formed in 2001 and is succeeding as an information sharing forum as well as initiating the systems engineering approach for a data sharing initiative for the region.
The participating agencies and stage of development for each of these coalitions is very different, but the overarching goals of improved coordination for information sharing and interagency relationships have proven similar. Regional organizations are feasible
building blocks to a broader, national incident reporting approach. Coordination within and between these coalitions will help facilitate that growth.
2.3.3 Private Data Sources for Statewide Incident Reporting Expert Panel
The availability of private data sources for transportation management information is more common for regional and urban areas and is typically not as feasible for a statewide system. Private data sources typically capture speed and travel time data and do not capture incident data; an exception are the traffic reporting and media services that rely on visual identification of an incident or information from public safety scanners.
In lieu of a conference call, the research team attended a panel session titled, “New Data Sources: Cell Phones for Traffic Monitoring” held at the NATMEC conference in Minneapolis, MN June 4-7, 2006. This panel included representatives from Missouri DOT, Maryland State Highway Administration, Virginia DOT and Virginia Tech. Primarily focused on the use of cell phones as probes, these panelists shared their experiences about data availability, accuracy, and ability to use this data for traffic management/traveler information/incident management. This model is still in the early stages, but the concept is one that would be viable for supporting data collection on a statewide basis. Programs in Missouri, Georgia and Kansas should be monitored for how the evolution of this model could support incident reporting.
Other private data sources that were discussed as part of the state interviews included some limited partnerships with On-Star, which is embarking on some pilot deployments of data exchange of incident information with CARS states and Oregon DOT.
2.4 Statewide Incident Reporting Workshop
The final phase of data collection for this project was a workshop held on June 22, 2006 in Boston, Massachusetts. Invitations to the workshop were sent to representatives from the agencies contacted during the web survey, the detailed interviews, and the expert panel conference calls, but were also extended to representatives from the private sector. Participation was further boosted by coordinating the date and location of the workshop with an I-95 Corridor Coalition Meeting that was already scheduled in Boston on the preceding day. The agenda of the I-95 Corridor Coalition meeting was focused on the impacts of SAFETEA-LU Section 1201. Since Section 1201 has the potential to impact the role of statewide incident reporting systems, the project team felt the coordination of the two meetings could expand attendance and boost support of both meetings. A list of the workshop participants is included inAppendix D.
Along with analyzing some future goals for Statewide Incident Reporting Systems, one of the important objectives for the workshop was to develop some preliminary roles for the stakeholders involved. Not only was it possible to gain some knowledge of what the stakeholders hope to see as outcomes of this effort, but to also initiate discussion and support for how some of the action items could be accomplished and who/which entity was a logical choice to champion those actions. As certain actions were discussed during the workshop, the roles of several agencies, including FHWA, AASHTO, multi-state coalitions and state DOTs, were integrated into the discussion.
The agenda for the Statewide Incident Reporting System workshop included introductory presentations and break-out working groups focused on specific portions of the project. The workshop began with an introduction to the project and a discussion of the outreach efforts thus far. National perspective was provided by FHWA (SAFETEA-LU Section 1201) and AASHTO, and how this study fits in with other concurrent efforts at the national level. The morning session continued with a presentation of the data collected to date and discussions about how this data compared with the participants knowledge of other systems. The afternoon portion of the workshop divided the participants into three working groups that focused on Statewide Incident Reporting Systems, CAD Integration, and Multi-State Incident Coordination. The working groups discussed the data that had been presented during the morning sessions, some goals for each subject as it relates to
statewide incident reporting systems, and the roles for all of the stakeholders. The workshop ended with a presentation from each of the working groups, a review of the workshop, and a summary of the next steps for the project. The following is a summary of overarching discussion items from the workshop, and provides key input to potential strategies and areas for additional outreach:.
§ There are many variations on statewide reporting systems – states are developing and enhancing their systems to address very specific operational needs and supporting systems. Reporting systems continue to evolve to meet increased operational demand and responsibility, support new systems (such as traveler information), and expanded to include data from other partners, incorporating arterial data, CAD data, etc.
§ There are still several states that do not have incident reporting systems at a statewide level – how can this effort help them? What are the barriers to implementation? § Systems have evolved to meet very state-specific needs. Even the pooled fund models
(such as CARS) offer some flexibility to modify the application to suit a particular state’s needs. Washington is a good example of a ‘standardized’ reporting system that has been customized to meet WSDOT’s specific needs to support its traveler
information program, regional TMC model, and CAD integration.
§ There are several concurrent efforts going on among transportation and public safety – all aimed at better strategies for sharing real-time incident data. There is a need to find a way to align these efforts so that both communities are heading in some similar directions and can continue find some common ground.
§ Any effort to enhance or streamline statewide incident reporting and sharing of incident data is likely going to be led by the state DOTs – these are the agencies that will make the investments – financial, technical, and institutional – to develop and sustain robust systems.
At the outset of this research effort, a key objective was to identify whether these systems could – or should – support efforts toward a national incident data clearinghouse. Is there a need to implement consistent incident reporting nationally? There are good models out there for weather and construction, but where is the market for incident data? Through the workshop discussions about the need to focus on the building blocks of robust
incident reporting prior to working toward a national approach, group discussion pointed to more regional approaches than a ‘lowest common denominator’ national footprint. It is still unclear where FHWA is heading with a national clearinghouse concept. Private sector, such as On-Star and content providers, might be the target market, but states would not likely be willing to invest in significant alteration to their systems to accommodate the commercial marketplace.
The role of AASHTO, Federal Highway Administration, ITS America and other national consortia was also discussed. Through their member activities, national meetings and other established forums, these organizations play a critical role in promoting awareness of current activities, best practices and technology advances to support incident reporting systems and programs. Section 5 of this Business and Technology Plan includes
recommended strategies to promote improved coordination, communication and potential demonstration activities to showcase collaboration and advances in incident reporting.
Chapter 3 – Statewide Incident Reporting – Status,
Challenges and Trends
3.1 Status of Statewide Incident Reporting Systems
The thirty-four responses from the web survey provides a glimpse at some similarities in several of the data collection categories and some basic information concerning incident reporting systems from more than half of the individual United States. Most of the respondents are currently utilizing a statewide incident reporting system and are capturing incidents on State Routes, US Routes, and Interstates. The use of automatic data exchange with other systems, such as CAD or neighboring states, is very limited in the number and also inconsistent in the type of system that is connected. Based on the initial analysis of the web survey feedback, there are some similarities in the basic incident reporting systems, but the detailed interviews are able to provide more information about overlaps and consistencies among the states’ systems.
Twenty-three states utilize a statewide incident reporting system. The thirty-four responses received through the web survey provide a great gauge for statewide incident reporting systems in the United States. All of the responding agencies state that either a municipal, regional or statewide system is being managed within their state. Chart 1
provides an overview of the level of coverage being provided by the respondent states.
Twenty-seven of the responding agencies are capturing incidents on State Routes, US Routes, and Interstates. Thirty-two of the incident reporting systems are capturing incidents on the Interstate system within their statewide or regional systems.
Construction and maintenance, large scale emergencies, weather impacts to roads, and highway incidents are the primary types of incidents being captured. Most states have resources in place to collect the incident data so implementing reporting system typically builds on those available data sources.
Both in-house and vendor developed systems are being utilized. The states that are utilizing an in-house developed system also maintain detailed documentation on the original development and enhancements to the system. Even though the vast majority of the system development has occurred in-house, some states have chosen to contract specific components of their upgrades and enhancements. Theses states have also established working committees or oversight panels responsible for evaluating the programmed enhancements and oversee all in-house and outsourced enhancements.
The number of years that the systems have been in place ranges from two to twelve years.Connecticut is the youngest system of the states that were interviewed. It is utilizing a system developed through the Transportation Operations Coordinating Committee (TransCom) which is a regional effort focused on sharing data between Connecticut, New Jersey, and New York. North Carolina, Minnesota, and Kansas have all been in place for approximately six years and undergone a few upgrades. Arizona’s Highway Condition Reporting System was initially implemented in 1995, and has undergone two major updates (Y2K and 2003 with the 511 Model Deployment).
Enhancements and upgrades are also handled through in-house and vendor approaches. Most states are using a combination of in-house resources and vendor-supported functions for enhancements and upgrades. To date, North Carolina has conducted all of the system upgrades through in-house resources, but is looking at the possibility of outsourcing the next major upgrade. Virginia performs a majority of he system upgrades through in-house resources, but has selected specific components to be performed with vendor support. Maryland uses individual contractors with specific contracts on the system maintenance and upgrades. Minnesota is currently using vendor support for their system enhancements. Despite the variations in the approach of the system enhancements, the states have implemented structured programs for managing the improvements and focus on detailed documentation of all changes to the system.
Most states are utilizing minimal personnel for oversight of the system maintenance, but rely on field forces for support of the data being entered. With limited automated system interfaces for incident reporting, there is heavy reliance on DOT (and in some cases partner agencies) for data entry, verification and data monitoring. This includes users from DOT operations centers, maintenance divisions, public information offices, and other operational personnel. Some states also permit staff from other agencies such as law enforcement, counties, cities, etc. to enter data into the reporting system, although access is restricted to authorized and trained users. DOT maintains primary responsibility for verifying and approving information posted.
Advanced Traveler Information Systems (ATIS) are the primary uses for the incident data that is collected. Almost 70% of the responding agencies indicated that traveler
information functions – including phone, web and media advisories – are the primary operations functions supported by their incident reporting systems. 70% are currently providing the data through a traveler information phone line and almost 90% are sharing the incident data through a web site. Chart 2 shows the other uses for incident reporting system data.
Chart 2 – Primary Uses of Incident Reporting System Data
One of the most perceived benefits is the ability for states to provide consistent data to multiple customers in various formats. Virginia and Kansas both state that the greatest benefit they have recognized is a single source for incident data that feeds web site and 511 with consistent traveler information. Kansas has been able to provide more
up-to-date and accurate data to the trucking industry which is a key user market of the data. Oregon has been able to streamline ODOT regional operations staff efficiency in responding to public questions and inquiries. Arizona provides its data and incident information via an ftp site to numerous private partners for distribution through multiple traveler information resources. The common interface for data entry and the flexibility of the format in which the data can be shared are both improving the efficiency of agency operations and the relationships with other states and outside agencies.
3.2 System Data Collection and Information Exchange
States that responded to the survey, were interviewed or that participated in the workshops provide valuable input as to what kinds of information and data that are collected by their incident reporting systems, and what kinds of operational functions are directly supported by these systems. With the breadth and diversity of reporting systems
currently in use, there are, in some cases, hundreds of types of data that could be collected. The focus of this research effort is on incident reporting; as such, detailed discussions about non-incident information was not part of the discussions.
3.2.1 Types of Facilities Included in Statewide Reporting Systems
One of the key questions asked of states was to identify what types of roadway facilities were included in their statewide reporting systems. As shown inChart 3, the majority of roadway facilities were Interstate Highways, US Routes and State Routes. This stands to reason since state DOT’s are primarily responsible for operations and maintenance on these facilities. Additional respondents indicated that local roads and toll roads were also included. While there are state DOTs that have operations and maintenance
responsibilities for non-NHS facilities, there are others (such as Arizona) which have modified their reporting systems to include major arterials. Arizona’s Highway Condition Reporting System was expanded to include major arterials in the Phoenix metropolitan area so that they could be included in the 511 and az511.com traveler information services.
Chart 3 – Roadway Facilities Included in Reporting System
There are several ‘basic’ pieces of location information that are typically included with the statewide reporting systems surveyed. Table 3 shows typical as well as additional incident location identifiers. Several states, including North Carolina and Maryland, are also integrating their reporting systems with GIS maps to identify incident locations.
Table 3 – Incident Location Referencing and Identifiers
Typical Location Information Additional Incident Location Identifiers
Route Direction Latitude/Longitude Milepost Lanes affected County
Landmark or regionally significant identifier (such as nearby town, city, lake, National Park)
Interchange or other marker
Differentiating between the different types of facilities, particularly to provide accurate incident or impact locations, requires some modifications to standard incident location naming conventions. In some cases, ‘highway’ and ‘roadway’ need to be differentiated. For example, in Arizona’s Highway Condition Reporting System, highways (typically NHS system facilities) are defined based on mileposts and cross-roads and roadway incidents (primary and secondary arterials) are identified by cross-streets. Arizona’s HCRS currently cannot differentiate between frontage roads, mainline or ramps; however descriptors in the incident data entry screen can provide for more precise location
information, which is also transmitted to travelers.
3.2.2 Incident Types included in Reporting Systems
Similar to the types of facilities covered (primarily NHS and State Routes), statewide reporting systems surveyed focused primarily on capturing highway incidents, weather impacts to roadways, large-scale emergencies and construction activities (note: although construction activities are considered ‘planned’ events, many incident reporting systems include these as they have the potential to have similar impacts to mobility and capacity as an incident). Chart 4shows the range of incident types that are captured as part of current reporting systems. An interesting outcome of this survey was the amount of incidents on freeway-adjacent arterials that are also included in these DOT systems. Most arterials are not within the jurisdiction of the DOT, and inclusion of this data in a DOT-operated system shows a definite level of cooperation among DOT and other partners to obtain more comprehensive incident data on the transportation system.
Kansas implemented the first version of its system in 2001 with a focus on roadway weather conditions. It was expanded in 2004 to include a 511 component. The current system feeds incident data to a traveler information web site, 511, and the trucking industry. Since the inception, the trucking industry has remained a key user of the
KanRoads system. Kansas has defined incidents that should be entered into the statewide system as weather or construction incidents that will impact the roadway for more than 4 hours.
Chart 4 – Types of Incidents Captured
3.2.3 Data Collection Methods and Sources
Statewide incident reporting systems continue to evolve, in terms of types of data collected, sources of data and how data is acquired. Chart 5 indicates that there is a range of automated and manually entered data that comprise the majority of those statewide reporting systems that responded to the research team request for information. A key objective of this study was to identify how ready states are to meet real-time reporting requirements of SAFETEA-LU. Data collection strategies, such as Road Weather Information Systems, sensors, or CAD data feeds, are the most prevalent
sources of automated data on a statewide level; however, in the federal definition of ‘real-time’, there are a number of potential sources. Deployment of data collection
technologies that could support incident reporting is limited in rural areas outside of the urbanized areas, and reporting strategies for these areas place a more significant emphasis on gathering incident information from public safety, law enforcement, DOT
maintenance crews and other operations partners (vehicle detection technology responses in this survey were primarily urban area systems that were linked or incorporated into the statewide reporting systems).
Responses to the high level survey (and as shown inChart 5) indicate that the majority of data relies on visual observations and reports, including assistance patrol vehicles, law enforcement personnel, and the public. CAD interfaces to DOT reporting systems are becoming more prevalent, and are a vital link between transportation management and public safety to exchange incident data, particularly on a broad geographic scope such as
a statewide highway network. Law enforcement is a key resource for statewide incident information.
Chart 5 – Sources of Incident Data
Automated exchanges of incident information between DOT reporting systems and other agencies are somewhat limited. In fact, 37% of survey respondents indicated that there were no automated information exchanges for incident data collection. Chart 6
identifies the various types of information exchanges currently in use by reporting systems. State Police CAD and 911 CAD account for a majority of automated
information exchanges for incident data. Because 911 dispatching responsibility varies from state to state (and even within states), it is difficult to draw from the results the role of local police and fire. In some areas, the 911 Public Safety Access Point (PSAP) are police and fire dispatch, which could also include highway incidents.
Chart 6 – Automated Interfaces between Reporting Systems and Other Agencies
Regardless of the extent of automated data collection or interfaces with other agencies to obtain incident data, states that were interviewed expressed a strong reliance on TOC operators for data entry, verification, quality assurance, and monitoring. Operator training – and in some cases certification – were paramount in maintaining high standards of information accuracy and quality. Operator judgment is a critical factor for effectively operating and maintaining reporting systems. Operators often assign a severity or impact rating, must monitor incidents for new or updated information, or clear incidents from the system that are no longer impacting the transportation network.
Each state interviewed indicated that there were certain levels of authorization for operators that had access to the system. These typically included standard-level access, reviewer, supervisor, or editor, and the authorization level would dictate whether that operator could enter, edit, publish or delete information.
§ Arizona has expanded its reporting system to include cities, counties, transit, and other agencies. Arizona has approximately 300 trained users from ADOT and 12 other agencies. Each user must go through a training session, and is assigned an access code to be able to log on and enter information. Within the access code are certain restrictions, such as only being able to enter information about their jurisdiction, restrictions on that user from modifying other information, etc. This approach provides access to a range of transportation agencies in the state, thus increasing the amount of information that can be included. By offering restricted access, ADOT can also build-in quality control measures.
§ Oregon has approximately 200 users within ODOT that input data into the HTCRS. Oregon also has five private sector entities (contractors) that input construction project data. There are two levels of access – editor level and reviewer level. The majority of users can input data, but it does not publish to TripCheck.com or 511 unless a ‘reviewer’ approves (reviewers are typically TOC dispatchers). Each time an incident is entered, is goes into a review box, and an alarm sounds every three
minutes to alert reviewers that there is an incident waiting for approval.
§ Maryland has developed an extensive training program that includes certification for all users that complete the training. MDSHA employees also receive the opportunity for raises based on their certification. CHART has 25 users located in the statewide center, 3 regional centers, and certified users in several other agencies’ facilities including state police, local responders, toll, Washington D.C., and northern Virginia agencies.
§ Washington DOT restricts access to WSDOT employees, which includes TOC operators, maintenance supervisors and PIOs. A unique feature of WSDOT’s reporting system is that the access is also restricted as to what users can view. For example, only TOC operators can view CAD data from Washington State Patrol.
3.3 Focus Areas for Incident Reporting System Operations and Functionality
3.3.1 CAD Integration
Recognizing that public safety and law enforcement are key information sources for highway incident data, several states are in the process of implementing interfaces between public safety CAD systems and DOT reporting systems to facilitate incident information exchange. Four states that are using various CAD/DOT integration models were interviewed during this research effort, and provided insights to the technical and institutional issues, benefits and challenges of this integration effort.
Washington DOT and Utah DOT were both participants in a Field Operational Test sponsored by the USDOT’s ITS Public Safety Program to demonstrate CAD/DOT integration and information sharing. Both states saw successful implementation of the interface between their incident reporting systems and public safety CAD.
Washington CAD Integration Field Operational Test:
Washington’s implementation involved connecting Washington State Patrol’s new CAD system and the Washington DOT Condition Acquisition and Reporting System (CARS) to provide the DOT with information about highway incidents and other impacts: § WSDOT receives a one-way data feed from WSP’s CAD at two-minute intervals,
which provides chronological information to the WSDOT TOC Operator.
§ To enable this information to be included in its CARS database, and to account for the gaps in information coming from WSP CAD vs. what WSDOT needs to support its traffic and traveler information operations, WSDOT needed to initiate several modifications within CARS:
o Converts WSP CAD location codes to lat/long
o Coordinated with CARS vendor to develop a new screen in the CARS application to show CAD data coming in
o WSDOT Operators need to assign a default close time, which are typically based on incident type.
§ WSDOT operators monitor the updated CAD information and make the appropriate changes and updates within CARS so that incident information is updated on the phone and web traveler information systems.
There are no restrictions or limitations on data coming in from the WSP CAD; WSP pre-filters information that is sent to WSDOT and it only includes traffic/highway incident related data. A Joint Operations Policy (JOP) Agreement is in place between WSP and WSDOT, and is updated annually. This agreement covers a range of operational and response procedures and responsibilities for these agencies for highway operations, and includes a section on data sharing between the WSP CAD and WSDOT CARS. The March 2006 version of the JOP can be viewed at
http://www.wsdot.wa.gov/incidentresponse/JOPS.pdf.
Utah CAD Integration Field Operational Test
Utah, the other CAD/DOT operational test, uses a very different model and level of integration between the transportation and public safety systems. UDOT’s Commuterlink interfaces with five external agency CAD systems using a two-way data feed and peer-to-peer relationship rather than a centralized architecture concept. These include:
§ Utah Department of Public Safety § Salt Lake City Police
§ Salt Lake City Fire
§ Valley Emergency Communications Center (VEC, the metro area’s 911. UDOT plans to connect to all 30 911 dispatch centers in the state)
§ Utah Transit Authority
Connecting to these agencies required that separate interfaces be developed with the individual CAD systems. With the range of CAD systems interfacing to Commuterlink, there are obvious challenges in that the agency messages are structured differently, and include different levels of information. It required close coordination with not only the partner agencies, but also the individual CAD vendors to develop the interfaces to Commuterlink.
In the Utah case, the first CAD interface was established with DPS; these two state agencies have a close working relationship (they are collocated in the Salt Lake City TMC, and DPS has responsibility for after-hours dispatch and system monitoring of the UDOT systems), and highway incident data was a top priority for this endeavor.
Following this initial integration phase, UDOT coordinated with the other public safety dispatch agencies, and their respective CAD vendors, to be able to obtain an even broader range of incident data, particularly arterial incident information. To effectively
accomplish this, it required that agreements be developed for agencies to develop their own 1512 compatible interface with Commuterlink. As an additional point on the
agreements, because VEC 911 dispatches for 30+ agencies, and as such, needed buy-in from each of these agencies before being able to provide 911 data to UDOT.
Once data is transmitted via the UDOT fiber network through the CAD/UDOT interface, operators at the UDOT TOC are alerted there is incident information waiting, and they can accept, append, add to or delete before the information gets distributed via the www.utahcommuterlink.com web and 511 phone system. Once the information is in the Commuterlink system, operators manage the information process (monitor for updates, expand information, etc.) like any other event. Initially, there were no filters on
information coming in to UDOT on the CAD feeds, but UDOT recently revised their system to enable filtering rules for data from DPS, and are currently working on a filtering mechanism with VEC 911.
Oregon CAD Integration and Usage
Oregon DOT has a different model altogether – they are authorized users of the Oregon State Police CAD, and presently use the CAD to input and track incidents. Operators at ODOT Traffic Operations Centers input data into CAD, HTCRS (ODOT’s reporting system), as well as a third operational system. Not only is this a multi-step process for data entry, but the OSP CAD system is not ideal for tracking transportation information. As an authorized user with access to the OSP CAD, TOC operators are required to have the same screening and training as an OSP dispatcher (presently, there are about 40 of the 200 ODOT users that have appropriate authorization to access the OSP CAD). TOC operators can see incidents as they are entered by OSP operators, but then must enter that information into HTCRS for it to be included in ODOT’s TripCheck.com and 511
traveler information systems.
ODOT is developing a new statewide reporting system, which will include an interface to OSP CAD, thus reducing the multiple steps for data entry and providing a much more transportation-focused incident tracking system for the ODOT TOC operators. With the new system and interface between OSP and ODOT, there will also be two-way
information sharing capability.
Arizona CAD Integration with State and Local Public Safety
In January 2006, Arizona implemented an interface between its Phoenix Traffic
Operations Center and Arizona Department of Public Safety to allow TOC operators to view DPS CAD data using a one-way data feed that provides view-only privileges on a dedicated terminal. Operators at the TOC can view statewide CAD data, and then enter information into HCRS (Arizona’s statewide reporting system). Information is pre-filtered by DPS before being transmitted to the ADOT TOC. There is an agreement in place between ADOT and the Arizona DPS, but because ADOT gets filtered data from DPS, there are no restrictions on what information can be put in to the HCRS reporting system.
ADOT has also recently implemented a CAD interface with Phoenix Fire, which dispatches for 18 agencies in the greater Phoenix metro area. This provides a wealth of arterial incident information that might not otherwise have been captured. ADOT estimates that there was approximately a 2% capture rate for arterial incident data, and this interface with Phoenix Fire will fill in a substantial portion of that gap. Unlike the