D
rinking water supply and
sanitation services on the
threshold of the XXI century
Andrei Jouravlev
6(5,(
recursos naturales e infraestructura
74
the Division of Natural Resources and Infrastructure of the Economic Commission for Latin America and the Caribbean (ECLAC).
The views expressed in this document, which has been reproduced without formal editing, are those of the author and do not necessarily reflect the views of the Organization.
United Nations publication ISSN printed version 1680-9017 ISSN electronic version 1680-9025 ISBN: 92-1-121531-5
LC/L.2169-P
Sales No. E.04.II.G.98
Copyright © United Nations, December 2004. All rights reserved Printed in United Nations, Santiago, Chile
Applications for the right to reproduce this work are welcomed and should be sent to the Secretary of the Publication Board, United Nations Headquarters, New York, N.Y. 10017, United States. Member States and their governmental institutions may reproduce this work without prior authorization, but are requested to mention the source and inform the United Nations of such reproduction.
Index
Abstract... 5
Introduction... 7
I. Current situation of drinking water and sanitation services... 11
A. Drinking water supply and sanitation services... 11
1. Evolution of service coverage... 11
2. Current level of service coverage... 12
3. Quality of services ... 14
4. The Millennium Development Goals... 16
B. Wastewater treatment... 18
C. Socio-economic impacts of the shortfall in coverage ... 18
II. The results of the reforms in the drinking water supply and sanitation sector... 25
A. Reforms to the institutional structure of the sector ... 28
B. Reform of the sector’s industrial structure... 31
1. Reform of the sector’s vertical structure... 31
2. Reform of the sector’s horizontal structure ... 32
C. Private sector participation... 35
D. Regulatory frameworks ... 41
E. Pricing policies and subsidy systems ... 50
1. Pricing policies... 50
2. Subsidy systems ... 51
Conclusions... 53
Bibliography... 55
Serie Recursos Naturales e Infraestructura: issues published... 61
List of Tables
Table 1 Drinking water supply and sanitation coverage by region, around 2000 ... 8 Table 2 Latin America and the Caribbean: coverage of drinking water supply and
sanitation services, 1960-2000 ... 12 Table 3 Latin America and the Caribbean: access to drinking water services,
around 2000 ... 13 Table 4 Latin America and the Caribbean: access to sanitation services, around 2000... 15 Table 5 Latin America and the Caribbean: investment needs to achieve the
Millennium Development Goals ... 18 Table 6 Latin America and the Caribbean: sewerage effluents with some degree of
treatment, around 2000 ... 19 Table 7 Latin America and the Caribbean: costs and benefits of expanding coverage
of drinking water and sanitation services by 2015 ... 20 Table 8 Latin America and the Caribbean: investment in drinking water supply and
sanitation projects with private participation, 1991-2002... 37 Table 9 Latin America and the Caribbean: concession renegotiations and characteristics
of the regulatory frameworks ... 46
List of Figures
Figure 1 Main forms of human exposure to pollution caused by wastewater discharges ... 20 Figure 2 Latin America and the Caribbean: investment in drinking water and sanitation
projects with private participation, 1991-2002... 38 Figure 3 Latin America and the Caribbean: investment in drinking water and sanitation
projects with private participation, by country, 1991-2002 ... 40
List of Boxes
Box 1 The cholera epidemic of 1991 ... 17 Box 2 Economic impacts of pollution of the Bogotá river, Colombia, caused by
untreated wastewater discharges ... 22 Box 3 Impact of the cholera epidemic on the foreign trade of Peru ... 23 Box 4 The conflict resolution system in the Chilean sanitation sector... 30 Box 5 The drinking water supply and sanitation services concession in the city of
Buenos Aires, Argentina ... 36 Box 6 Attempted privatization of the drinking water supply and sanitation services
in Cochabamba, Bolivia ... 39 Box 7 International foreign investment protection treaties... 42 Box 8 Regulation by model company in Chile ... 44 Box 9 Is competition for the market (“franchising”) a good substitute for
conventional regulation? ... 47 Box 10 Implementation of regulatory accounting in Chile... 48 Box 11 Rules on contracting works included in the trust fund of the Buenos Aires
concession, Argentina... 49 Box 12 The system of targeted subsidies in Chile ... 52
Abstract
The objective of this paper is to analyse the status of drinking water supply and sanitation services in the countries of Latin America and the Caribbean at the beginning of the twenty-first century. For this purpose, and for methodological reasons, the study is divided into two parts. The first section consists of an analysis of access to services and their quality. The coverage levels achieved in the region may be considered reasonable, with the possible exception of wastewater treatment, but there are still serious deficiencies in access to services, which disproportionately affect low-income groups and rural areas. The insufficient coverage and poor quality of the services not only have negative impacts on the health of the population but also affect the environment, the economy, foreign trade and the availability of water for various uses. The second section of the study contains an analysis of the reforms carried out in recent years by the countries of the region. Despite the inevitable differences in a region that includes very different countries, the reforms have shown many common features: institutional separation of the functions of sectoral policy-making, economic regulation and systems administration; extension and consolidation of the decentralization process in the provision of services; a general interest in promoting private participation; formulation of new regulatory frameworks; and the requirement, since the crisis of the 1980s, that services should move towards being self-financing, and when that occurs, that subsidy arrangements should be set up for low-income groups. Lastly, some conclusions are drawn.
Introduction
“There is very little that a government can do that will result in greater benefits than providing clean and healthy water to the population. With this action … the incidence of diseases … is reduced, bringing down global health costs … increasing overall productivity and contributing to political stabilization” (Oxman and Oxer, 2000). The governments of Latin American and Caribbean countries have recognized this fact, and have made great efforts to increase the coverage of drinking water supply and sanitation services. At the same time, despite the undeniable and significant progress made, the situation of these services continues to be a cause of serious concern in many countries. These issues may be analysed in relation to five basic parameters:
• Water extraction. In the region, drinking water supply
accounts for 20% (from 1% in Guyana to 68% in Trinidad and Tobago) of total water extractions (WRI, 2003). As this is a relatively low rate of use (crop irrigation accounts for 70% of all water extractions) and also considering the great abundance of water resources in the region, it is clear that the deficit in coverage of services is, with some isolated exceptions, mainly the result of lack of investment in infrastructure rather than a lack of water availability.
• Demographic growth and urbanization. Since the
mid-twentieth century, the region has experienced demographic growth at a rate unprecedented in its history: from 167 million inhabitants in 1950 to 519 million in 2000 (United Nations, 2002). According to United Nations projections, the
region’s population will reach 723 million inhabitants in 2030. This demographic growth has been accompanied by a significant urban concentration of the population (42% in 1950, 75% in 2000 and a projected 84% for 2030), and some urban areas in the region are already amongst the largest population concentrations in the world.
• Levels of coverage. Compared to other regions of the world, the coverage levels
achieved in the Latin American and Caribbean countries may generally be considered as reasonable, with the possible exception of wastewater treatment (see Table 1).
• Coverage deficit. According to the most recent Evaluation of Drinking Water and
Sanitation Services (“Evaluation 2000”), carried out under the coordination of the Pan American Health Organization (PAHO), some 77 million persons in the region lack access to drinking water services supply and approximately 103 million to sanitation services (PAHO, 2001a). The majority of those without access to services are poor and live in rural areas. Wastewaters from about 208 million persons are discharged into recipient water bodies without any treatment and cause severe pollution problems.
• Quality of services. In general, the quality and reliability of the services are mediocre
and the infrastructure is in poor condition.
Table 1
DRINKING WATER SUPPLY AND SANITATION COVERAGE BY REGION, AROUND 2000 (Percentage)
Drinking water supply Sanitation
Urban Rural Total Urban Rural Total
Urban wastewater
treatment
Africa 85 47 62 84 45 60 0
Latin America and the
Caribbean 93 62 85 87 49 78 14 North America 100 100 100 100 100 100 90 Asia 93 75 81 78 31 48 35 Europe 100 87 96 99 74 92 66 Oceania 98 63 88 99 81 93 a Source: WHO/UNICEF (2000). a Not available.
These problems, together with the reappearance of cholera in the region at the beginning of the 1990s, have led the governments of Latin American and Caribbean countries to give high priority to the drinking water supply and sanitation sector.1 As a result, over the past two decades, this sector has been subject to extensive reforms in the majority of the region’s countries: “Efforts have been made for more than fifteen years to promote … the establishment of a new institutional
1 As a result, it is very common in government work and the public debate, and also in international conferences, that discussions on
water issues give almost exclusive emphasis to drinking water supply and sanitation services, thus separating this sectoral concern from the more general need to improve the capacity for managing water as a natural resource (Dourojeanni and Jouravlev, 2002; Jouravlev, 2002). The expansion of coverage of services means that the use of water will increase, a resource for which there is already intense competition in many river basins, especially for irrigated crops. The same will happen with wastewater discharges, which are one of the main sources of water pollution, which has already reached critical proportions, especially in waters downstream of large urban areas. Good water management systems are thus an essential prerequisite for making progress in resolving the problems of drinking water supply and sanitation. This implies, inter alia: (i) modern water legislation, which responds adequately to the nature of the problems facing the use of the resource and that is in harmony with the concepts and practices of society; (ii) a water authority that is independent of sectoral uses, and with powers and resources in accordance with its responsibilities; (iii) an effective conflict resolution system; (iv) a water allocation system that promotes investment in the development and conservation of the resource, and at the same time ensures its efficient and orderly use, avoids monopolies and facilitates its control in the public interest; and (v) a water pollution control system that is capable of mobilizing economic resources to finance the large-scale investments that are needed in wastewater treatment systems (Peña and Solanes, 2002).
arrangement for the provision of public services through networks designed to introduce the market dynamic as an ordering element in the sector, redefining the working areas and practices in both the public and private sectors. This transformation has affected the sectoral agenda in almost all of the countries of Latin America and the Caribbean and has brought a broad process of change in the model of provision of drinking water supply and sanitation services” (Corrales, 2003).
Despite some differences, there are many common trends in the reforms carried out, or underway, in the countries of the region:
• Modification of the institutional structure of the drinking water supply and sanitation sector in many countries, while in others this process is underway. The reforms invariably include institutional separation of the functions of sectoral policy-making, economic regulation and systems administration.
• Modifications to the industrial structure of the sector, with the emphasis on decentralization of services provision, in many cases to the local level.
• In many countries policies have been adopted to ensure non-political management of services by autonomous public agencies or local governments, in accordance with technical and commercial criteria. There is also a general interest in promoting private sector participation.
• A desire to formulate new regulatory frameworks for the sector both to facilitate private participation and to bring about a significant improvement in the efficiency of public provision of services.
• The changes in the institutional and industrial structure of the sector have gone hand in hand with a requirement for services to be self-financing. Interest has also been shown in establishing sophisticated subsidy systems for low-income social groups.
In general terms, it may be said that the reforms relating to modification of the institutional and industrial structure of the sector, the formulation of new legal and regulatory frameworks, the setting up of the designated institutions and, in some cases, the transfer of services to the private sector, have made relatively rapid progress. There are still significant lags, however, in reforms associated with tariff readjustments to levels that guarantee the self-financing of services, the creation of effective subsidy systems, implementation of the regulatory frameworks and modification of the behaviour of public service providers. As a result of these gaps, and also the macroeconomic instability and structural deficit of public finances, the reforms have not achieved the expected degree of success. “Despite the efforts made, the region still shows a high level of exclusion from services, and even more worrying is the fact that the rate of overcoming coverage problems has diminished while the numbers of the socially excluded have been growing in many countries” (Corrales, 2003).
I. Current situation of drinking
water and sanitation services
A. Drinking water supply and sanitation
services
1.
Evolution of service coverage
Since the approval of the Charter of Punta del Este in 1961,2 the governments of Latin American and Caribbean countries have made significant efforts to extend the coverage of their drinking water supply and sanitation services. Table 2 shows the continuous growth of the population served and the increase in the percentage with access to services in the countries of the region. An analysis of this information leads to the following general conclusions:
• The most significant progress in the expansion of drinking water supply and sanitation services was made in the 1980s, which were also the “International Drinking Water Supply
and Sanitation Decade” (1981-1990), as proclaimed by the
General Assembly of the United Nations in November 1980.
2 In accordance with the provisions of the Charter of Punta del Este, which was signed in the context of the Inter-American Economic
and Social Council of the Organization of American States (OAS), in 1961 the governments of the region took on the commitment of achieving a substantial improvement in the expansion of drinking water supply and sanitation services. The specific commitment was to provide adequate drinking water supply and sewerage to not less than 70 percent of the urban and 50 percent of the rural population by the end of the decade (PAHO, 2002).
• There was also a very significant increase in the number of persons with access to drinking water supply services during the 1960s and 1970s.
• In the 1980s and 1990s there was a significant rise in the number of persons connected to sewerage systems.
• In the 1990s, there was a substantial increase in the number of persons served by in situ sanitation systems, such as latrines and septic tanks.
Table 2
LATIN AMERICA AND THE CARIBBEAN: COVERAGE OF DRINKING WATER SUPPLY AND SANITATION SERVICES, 1960-2000
Drinking water supply (household connections
and easy access)
Sewerage Latrines and septic tanks Year (millions of inhabitants) (%) (millions of inhabitants) (%) (millions of inhabitants) (%) 1960 69 33 29 14 a A 1971 152 53 59 21 a A 1980 236 70 95 28 105 31 1990 341 80 168 39 116 27 2000 420 85 241 49 152 31
Source: PAHO (2001a).
a
Not available.
2.
Current level of service coverage
2.1 Drinking water supply
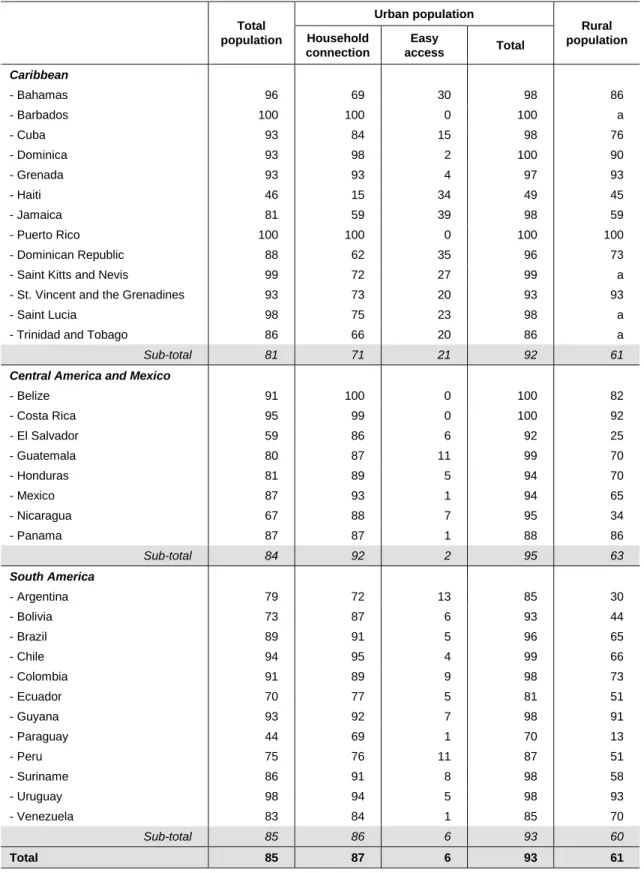
According to the estimates of the PAHO, approximately 85% of the region’s population has access to drinking water supply services, either through household connections or through easy access to a public source (PAHO, 2001a). Some countries have coverage levels higher than 95% (Bahamas, Barbados, Costa Rica, Puerto Rico, Saint Kitts and Nevis, Santa Lucia and Uruguay), while levels of less than 70% are recorded in El Salvador, Haiti, Nicaragua and Paraguay (see Table 3).
The current levels of coverage mean that almost 77 million people (15%) do not have access to drinking water supply services, of which 26 million (7%) are in urban areas and 51 million (39%) in rural areas (PAHO, 2001a). Moreover, almost 54 million persons (11%) are supplied by systems defined as “easy access” which are in most cases a significant health risk.
The part of the population which does not have access to drinking water supply services is obliged to adopt alternative solutions (such as public sources, individual wells, illegal connections to the drinking water network, rainwater collection or taking water from rivers, lakes, water springs and other bodies of water without prior treatment). Many of these options offer no guarantee of the quality of water obtained, as increasing levels of water pollution are affecting many bodies of water in the countries of the region.
2.2 Sanitation
With regard to sanitation services, only 49% of the regional population is connected to conventional sewerage systems, and the another 31% use “in situ” sanitation systems (PAHO, 2001a). The levels of coverage for sewerage are considerably less than for those for drinking water supply through household connections. Only in Chile, Colombia, Guatemala and Mexico, does the urban population connected to sewerage systems exceed 70%, while in Paraguay, Suriname and
Table 3
LATIN AMERICA AND THE CARIBBEAN: ACCESS TO DRINKING WATER SERVICES, AROUND 2000
(Percentage) Urban population Total population Household connection Easy access Total Rural population Caribbean - Bahamas 96 69 30 98 86 - Barbados 100 100 0 100 a - Cuba 93 84 15 98 76 - Dominica 93 98 2 100 90 - Grenada 93 93 4 97 93 - Haiti 46 15 34 49 45 - Jamaica 81 59 39 98 59 - Puerto Rico 100 100 0 100 100 - Dominican Republic 88 62 35 96 73
- Saint Kitts and Nevis 99 72 27 99 a
- St. Vincent and the Grenadines 93 73 20 93 93
- Saint Lucia 98 75 23 98 a
- Trinidad and Tobago 86 66 20 86 a
Sub-total 81 71 21 92 61
Central America and Mexico
- Belize 91 100 0 100 82 - Costa Rica 95 99 0 100 92 - El Salvador 59 86 6 92 25 - Guatemala 80 87 11 99 70 - Honduras 81 89 5 94 70 - Mexico 87 93 1 94 65 - Nicaragua 67 88 7 95 34 - Panama 87 87 1 88 86 Sub-total 84 92 2 95 63 South America - Argentina 79 72 13 85 30 - Bolivia 73 87 6 93 44 - Brazil 89 91 5 96 65 - Chile 94 95 4 99 66 - Colombia 91 89 9 98 73 - Ecuador 70 77 5 81 51 - Guyana 93 92 7 98 91 - Paraguay 44 69 1 70 13 - Peru 75 76 11 87 51 - Suriname 86 91 8 98 58 - Uruguay 98 94 5 98 93 - Venezuela 83 84 1 85 70 Sub-total 85 86 6 93 60 Total 85 87 6 93 61
Source: PAHO (2001a).
various Caribbean islands, the coverage is less than 20% (see Table 4). In rural areas, in most of the countries (with the exception of Colombia, Ecuador, Guatemala, Jamaica, Mexico, Peru and Venezuela), sewerage is virtually unknown.
These levels of coverage mean that about 103 million persons (21%) do not have access to wastewater and excreta disposal services, including 37 million (10%) in urban areas and 66 million (50%) in rural areas (PAHO, 2001a). This is even more serious in view of the mass use of “in situ” systems, which may be considered appropriate in rural areas, where 41% of the population depend on them, but are not technologically appropriate in urban areas, where 27% of the population use them. In some cities they cause problems of ground water pollution (for example, in Buenos Aires, Argentina).3
2.3 Low-income groups
The majority of persons without access to drinking water supply and sanitation services belong to low-income groups. Many of them are concentrated in peri-urban areas, mainly in the poverty belts that exist on the periphery of many of the cities in the region. It has proved very difficult to provide these marginal areas with services of acceptable quality. The main problems encountered in efforts to expand services to marginal populations have been due, on the one hand, to the high poverty levels and the low level of payment capacity and culture, and on the other hand, to high construction and operation costs. These populations have very often experienced explosive growth and have developed in a disorganized manner, settling in areas far from existing networks and with more difficult topographical conditions.
This situation has meant that low-income groups, in many cases, must purchase water from private vendors at prices that far exceed (up to 100 times in some cases; Bosch and others, 1999) those of official companies. Those companies —owing in part to insufficient income— cannot extend their services to the areas where poor people live. Many of the options (such as water trucks) which the poor are obliged to use have a very high cost, and they end up spending a higher proportion of their income on water than persons in a better economic situation. They also incur a high health risk, as there is no guarantee of the quality of the water provided.
2.4 Rural areas
In the countries of the region, the levels of coverage of drinking water supply and sanitation services are significantly higher in urban areas than in rural areas. Moreover, the technical solutions which are used in rural areas (such as wells, septic tanks and latrines) frequently do not ensure a level of service quality or functionality that is comparable with those available in cities (mainly household connections).
3.
Quality of services
In many countries of the region, drinking water supply services are intermittent, even in extensive areas of the main cities. It is estimated that over 219 million persons, constituting 60% of the population served through household drinking water supply connections, are served by systems that operate on an intermittent basis (PAHO, 2001a). In some countries, over 95% of the supply systems have problems of intermittency (PAHO, 2001b).
Owing to inadequate maintenance and poor commercial management, there are high levels of water losses in the drinking water supply systems of almost all the countries in the region, which endanger the integrity of the distribution networks, the quality of the drinking water and the
3
In the last three decades, over 500 wells providing drinking water to the population in the Federal Capital and the urban area of Buenos Aires had to be taken out of service because of quality problems caused by irrational use of the aquifer (high nitrate content, salinisation and industrial pollution) (Calcagno, Gaviño and Mendiburo, 2000).
Table 4
LATIN AMERICA AND THE CARIBBEAN: ACCESS TO SANITATION SERVICES, AROUND 2000
(Percentage)
Urban population Total
population Household
connection In situ Total
Rural population Caribbean - Bahamas 100 16 84 100 100 - Barbados 99 2 97 99 a - Cuba 94 48 49 97 84 - Dominica 78 28 58 86 75 - Grenada 97 18 78 96 97 - Haiti 26 0 46 46 16 - Jamaica 90 30 60 90 91 - Puerto Rico 100 60 40 100 100 - Dominican Republic 90 31 64 96 79
- Saint Kitts and Nevis 96 0 96 96 a
- St. Vincent and the Grenadines 96 3 93 96 96
- Saint Lucia 89 7 83 89 a
- Trinidad and Tobago 100 19 80 100 a
Sub-total 79 37 54 91 56
Central America and Mexico
- Belize 48 39 32 71 25 - Costa Rica 94 47 41 89 97 - El Salvador 68 64 22 86 50 - Guatemala 79 93 2 95 71 - Honduras 70 55 39 94 50 - Mexico 72 75 12 87 32 - Nicaragua 76 32 61 93 56 - Panama 93 64 35 99 87 Sub-total 74 72 15 88 46 South America - Argentina 84 55 34 89 48 - Bolivia 63 45 37 82 35 - Brazil 85 59 35 94 53 - Chile 93 90 4 93 94 - Colombia 83 79 18 97 51 - Ecuador 58 61 9 70 37 - Guyana 85 33 64 97 81 - Paraguay 67 13 72 85 47 - Peru 74 67 23 90 40 - Suriname 86 0 99 99 56 - Uruguay 94 51 45 95 85 - Venezuela 69 62 9 71 48 Sub-total 81 62 28 90 50 Total 79 63 27 90 50
Source: PAHO (2001a).
financial sustainability of the sector. In the large cities in the region, the amount of the initial delivery of water to the distribution network that is not accounted for as billed to users is estimated at 42%, or even higher (for example, between 40% and 75% in Venezuela) (WHO/UNICEF, 2000; González, 2000). In many cases, the high levels of unaccounted for water are the result of poor commercial management, and are not exclusively due to the high percentage of losses caused by physical leaks in distribution systems.
The proportion of the population covered by adequate systems of monitoring and control of drinking water quality is very low in urban areas and insignificant in rural areas: only 24% of the urban population in the region is covered by effective systems for monitoring drinking water quality (PAHO, 2001b). It is estimated that 94% of drinking water in the large cities of the region is effectively disinfected, but almost 18% of the samples violate national standards for microbiological, chemical, physical and organoleptic properties (WHO/UNICEF, 2000). As a result of the cholera epidemic in 1991 (see Box 1),4 the monitoring of drinking water quality and its disinfection has increased in most countries, and efforts are being made to achieve 100% disinfection in the region (PAHO, 2001a).
4.
The Millennium Development Goals
At the Millennium Summit of the United Nations (September 2000), it was agreed to halve by 2015 the proportion of people without access to safe drinking water. At the World Summit on Sustainable Development (26 August to 4 September 2002) this commitment was reaffirmed, and an additional goal was added to the latter: to halve, by the same year, the proportion of people without access to basic sanitation.
According to the preliminary estimates of the Inter-American Development Bank (IADB) (2003), in order to comply with the goal of halving the proportion of people without drinking water supply services, access would have to be provided to over 121 million persons. This would require investments for a total of 16.5 billion dollars, or 1.1 billion per year between 2000 and 2015.5 Of this amount, 93% is investments in the urban sector and 7% in the rural sector.
As for sanitation services, access would need to be provided for almost 140 million persons in order to achieve the Millennium Goals (IADB, 2003). This would require a total investment of 22.0 billion dollars between 2000 and 2015, or 1.5 billion per year. Of this investment, 95% would be destined to providing improved sanitation services to the urban population and the remaining 5% to the rural population.
A comparison of these estimates with the investments made by the countries of the region in the 1990s (see Table 5) suggests that achieving the Millennium Development Goals should not be an insuperable challenge for the region. There are, however, significant disparities between countries within the region.
In terms of investment needs as a percentage of the gross domestic product (GDP), the countries which will have to make the greatest efforts to achieve the Millennium Development Goals are Nicaragua, Haiti, Paraguay, Honduras, Santa Lucia, Bolivia, Guatemala, Guyana, Ecuador, the Dominican Republic, El Salvador and Colombia. It seems that some of them will not
4
The onset and spread of the cholera epidemic of 1991 are closely related to the deterioration in drinking water supply, sanitation and health services brought by the economic crisis of the 1980s (Brandling-Bennett, Libel and Migliónico, 1994). The epidemic caused serious losses in tourism, agriculture, fishing and the external trade of countries in the region (see page 23).
5 It should be noted that these estimates refer only to net investment, that is, they refer only to the construction of new systems and
expansion of existing ones in order to expand coverage to the levels set out in the Millennium Development Goals. Consequently, the investments needed to comply with the specified targets are underestimated, as they ignore the investments needed to repair, rehabilitate and maintain in good condition the existing infrastructure, so that those persons who currently have access to services do not lose them or experience a serious deterioration in their quality.
be able to achieve the goals, even if conditions became more favourable. An additional difficulty is the fact that a large proportion of the investment needs are required to expand coverage of the services to the poorest segments of the population. This means that many of the new investments would have to be financed by low-income groups, or, if that is not possible, by governments, which gives an idea of the level of subsidies required.
Box 1
THE CHOLERA EPIDEMIC OF 1991
Source: Brandling-Bennett, Libel and Migliónico (1994).
Cholera is a diarrhoeic illness caused by a toxigenic bacterium of the Vibrio cholerae species. In its fullest form, it appears as profuse and acute diarrhoea which causes dehydration, shock and even death. The Americas were afflicted by cholera for a large part of the nineteenth century. With the construction of drinking water supply and sanitation systems in large cities, however, cholera disappeared from the continent at the end of the nineteenth century and the hemisphere was free from cholera epidemics for the first 90 years of the twentieth century.
In Peru in January 1991, Vibrio cholerae set off one of the greatest epidemics ever recorded, with a total of almost 323,000 cases and 2,900 deaths by the end of the year. All departments were affected and it is estimated that at least 1.5% of the Peruvian population was infected. Subsequently, various other countries (Bolivia, Brazil, Canada, Chile, Colombia, Ecuador, El Salvador, French Guyana, Guatemala, Honduras, Mexico, Nicaragua, Panama, the United States and Venezuela) were affected, with a total of 391,000 cases (70% of cases worldwide) and 4,000 dead at the end of the year.
Cholera is almost always introduced in new areas by infected travellers. It is rare that the infection appears because of commercial food products or coastal or river waters, although local food and waters may be infected in that way. In infected areas, the disease is transmitted between people through contaminated water and foods. Direct infection from person to person is probably very rare, although this may occur in close contacts within the home.
According to research carried out in urban areas of the Peruvian coast, the following are risk factors for contracting the disease: drinking unboiled water from municipal systems and surface wells; consuming foodstuffs and drinks purchased from itinerant vendors, especially drinks with ice; eating foodstuffs that have been more than three hours at room temperature without reheating them; and drinking water from a recipient in which other persons have placed their hands. In Ecuador it was also shown that the disease is linked to the consumption of raw fish or shellfish, as well as drinks purchased from itinerant vendors. In Chile, the disease appeared to be associated to the consumption of raw salads and vegetables grown in irrigated fields outside Santiago. At that time, the irrigation water was highly contaminated by wastewaters produced in Santiago and discharged into the surrounding rivers.
The studies carried out in Peru showed that many municipal drinking water supply systems had high indices of coliform faecal bacteria, owing to pollution and insufficient chlorination of the water. Vibrio cholerae was detected in at least three drinking water supply systems, and in river and coastal waters at various places in Peru. Epidemic strains of Vibrio cholerae were also found in rivers in Chile, Mexico, Guatemala and El Salvador.
Some countries were at first reluctant to report the cases detected, for fear of adverse effects on tourism and exports (see page 23). Indeed, despite the fact that tourists usually run a low risk of contracting cholera and the disease is rarely transmitted through foods exported commercially, the loss of income from tourism and the restrictions imposed on food products resulted in substantial economic losses for the infected countries. At the onset of the epidemic, there were some instances of unjustified rejection of imports from the infected countries, but they subsequently diminished. At the very least, commercial firms had to invest large sums to be sure that their exports were free from Vibrio cholerae.
Cholera can only be eliminated from the region by means of substantial investments to improve drinking water supply, sanitation and health services, and by extending them to the large proportion of the population that still has no access to them.
Table 5
LATIN AMERICA AND THE CARIBBEAN: INVESTMENT NEEDS TO ACHIEVE THE MILLENNIUM DEVELOPMENT GOALS
(Billions of dollars per year)
Drinking water supply Sanitation Urban population Rural population Urban population Rural population Investments made (1990-2000) 1,9 0,5 1,4 0,1
Investments needed to achieve the Millennium Development Goals (2000-2015)
1,0 0,1 1,4 0,1
Source: IADB (2003).
B. Wastewater
treatment
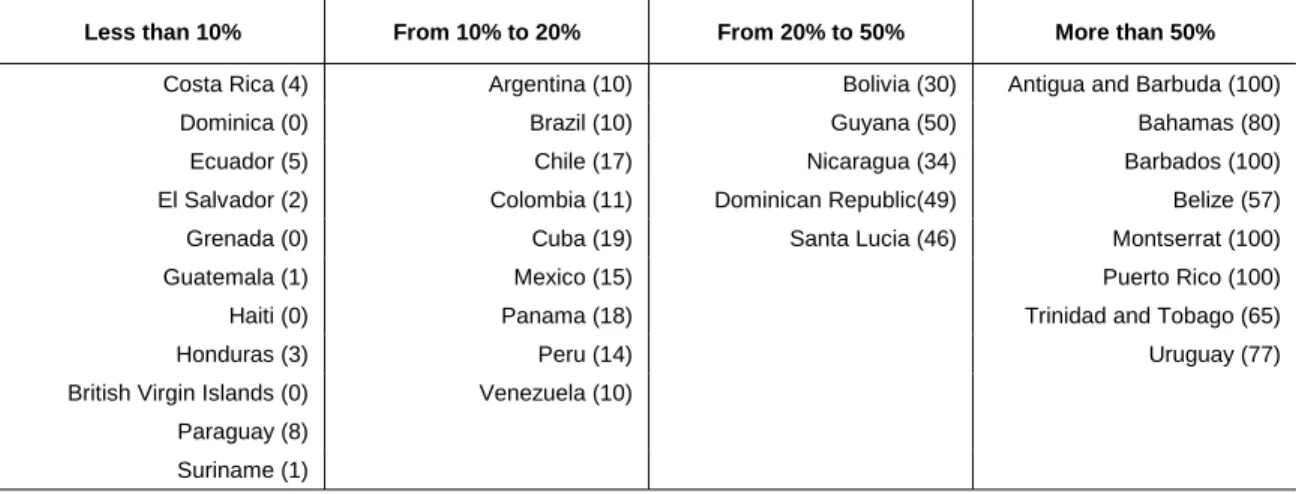
There is very little information available on wastewater treatment systems in the countries of the region. In 1962, it was estimated that in the countries most advanced in this area, only 10% of sewerage systems had wastewater treatment facilities (PAHO, 1990). Since then, except for a few isolated cases, including the water decontamination plan of Chile, which is notable for its scale and progress (see page 21), the situation has in general not changed significantly in regional terms. This is mainly due to the high costs of wastewater treatment facilities and the chronic lack of financing in the sector. Other countries which have made progress in expanding their wastewater treatment systems include Argentina, Brazil, Colombia, Mexico and Venezuela.
It is estimated that at present only 13.7% of wastewaters from the 241 million inhabitants whose homes are connected to sewerage networks, receive some degree of treatment (see Table 6). Assuming that each urban inhabitant with a household connection for drinking water and sewerage generates on average 200 litres of wastewater per day, 229.6 million persons would produce about 530 cubic metres per second, of which only 70 would receive some degree of treatment.6 The urban inhabitants who have household connections for drinking water but not for sewerage (87.0 million), at a rate of 50 litres of wastewaters per person per day, would produce another 40 cubic metres per second of wastewaters. These estimates suggest that the urban areas of countries in the region generate approximately 510 cubic metres per second of wastewaters which are discharged into the environment without prior treatment. The situation becomes even more worrying in view of the fact that a large number of treatment plants have been abandoned or function precariously (PAHO, 2001a). As a result of this, many bodies of water close to urban areas are little more than open sewers and watercourses crossing large cities are frequently anaerobic owing to the heavy load of sewage. If it were possible to offer universal access to drinking water supply and sewerage services to the urban population (for example, by 2010 or 2015), the current levels of discharge of wastewaters would be doubled —both because of the increase in coverage and the increase in the urban population.
C. Socio-economic impacts of the shortfall in coverage
In all of the countries of the region, drinking water supply and sanitation services are consumed almost exclusively by household users and by commerce. All irrigation agriculture, all of mining and a high proportion of industries, with the exception of the smallest ones located in urban centres, usually have their own water supplies (that is, they extract it from natural sources); even in
6
The estimates are based on PAHO (1990). These figures should be considered only as indicators of the order of magnitude of the demand for wastewater treatment.
areas covered by drinking water supply systems, many industries have abandoned the public service because:7
• They have access to alternative sources of water of acceptable quality (direct extraction of water from rivers, lakes and other surface sources or of groundwater), which in many cases are available free of charge or at a nominal cost and with little regulation.
• In many cases, industrial users required large volumes of water, but of a lower quality than water treated for human consumption.
• The quality of the service provided by many public drinking water supply systems in the region is poor, especially with regard to supply continuity and water quality.
• Many countries have a policy of subsidizing the consumption of low-income groups, or of all residential clients, by means of higher tariffs for industrial and commercial users (see page 51).
Table 6
LATIN AMERICA AND THE CARIBBEAN: SEWERAGE EFFLUENTS WITH SOME DEGREE OF TREATMENT, AROUND 2000
(Percentage)
Less than 10% From 10% to 20% From 20% to 50% More than 50%
Costa Rica (4) Argentina (10) Bolivia (30) Antigua and Barbuda (100)
Dominica (0) Brazil (10) Guyana (50) Bahamas (80)
Ecuador (5) Chile (17) Nicaragua (34) Barbados (100)
El Salvador (2) Colombia (11) Dominican Republic(49) Belize (57)
Grenada (0) Cuba (19) Santa Lucia (46) Montserrat (100)
Guatemala (1) Mexico (15) Puerto Rico (100)
Haiti (0) Panama (18) Trinidad and Tobago (65)
Honduras (3) Peru (14) Uruguay (77)
British Virgin Islands (0) Venezuela (10) Paraguay (8)
Suriname (1)
Source: PAHO (2001a).
As drinking water supply and sanitation services are consumed almost exclusively by household users, the most important effect of the coverage shortfall is on public health. It has long been recognized that proper access to efficient and safe drinking water supply and sanitation services considerably reduces morbidity and mortality caused by water-transmitted diseases (see Figure 1).
According to Lvovsky (2001), about 5.5% of the loss of disability-adjusted life years (DALY) in Latin America and the Caribbean is due to deficiencies in drinking water supply and sanitation services, compared to 1.0% in the industrialized countries and 7.0% in the developing countries. In the countries of the region, these deficiencies are the most significant risk factor of all those relating to the environment (air pollution, vector-borne diseases and agricultural and industrial pollution).8
7 For example, in Colombia, in the case of drinking water supply and sanitation services, “self-provision” is significantly higher than
in other public utility services. Nationwide, there are more than 65,000 industrial users in other public utility services, whereas in drinking water supply and sanitation there are less than 25,000 (Colombia/CONPES, 2003).
8
In Chile, the total health expenditure related to wastewater pollution in the Metropolitan Region is estimated at between US$ 41 million and US$ 53 million per year (Aguas Andinas, 2003).
C o n s u m p t i o n C o n s u m p t i o n → → → → → → ← ← ← ← ← ← Fish and shellfish ↓ ↓ Drinking water supply systems ↑ ↓ ↓ ↑ ↑ ↓ ↓ ↑ ↑ ↑ ↑ C o n t a c t C o n s u m p t i o n ↑ ↑ ↑ → → → → ← ← ← ← ← ↑ ↑ ↑ Population ↑ ↑ ↑ ↑ ↓ ↑ ↑ ↑ ↑ ↑ ↑ ↑ P a t h o g e n e x c r e t i o n D i r e c t c o n t a c t ↑ ↑ ↑ ↓ ↑ Agriculture (harvests, plants and soil) ↑ ↑ ↑ ↑ ↑ ↑ ↑ ↑ I r r i g a t i o n ↑ ↑ ↑ ↑ ↑ → → → → → ↑ ↑ ↑ ↑ Pollut i on ↑ Wastewater ↑ ↑ Pollut i on ↓ ↓ D i s c h a r g e ↓ ↓ D i s c h a r g e ← ← ← ← ← → → → → → Coastal and sea waters ← ← R u n - o f f ← ← Surface and ground water Figure 1
MAIN FORMS OF HUMAN EXPOSURE TO POLLUTION CAUSED BY WASTEWATER DISCHARGES
Source: adapted from Bosch and others (2000).
Hutton and Haller (2004) estimated the costs and benefits of expanding the coverage of drinking water supply and sanitation services (see Table 7). According to their analysis, the benefits of an expansion of coverage in the countries of the region vary between US$ 2.2 and 69.2 billion per year, depending on the scale of investment and the technological solutions adopted, with an estimated profitability of from 5 to 20 dollars for each dollar invested. These potential benefits represent the opportunity cost of not improving access to drinking water supply and sanitation services.
Table 7
LATIN AMERICA AND THE CARIBBEAN: COSTS AND BENEFITS OF EXPANDING COVERAGE OF DRINKING WATER AND SANITATION SERVICES BY 2015
(Billions of dollars per year)
T y p e o f i n t e r v e n t i o n Benefits Costs
Halve the proportion of people without access to drinking water supply
2.2 0.2 Halve the proportion of people without access to drinking water
supply and sanitation
9.6 0.8 Universal access to improved drinking water supply and sanitation 22.5 1.6
Universal access to improved drinking water supply and sanitation, plus water disinfection at the household level
38.1 1.9 Universal access to drinking water supply with a household
connection and sewerage with a household connection
69.2 14.1
Source: Hutton and Haller (2004).
The deficit in coverage of services has socio-economic impacts not only in terms of health, but also in terms of the availability of water for various uses associated with productive development. Perhaps the most important aspect is that the provision of sanitation services,
especially wastewater collection, treatment and disposal, affects the quality of the water resources available for other water users downstream in the same river basin. Apart from the obvious effects of water pollution (see Box 2), the main problems encountered are the following:
• Effects on irrigation crops. The reuse of domestic wastewaters for irrigation is a very
common practice on the periphery of cities located in arid and semi-arid zones of the region, where there is intense competition for water between agriculture and urban uses. In many cases, this practice has given good economic results —as the sewage contains nutrients which replace artificial fertilizers— and also does not involve significant risks for human health when appropriate production and treatment techniques are used.9 Nevertheless, as adequate hygiene and treatment standards are rarely respected, irrigation with raw wastewaters increases the risk factors for the health of the population, and results in endemic situations of diarrhoea, cholera, parasitism, typhoid fever, salmonellosis and other diseases. According to estimates, there are over 400,000 hectares in the countries of the region (2% of the irrigated surface), mainly in Mexico (350,000 hectares) and Peru (4,300 hectares),10 which are irrigated directly with wastewaters, in many cases without prior treatment (REPIDISCA, 1995). Yet this situation is only the tip of the iceberg. Many areas are irrigated with river waters which contain far in excess of the maximum permitted level of fecal coliforms recommended for the irrigation of vegetables for consumption in their raw state.11
• Effects on urban uses. In the region’s densely populated river basins, the wastewater
discharge areas of an urban centre are frequently located just a few kilometres upstream of other cities’ water intakes, so that there is insufficient time for the action of natural decomposition and dispersion processes. The obvious negative effects are the higher treatment costs for water for human consumption and for other uses sensitive to water quality, or, when such treatment is not carried out, damage to public health and other uses of the resource, or higher costs for supply from more distant sources. There are even cases of population centres which take water from such polluted sources that their inhabitants are at risk even when there is a conventional technology plant, as there is no guarantee that such polluted water can be brought to the appropriate standards (PAHO, 1992).
It is important to note that water pollution does not only affect public health, the environment and local economic activities, but also national competitiveness, mainly owing to the increasingly close relationship between external market access and the environment, and the increase in disputes relating to the use of environmental standards as non-tariff barriers in international trade. Perhaps the most dramatic example of the effects of deficient provision of drinking water supply and sanitation services on competitiveness, and especially on access to external markets (see Box 3), is the cholera epidemic of 1991 (see page 17). It is estimated that in Peru alone, the main country affected, the losses in fish product exports exceeded US$ 700 million (WHO, 1999).
The need to protect access to external markets was apparently one of the factors which motivated the Government of Chile to initiate an ambitious investment programme for wastewater
9
The main instances of reuse of treated residual water are in Peru (the bioecological complex of San Juan de Miraflores; systems at La Molina and Las Pampas de San Bartolo, close to Lima, for aquiculture and crop irrigation), Argentina (Campo Espejo, Palmira, Rivadavia and San Martín, in the Mendoza Province, for crop irrigation for 15,000 hectares; and Comodoro Rivadavia and Puerto Madryn in the Province of Chubut for forest irrigation) and Bolivia (in the area of Cochabamba) (GWP, 2000).
10
It is estimated that cleaning up of 100% of wastewaters from the Santiago basin in Chile would provide enough clean water for agricultural cultivation of more than 130,000 hectares (Aguas Andinas, 2003).
11
It is estimated that over 4,300 hectares on the Peruvian coast are irrigated with residual waters, 86% of which receive no treatment, and are used to grow vegetables which are consumed raw (Moscoso, 1993). Another 125,000 hectares receive river water with higher than acceptable levels of pollution.
• Impacts on land value: about US$ 61 million per year. This is the increased value of the land in connection with reduction of bad smells, improvement in the quality of groundwater and other effects connected with water pollution control. This increased value is for the potential for more extensive and profitable uses of the land.
• Impacts on agricultural production: about US$ 35 million per year. The use of contaminated water from the river and its tributaries for irrigation of pasture, vegetables and other similar crops has significant negative impacts on the quality of the food produced. If water of acceptable quality was available, the irrigation coverage could be extended, and the quality of the agricultural products would be improved in those areas which are currently irrigated with contaminated waters. • Impacts on the health of the population directly exposed: about US$ 4 million
per year. Persons living close to the river and to the lower part of its urban tributaries are exposed to water pollutants through a large variety of mechanisms: (i) consumption of untreated water; (ii) consumption of foods produced with contaminated irrigation water or from livestock farms that use such water; (iii) direct physical contact in recreational, bathing or work activities; and (iv) the wastewaters are an ideal breeding ground for flies and mosquitoes, which, when coming into contact with utensils and foodstuffs of persons who live or work in areas close to the river, contaminate them with pathogenic micro-organisms.
• Impacts on municipal public services: about US$ 9 million per year. Water from the Bogotá river is not fit for human consumption with conventional treatment, or for uses that involve direct contact with persons. Improvement of the river water quality could allow some communities to use the river as a water source for their water supply systems. The benefit would then be equivalent to the reduction of costs for obtaining water for the community supply system, and the reduction in rationing and in river water treatment costs incurred by some communities which have no alternative sources.
• Impacts on sedimentation of river and lake beds: approximately US$ 1 million per year. The discharge of residual waters from the city on the beds of the river Bogotá and of the Muña reservoir generates sedimentation, owing to the processes of sedimentation of the solids present in the waters and the slow processes of biological decomposition that take place. This increases the costs of dredging the river and the reservoir and also impedes the natural drainage of waters to the river, whenever the level of the bed has been raised by this gradual sedimentation, which has also created the need to construct dikes along the length of the river. The drainage difficulties increase the problems of public health of the population close to the river, as well as the costs of using the water.
• Impacts on fishing: less than US$ 1 million per year. One of the biotic components most greatly affected by river pollution is the icthyofauna. In the past, the course of the river Bogotá and its tributaries were rich in fish. With the increasing pollution, the fish have disappeared from the middle and lower courses of the river, and are now found only in the high and turbulent sectors, which are pollution-free, and in some reservoirs and lagoons.
The total annual value of pollution-related damage to the river Bogotá in the region directly affected can be estimated at close to US$ 110 million. It has not been possible to estimate, for lack of information or methodological problems, some of the damages caused by pollution, including: (i) health impacts on the population indirectly exposed; (ii) impacts on the operation and maintenance costs of the hydroelectric plants of the river Bogotá chain (higher costs for pumping wastewaters and for corrosion of electromechanical equipment); (iii) impacts on the benthic and avifauna biodiversity; and (iv) impacts on the landscape and odours in the vicinity of the river.
Box 2
ECONOMIC IMPACTS OF POLLUTION OF THE BOGOTÁ RIVER, COLOMBIA, CAUSED BY UNTREATED WASTEWATER DISCHARGES
Box 3
IMPACT OF THE CHOLERA EPIDEMIC ON THE FOREIGN TRADE OF PERU
Source: Petrera and Montoya (1993).
On 4 February 1991 the National Institute of Health (a decentralized entity of the Ministry of Health) isolated Vibrio cholerae, confirming the presence of a cholera epidemic along the central and northern coast of Peru. Since then there has been a significant level of fear at the international level, which has resulted in a number of prohibitions on the entry of persons and goods arriving from Peru. Initially, the prohibitions extended to virtually all products of marine and vegetable origin. Some countries even applied them to fish meal and conserves. Quality controls were required (to detect any bacteria present in accepted shipments), and also the fumigation of vessels and aircraft arriving from Peru.
The scale of these prohibitions has caused great alarm in the Peruvian export sector for two main reasons. First, they affect exports of fish products, which constitute 15% of Peruvian exports. Secondly, although vegetable and fruit exports were low in relation to total exports, they constituted a growth activity with good future potential. The loss in fruits was lower as the onset of the epidemic coincided with the end of the export season. The restrictions became more technical in subsequent weeks, which reduced the initial estimate of losses and led to reflection on the need to make technical changes based on the sanitary requirements of the importers.
The epidemic also led to substantial indirect costs in the export sector which included costs due to:
• sales agreements not fulfilled (lost shipments);
• the penalty of lower prices for Peruvian products on the international market; • higher export costs due to a longer storage period in foreign ports caused by delays
in acceptance by the purchasing countries;
• higher export costs because of more exigent quality controls to guarantee the absence of cholera;
• technical studies on cholera prevention and the dissemination efforts of exporters to guarantee safety and improve their image in the international community; and • the lower level of production caused in sectors economically connected with the
exporters, in view of losses incurred for the reasons described above.
In addition to the direct and indirect costs, the cholera epidemic brought about a process of restructuring in view of the more stringent sanitary requirements of the importers, the increase in exporters’ costs for hydrobiological products, vegetables and fruit, and also the temporary loss of income owing to lower international prices. Because of the epidemic, the European Economic Community required exporters of fresh and frozen Peruvian products to adapt to the sanitary and quality control standards of the European market.
This process of adaptation required investments in facilities, as well as significant technical and technological changes for the packaging and refrigeration processes, in an adverse situation of reduced demand. Taking into account this situation, it is expected that small-scale exporters will be unable to cover the higher export costs resulting from the epidemic, and this may have initiated a process of modernization in terms of centralization and concentration.
treatment. In the words of the former President of Chile during whose mandate the decision was taken: “if we continued irrigating with wastewaters we were going to have serious problems in placing our agribusiness and agricultural products [on external markets]” (Frei, undated). The investment requirements for wastewater treatment were estimated at about US$ 2 billion (Peña, Luraschi and Valenzuela, 2004). In order to accelerate this process, and to enable fiscal resources to be concentrated on social programmes, the government opted for financing these investments through private participation. All the companies of the sector have already been privatized (beginning with the Valparaíso Sanitary Works Company (ESVAL) in 1998, the Metropolitan Sanitary Works Company (EMOS) in 1999 (now known as Aguas Andinas), and subsequently various other companies, until the process was completed in 2004). As a result of investment in wastewater treatment plants, coverage grew from 8% in 1989 to 71% in 2003, and it is expected to reach 82% in 2005 and exceed 98% in 2010 (Chile/SISS, 2003). In Santiago, Chile, the tariff impact of investments in wastewater treatment plants is estimated as 25% (Gómez-Lobo, 2003).12
12
It is interesting that in Chile, many of the benefits of the water decontamination plan were suggested not only in terms of public health, quality of life and protection of the environment, but also in terms of positive effects on the economy. The investments in wastewater treatment are expected to lead to: clean irrigation water for thousands of hectares of irrigated land; social and economic savings, by improving the health of the population; promotion of the tourist industry, because of clean water bodies; reduced economic impact of the risk of lower exports levels due to a possible campaign or complaints in relation to wastewater irrigation; promotion of the qualities of pollution-free Chilean products in external markets; generating more employment associated with exports and the tourist industry; and ensuring the quality of the water bodies used as sources for drinking water supply (Chile/SISS, 2003).
II. The results of the reforms in the
drinking water supply and
sanitation sector
At the beginning of the 1980s, as a result of the efforts made in the 1960s and 1970s, most of the countries of the region were well provided with drinking water supply and sanitation services compared to other developing regions (ECLAC, 1990b). Prior to that time, the priority for services provision had been to achieve universal coverage, with little or no attention to economic efficiency and the financial sustainability of the providing entities: “in this century [the twentieth], this objective had a significant impact on the decisions and actions of many of the governments in this sphere, demonstrating social values that recognized the merit of extending coverage and gave priority to access rather than the financial and economic balance of the operating companies” (Corrales, 2000). The State was mainly responsible for the institutions of the sector at that time, both in direct administration of the service providers and in their financing. In many cases the management model was highly centralized.
The serious recession of the 1980s (“the lost decade”) came at a time when the countries of the region had drinking water supply and sanitation services that were highly dependent on contributions from government budgets, both for capital investments and, in many cases, for operational and maintenance costs. The negative macroeconomic environment had a strong negative impact on the allocation of resources for services provision, which was relegated to a secondary level, in view of the magnitude of the crisis and the pressures generated by the need to stabilize the economy (ECLAC, 1994).
When there was a strong economic recession in a country in the region, where typically the bulk of drinking water supply and sanitation services provision was the responsibility of the State, a whole range of economic adjustment instruments were applied (ECLAC, 1994). This was accompanied by a lag in the real value of rates charged for delivering public services. These lags in rates leaded to a drastic reduction in the operating capacity of the providing entities. As a result, in some cases it was not even possible to finance operating and maintenance costs.
When conditions had been relatively stable, the deficit financial periods of the drinking water supply and sanitation companies had been resolved to some extent by allocating State funds, either in the form of subsidies or as temporary financing to resolve immediate problems (ECLAC, 1994). In periods of growing adjustment needs, however, the governments reacted by limiting and reducing their expenditure as far as possible. This meant that the financial requirements of public companies were no longer met, and for lack of resources, they had to incur debts (thus contributing to the overall problem), postpone or suspend investments and neglect operating and maintenance activities. This, in turn, led to a process of growing unmet demand, a reduction in the quality of services, and an overall deterioration of existing infrastructure.
Meanwhile, salaries declined in the public sector, which to some extent caused an exodus of qualified personnel trained in the exercise of institutional, technical or business functions at the management level (ECLAC, 1994). Accordingly, the quality of human resources in administration of the sector also deteriorated. This loss of human resources and the general deterioration in the administrative context had a long-term effect, as a long period of time was subsequently needed in order to return to certain standards of management efficiency.
This syndrome of decay in the quantity and quality of drinking water supply and sanitation services led to a profound crisis in the sector (ECLAC, 1994). The sector had fallen to such a level of public discredit that in many countries there was a political and social consensus with regard to the need for profound and radical changes. As a result of this consensus, as well as the external influences of international financial agencies, significant reforms have recently taken place in the institutional framework of the drinking water supply and sanitation sector in most of the region’s countries.
Despite some differences in the content of the sectoral reforms and in the speed at which they took place, the current trends of public policies in the drinking water supply and sanitation sector in the countries of Latin America and the Caribbean are surprisingly uniform and, at the same time, mainly opposed to those followed in the past. The common trends or elements of the reforms carried out in the region include the following:
• Reform of the institutional structure of the sector, the corner stone being the institutional separation of functions of sectoral policy-making, economic regulation and systems administration.
• Reform of the industrial structure of the sector, where there has been an evident deepening and consolidation of the processes of decentralization in the provision of services.
• The general interest in promoting the participation of the private sector in the provision of services and, when this is not possible, in ensuring the non-politicized administration of services by autonomous public organizations or local governments, following more technical and commercial criteria.
• The formulation of new regulatory frameworks, both as a necessary condition for facilitating the participation of the private sector and as a way of improving the efficiency of the public provision of services.
• These reforms are accompanied by the requirement, born of the crisis of the 1980s, that services should aim to be self-financing and when that is the case, that subsidy systems should be created for low-income groups.
Reforms relating to changes in the institutional and industrial structure of the sector, to the approval of the new legal and regulatory frameworks, to the institutional establishment of the responsible entities and, in some cases (mainly Argentina and Chile), to the participation of the private sector, have generally made more rapid progress, while reforms relating to tariff adjustments towards levels that guarantee the economic and financial sustainability of services, the creation of effective subsidy systems, the implementation of regulatory frameworks and the modification of the behaviour of public service providers, have shown significant lags.
Despite the significant differences between the countries of the region, according to Corrales (2004), the reforms may be grouped into four very broad categories in terms of speed and depth:
• Advanced change. This group consists essentially of Argentina and Chile, where the
reform process has made the most progress, both in the construction, implementation and improvement of the new regulatory frameworks and in the self-financing of services and participation of the private sector. In the case of Argentina, there has been an accelerated process of privatization through a system of concessions (normally for 30 years) in the main jurisdictions of the country (City of Buenos Aires, the provinces of Buenos Aires, Catamarca, Córdoba, Corrientes, Formosa, Mendoza, Misiones, Salta, Santa Fe, Santiago del Estero, San Luis and Tucumán, although in some of them the privatizations later failed); regulation by contract rather than by a general law; and the creation of provincial-level regulatory bodies, together with, or subsequent to, the incorporation of the private sector, without prior consolidation of those organizations (Calcagno, Gaviño and Mendiburo, 2000). It is estimated that private operators provide services to more than 60% of the urban population of Argentina. In the case of Chile, the process was more gradual, and included the following successive stages: (i) approval and implementation of the new legal and regulatory framework, and creation of a national-level regulating body; (ii) gradual adjustment of tariffs to reach a level that is self-financing (over a transition period of up to four years) and the creation of a direct subsidy system for low-income groups; (iii) improvement of the legal and regulatory framework, and of the subsidy system; and only after all of this, (iv) the incorporation of private capital, mainly through the sale of shares, in all companies in the sector. Between 1998 and 2004, all State-owned companies were transferred to the private sector. In the case of both Argentina (until the devaluation of 2002)13 and Chile (see page 21), the sector attracted significant levels of private investment.
• Partial change, with emphasis on updating the regulatory frameworks. This group
includes countries (such as Bolivia, Colombia, Costa Rica, Nicaragua, Peru, Panama, Paraguay and Uruguay) which have approved new legal frameworks and created national-level regulatory bodies, although there are still significant problems in ensuring compliance with and operation of the approved regulatory frameworks. The processes of private participation have been rather scarce and essentially limited to a few experiences in Bolivia and Colombia, and isolated cases at the local level in Uruguay. In some of the countries in this group (mainly in Colombia, but also in Peru), the regulatory task has been made more difficult by the excessive fragmentation of the sector into service units with very different characteristics, as well as conflicts of competence with the local authorities (as in Peru).
13
For example, Aguas Argentinas, the Buenos Aires concessionaire, has made investments of US$ 1.7 billion, reinvesting 76% of profits and obtaining external financing of US$ 0.7 billion (Aguas Argentinas, 2003).
• Partial change, with emphasis on private participation. This group includes countries
such as Brazil, Ecuador and Honduras. Despite the fact that the new legal frameworks have not yet been approved, there are already some isolated instances of private participation, mainly in the form of regulation by contract at the local level. In many of these countries, the search for consensus regulatory solutions is hindered by the persistence of serious problems of competence between the different levels of Government (as in Brazil).
• Change incomplete or under discussion. In the rest of the region’s countries (such as
the Dominican Republic and Venezuela) the reforms have been slower and the process of reaching a national agreement has been difficult. The case of Venezuela is interesting as, despite having approved the Drinking Water and Sanitation Services Provision Organization Act on 31 December 2001, the law has not yet been fully implemented (Corrales, 2004). This group also includes many of the Caribbean countries, where the sector’s industrial structure is generally concentrated in a national commission, private participation is the exception rather than the rule, and apart from in a few cases (such as Jamaica, Bahamas and Trinidad and Tobago), no regulatory entities have been created (Avendaño, 2003).
A. Reforms to the institutional structure of the sector
In the majority of Latin American and Caribbean countries, the role of the State in the economy in general, and in the use of water and the provision of water-related public utility services in particular, has changed radically since the recession of the 1980s. The objective has been to reduce and reorient public expenditure in a context of fiscal austerity measures, particularly with regard to capital investments, and increase efficiency in the provision of public utility services. One of the main results of these reforms has been that, with the decade of the 1980s, the functions of the State have begun to shift from the direct water use, construction and operation of works and direct provision of public utility services, to the regulation, control and promotion of activities by third parties, whether autonomous public entities, local governments or the private sector (ECLAC, 1992).
As a result of these policies, many countries in the region have already reformed the institutional structure of the drinking water supply and sanitation sector, while in others this process has reached different degrees of development. The reforms invariably involve an explicit institutional separation between the following three functions, which are assigned to different organizations with the rights and obligations clearly defined: (i) definition of sectoral policies and strategic planning; (ii) economic regulation, supervision and monitoring of the service providers; and (iii) provision of services and systems administration.
This differentiation, which is the corner stone of the restructuring process in the sector and which is usually observed in all public utility services, represents a significant institutional advance. Experience in the region indicates that this division of functions is essential in those cases where services provision is to be privatized, but is also highly recommendable even when services provision is to remain in public hands (ECLAC, 2000).
The functions of sectoral policy-making and strategic planning are usually separated from the regulatory function and are left as the responsibility of the sectoral ministries (of public works, housing, infrastructure, health, etc.). The monitoring and economic regulation functions are institutionalized through regulatory commissions and bodies, which are usually assured technical and financial capacity, and independence. The function of service provision is transferred to
autonomous public agencies, local governments or the private sector, in order to ensure the non-political administration of the systems in accordance with technical and commercial criteria.
Most of the countries in the region, such as Argentina (at the provincial level), Bolivia, Brazil (only in some states), Chile, Colombia, Costa Rica, Jamaica, Nicaragua, Panama, Paraguay, Peru and Uruguay,14 have already created economic regulatory bodies for drinking water supply and sanitation services, while various others (such as Honduras and Venezuela) are in the process of doing so. In most of the countries the intention is to regulate each sector of the public utilities services separate