Creative Components Iowa State University Capstones, Theses and Dissertations
Summer 2019
Analyzing Customer Buying Behavior
Analyzing Customer Buying Behavior
Tanya Nayyar [email protected]
Follow this and additional works at: https://lib.dr.iastate.edu/creativecomponents Part of the Business Analytics Commons, and the Business Intelligence Commons Recommended Citation
Recommended Citation
Nayyar, Tanya, "Analyzing Customer Buying Behavior" (2019). Creative Components. 336. https://lib.dr.iastate.edu/creativecomponents/336
This Creative Component is brought to you for free and open access by the Iowa State University Capstones, Theses and Dissertations at Iowa State University Digital Repository. It has been accepted for inclusion in Creative Components by an authorized administrator of Iowa State University Digital Repository. For more information, please contact [email protected].
1
Analyzing Customer Buying Behavior
Creative Component Project Report
By:
Tanya Nayyar
Master of Science in Information Systems
Submitted in fulfillment for the requirements for the degree of
Master of Science in Information Systems
Major Professor:
Dr. Anthony Townsend
Ivy College of Business
Iowa State University
Ames, Iowa
2019
2
Table of Contents
Acknowledgement
... 6
Abstract
... 7
1.
Introduction
... 9
2.
Literature Review:
... 13
3.
Project Methodology:
... 16
3.1
Logistic Regression:
... 26
3.2
K-Nearest Neighbor:
... 29
3.3
Support Vector Machine:
... 31
3.4
Kernel Support Vector Machine (Support Vector
machine with a non-linear kernel):
... 33
3.5
Decision Tree:
... 36
3.6
Naïve Bayes:
... 39
3.7
Random Forest:
... 41
4.
Evaluation and Comparison:
... 44
5.
Discussion and Conclusion:
... 45
3
LIST OF FIGURES
Figure1: Weekly Trend of Tool Manufacturing Company’s Users this year……..18
Figure 2 Age distribution of Tool Manufacturing Company’s Customers……….18
Figure 3 Gender distribution of Tool Manufacturing Company’s Customers……19
Figure 4- Channels and customer distribution………...………..22
Figure 5- New versus Returning Customers………..………..23
Figure 6- Training set results (Logistic Regression)…………...………27
Figure 7- Test set results (Logistic Regression)……….……….28
Figure 8- Training set results (K-Nearest Neighbor)………...…29
Figure 9- Test set results (K-Nearest Neighbor)……….…30
Figure 10- Training set results (Support Vector Machine)………..32
Figure 11- Test set results (Support Vector Machine)………32
Figure 12- Training set results (Support Vector Machine (Non-linear kernel))….34 Figure 13- Test set results (Support Vector Machine (Non-linear kernel))……....35
Figure 14- Training set results (Decision Tree)……….…..37
Figure 15- Test set results (Decision Tree)………...38
4
Figure 17- Test set results (Naïve Bayes)………...40 Figure 18- Training set results (Random Forest)………...42 Figure 19- Test set results (Random Forest)………..………...43
5
LIST OF TABLES
Table 1: Top 4 channels directing customers……….……….19
Table 2: Top 5 referral sources directing Customers……..………20
Table 3: Top 5 social sources directing Customers……….………20
Table 4: Top 5 direct sources directing Customers………...………..21
Table 5: Top 5 organic search sources directing Customers………...21
Table 6: Confusion Matrix (Logistic Regression)………...28
Table 7: Confusion Matrix (K-Nearest Neighbor)………..31
Table 8: Confusion Matrix (Support Vector Machine)………...33
Table 9- Confusion Matrix (Support Vector Machine (Non-linear Kernel)).…….35
Table 10- Confusion Matrix (Decision Tree)………..38
Table 11- Confusion Matrix (Naïve Bayes)…..………..40
6
Acknowledgment
Foremost, I would like to express my sincere gratitude to Dr. Anthony Townsend, my major professor for his continuous support and guidance throughout my graduate studies and related research, for his patience, motivation, enthusiasm, and immense knowledge. This project would not have been possible without his precious support and guidance.
Additionally, I would like to thank the graduate college faculty and staff and all the professors for their constant support and guidance throughout my graduate studies.
Also, I would like to extend my gratitude to my family, friends, and peers for their unfailing emotional support, timely encouragement, and endless patience.
7
Abstract
In this competitive digital era with millions of products and services-based companies in the market, most of the businesses try hard to survive and gain a competitive advantage over others. Every company needs a marketing strategy which provides them an edge over other companies in the market. To have a strong edge over the other companies and to have a great marketing strategy it is essential for a product/services providing company to understand their customers and understand how they feel, think, reason, and select between different products and services available in the market. By better understanding its customers and their purchasing behavior, a company can increase its digital presence, improve user experiences, predict how customers will respond to its marketing strategies, retain loyal customers, develop/enhance marketing strategies to create new consuming markets, and increase sales revenue. The purpose of this research project is to investigate the buying behavior of mid-west tool manufacturing company’s customers to enable it to become one of the top brands in terms of providing woodworking plans and products in the market. The data analysis conducted on customer data collected through the company’s websites enabled understanding of the type of customers interested in buying its products, the kind of woodworking projects customers look for, the kind of tools and products (in terms of clamping, joining, routing, cutting, or measuring) they are interested in, the popular channels and sources directing customers to its websites, the type of customers who are likely to purchase its products and the factors contributing towards these consumer purchases. This research project also focusses on predicting whether a targeted customer will buy the company’s product or not if the company provides him/her with some special offers. Machine learning models were built using classification techniques: Logistic
8
Regression, Support Vector Machine, K-Nearest Neighbor, Decision Tree, Naïve Bayes, and Random Forest to predict customer purchases when given an offer and a comparison of these models was done to choose the best model to predict customer purchase behavior. Confusion matrices and prediction accuracy were used to evaluate the performance of the classifier on the test sample. The demographic variables such as age and annual salary played an important role in predicting whether the customer will buy a product or not if given an offer. The developed dashboards and models as part of this research project will enable the executives at mid-west tool manufacturing company to make informed decisions about the company’s future growth. Overall, this project analyzed the what, where, when, and how customers buy the company’s products.
9
1.
Introduction
Due to the proliferation of information systems and technology, although organizations are increasingly gathering huge amounts of data, they are still not able to unleash the power behind the data to its full potential. In today’s competitive market, where there are multitudinous products available, businesses need to understand their customers before developing marketing strategies to have a competitive advantage over others. It is critical to understand customers and the factors that motivate customers to make purchases, to satisfy the needs of the customers, and to retain existing customers and expand the market towards prospective customers. To target potential customers and retain the existing customers, it is imperative to understand how customer think, reason, feel, and make purchasing decisions when selecting a product from a wide range of alternatives available in the market (Bala, 2010). A better understanding of customers usually helps managers in establishing better marketing campaigns (Song, Kim, & Kim, 2001). Consumer behavior is the study of what, where, when, and how a consumer buys or do not buy a product/service. The customer's shopping information such as frequency of purchasing, products purchased, etc. and demographic information such as salary, age, gender, etc. are the important inputs used in data mining of purchasing behavior of the customers (Bala, 2010).Customer demographic attributes are primarily applied by most of the customer behavior studies to analyze customer buying behavior (Song et al., 2001). Since mid-west tool manufacturing company collects a huge amount of data about its customers and that data has not been used to its full potential, this project will enable it to unleash the power behind their customer data and will help them to increase customer reach, retain existing customers, and
10
improve products placement. Analysis of available customer data will help c-suite executives at mid-west tool manufacturing company take informed decisions related to the company’s future growth and market expansion. If we see the problem on an abstract level, the bigger picture shows that it is related to some of the phases of customer relationship management (Ngai, Xiu, & Chau, 2009):
Finding Customers: (Customer Acquisition): This phase consists of gathering and collating data about company’s customers through the online transactions and the sales data, online buying behavior logs, customer data etcetera and analyze it to determine the characteristics of existing customers and characteristics of prospective customers and perform customer segmentation based on similar traits between customers. Through this analysis, we will be able to know how and what type of customers buy the company’s products. The collected data can be used to create customer profiles based on which the marketing team can decide on the right business strategies and tactics to meet customer needs (Shaw, Subramaniam, Tan, Welge, 2001) which will help it to improve customer reach and products placement. The analysis results will help the marketing team to target these identified customers so that they do not switch to other competitive brands to satisfy their needs. To acquire customers and expand existing market presence, it is vital to know our existing customers. Collected customer details like age, sex, education, marital status, employment, annual salary, social media behavior, and hobbies help us in narrowing down the collected customer details regarding and provide aid in creating customer profiles for our existing customers. Customer Support team and their existing conversations with customers can help us to gather data about the customers.
11
Getting found by the customers (Customer Attraction):
The primary focus of this phase is to attract the targeted customers identified in the previous phase through various direct marketing techniques such as emails or coupons (Ngai, Xiu, & Chau, 2009).
Retaining the existing customers (Customer Retention): With increasing complexity and competition in today’s business, organizations need to have innovation in the work they do and the services they provide to capture customer needs and improve customer satisfaction and retention (Khajvand, Zolfaghar, Ashoori, & Alizadeh, 2011). Getting to know how many existing customers are satisfied with the products/services a company offers and which kind of customers come back again to purchase company’s products is very important because repeated patronage of a supplier is closely related to repeated buying behavior variable and brand-loyalty (Hennig-Thurau, Klee, 1997). In this phase, the primary focus would be re-targeting and re-engaging the existing customers whose data we have collected and analyzed in the previous phases. Customer retention may consist of the following elements: loyalty programs, one-to-one marketing, and complaints management (Ngai, Xiu, & Chau, 2009). To stand out in the market or to have a competitive edge over others, it is important to consider customer experience and engagement concept. All the companies provide customer service, and customers tend to get in touch with the firm when they need help or information with something, they are not able to figure out on their own. When a customer contacts a firm for seeking help, the experience he/she faces creates an impact on whether to continue buying products or services of a particular firm or not. Customer engagement is to take the customer service process up by a notch which can be done by following the below ideologies:
12
1. Actively seek and connect to the customers to find out needs and feedback.
2. Include customer feedback in the action plans and in the process of reforming the products.
3. Provide multiple channels for customers to reach the company. The customer can find similar business services in the current competitive market, however; if the experience is unique and the engagement part is taken care, it can help in transitioning the existing customer into a loyal customer. Expanding the existing market (Customer Development):
This phase consists of expanding the intensity of transactions, transactional value, and profit obtained by individual customers (Ngai, Xiu, & Chau, 2009). Techniques of customer development include market basket analysis, up-selling, customer lifetime value analysis, cross-selling (Ngai, Xiu, & Chau, 2009).
Based on the business requirements and characteristics of data, our primary focus is to identify the manufacturing company’s customers that is to get to know the characteristics of manufacturing company’s customers and help the company in optimizing their marketing campaigns by building classification models to predict if given an offer to existing customers whether they will buy a company product or not provided that demographic data such as age and salary about the company’s customers are known by the company’s marketing team.
13
• How do customers find mid-west tool manufacturing company’s woodworking plans, tools, and products?
• What are the most popular sources for purchasing the company’s products?
• Do the existing customers come back after purchasing products from the company?
• What are the most popular mediums directing customers to company’s products and tools?
• What role do personal or demographic factors play in purchase decisions?
• Which type of customers are the most likely to buy the company’s product when given an offer?
• Which type of customers are least likely to buy the company’s product when given an offer?
2.
Literature Review:
In today’s competitive market, where there are numerous products available for every category, it has become essential for companies to improve and optimize the shopping experiences of customers. Companies are striving every day to optimize their marketing strategies by better understanding the needs and wants of their customers and analyzing their purchasing patterns to provide an excellent shopping experience so that the consumers do not feel like switching between brands and remain loyal to using their preferred brands. It has become essential for organizations to identify their customer segments and track their changes over time to understand their customer
14
expectations (Bottcher, Spott, Nauck, & Kruse, 2009). To understand their customers, it has become vital for organizations to collect as much information as possible about the customers and their business interactions, analyze this collected information, develop insights, and learn from it and take appropriate actions (Bottcher, Spott, Nauck, & Kruse, 2009). There has been a tremendous amount of research done in analyzing customer buying behavior or mining customer changes in customer behavior. Customer behavior analysis can be seen as a part of analytical customer relationship management (Ngai, Xiu, and Chau, 2008). Data mining tools and techniques can be used to discover hidden patterns behind huge amounts of customer data collected by most of the organizations. One or more types of modeling can be performed by each data mining technique such as Association, Clustering, Classification, Regression, Forecasting, Visualization, Sequence Discovery (Ngai, Xiu, & Chau, 2009) and numerous machine learning methods are available for each data mining models such as Logistic Regression, Association rule, K-Nearest Neighbor, Decision tree, Neural Networks etc.
With massive amounts of data collected and stored everyday about customers (customer profiles, transactions, and sales data); most of the organizations feel that they are not able to unleash the power behind this collected data and are becoming interestingly interested in mining association rules behind this collected data (Song et al., 2001) as they believe proper analysis of this data can help develop insights into their customers. Bottcher, Spott, Nauck, & Kruse (2009) proposed a system for customer segmentation, which is based on the discovery of frequent itemsets and analysis of their change over time. In Song, Kim, & Kim (2001) association rule mining was mainly used to discover meaningful and useful patterns from the customer transaction databases. Song, Kim, & Kim (2001) devised a methodology to automatically
15
detect changes from customer profiles and sales data collected over periods. The authors defined three types of changes: Unexpected change, Emerging pattern, and the Add/perished rule and developed similarity and difference measures for rule matching to detect all types of changes. By using the degree of change, they determined the significantly changed rules. Bala (2010) also defined four types of patterns in purchase behavior: Emerging, Perished, Added, and Unexpected patterns but his research was mostly focused on change mining on the other products purchased by the shoppers, i.e., finding patterns in the products in conditional part through association-rule mining. However, Changchien, & Lu (2001) proposed an approach of performing clustering along with association rules extraction in data mining tasks by integrating a neural network SOM and rough set theory into clustering and rule extraction modules thus, helping the company to perform customer or product segmentation, one-to-one on-line marketing and analyzing customer favorites.
Huang (2012) proposed a new change mining model named MineFuzzChange in his research paper [8] which focuses on mining purchasing logs in a dynamic market context to detect changes in fuzzy-time interval sequential patterns thus, helping managers in a better understanding of changing behaviors of their customers. This technique was proposed for formulating effective, timely marketing and inventory strategies, since if the knowledge is not updated by the managers based on time-trends, then fuzzy time-interval methods will not be useful to mine changes in customer behavior changes (Huang, 2012). A time-interval sequential pattern usually causes sharp boundary problem (when time-interval is near the boundary of two adjacent ranges) (Huang, 2012) but fuzzy time-interval sequential patterns adequately tackle such kind of problems; however, it fails to consider customer
16
behavioral changes in rapidly changing electronic commerce environments. Hence, MineFuzzChange was proposed to detect changes in fuzzy time-interval sequential patterns.
Furthermore, to help managers in developing effective marketing strategies, Chen, Chiu, & Chang (2005) proposed a methodology of integrating customer behavior variables (recency, frequency and monetary), demographic variables and transaction databases to mine changes in customer behavior. The authors developed improved modified measures of similarity and unexpectedness for mining changes in customer behaviors at different time snapshots to remove the limitations of the designed measures of similarity and unexpectedness by Song et al. (2001) which could only analyze patterns with a single attribute on the right-hand side of an association rule. The methodology defined by Bala (2010) was also limited to analyzing only a single item in the consequent parts. Zhang, & Zhang (2007) developed an agent-based model of consumer purchase decision making using multi-agent simulation (MAS) to exhibit the emergent decoy effect phenomenon to cope with the real-time changes and complexities in the real-world market. The authors combined consumer psychological personality traits with two interactions: the agent (customer) and brand managers interaction and interaction between consumer agents.
3.
Project Methodology:
The primary focus of this project is to enable the mid-west tool manufacturing company in better understanding their existing customers and potential customers. The marketing team at the company is already using certain marketing techniques to target existing customers and motivate them towards buying the company’s products. The mid-west tool manufacturing company
17
and the third-party outsourced companies which provide services to company’s customers have been collecting huge amounts of customer data. The Marketing department at the company now aims to optimize their existing marketing strategies by better understanding their customer’s needs and wants, so that company’s brand becomes the top brand in the market in terms of offering woodworking plans and tools. Using the existing customers’ demographic data such as age, salary, and gender, the marketing team wants to know that if given an offer to these customers, will they buy the company’s product or not. Based on the characteristics of available data about the customers, the data mining technique which we will be used to predict if given an offer whether the customer will buy the company’s product or not is classification. Moreover, for analyzing the customer data collected through the company’s websites, web analytics tools such as Google Analytics is used to get a better understanding of the company’s customers and their purchasing characteristics. Through the data collected we develop web analytics dashboards which help us in creating customer profiles based on which the marketing team can decide on the right business strategies and tactics to meet customer needs and target existing and potential customers (Shaw, Subramaniam, Tan, Welge, 2001) which will basically help the company to improve customer reach and products placement. Some of the analysis which was done on the collected company’s websites data is as follows:
The following figure shows the weekly trend of the number of users visiting the company’s websites:
18
Figure 1- Weekly Trend of Tool Manufacturing Company’s Users this year
The following column chart shows the age distribution of the company’s customers:
Figure 2- Age distribution of Tool Manufacturing Company’s Customers
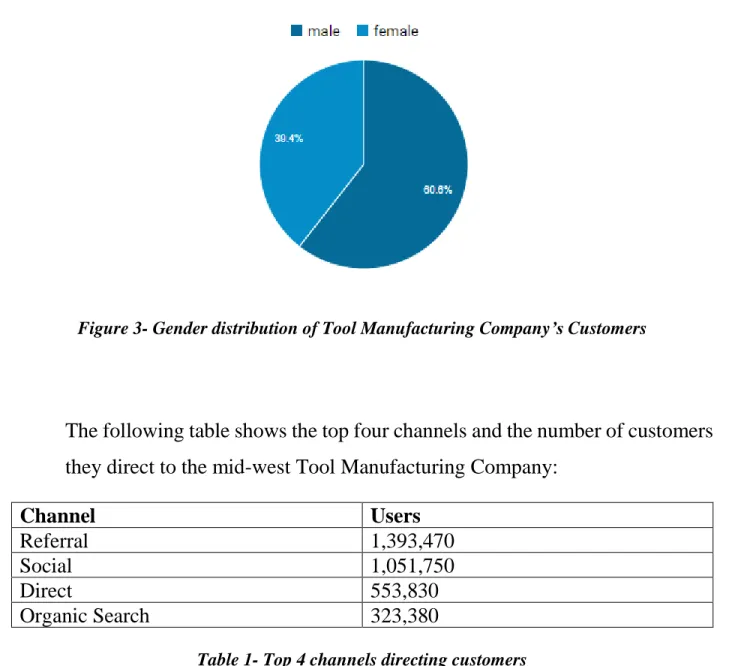
The following pi-chart shows the gender distribution of the company’s customers:
19
Figure 3- Gender distribution of Tool Manufacturing Company’s Customers
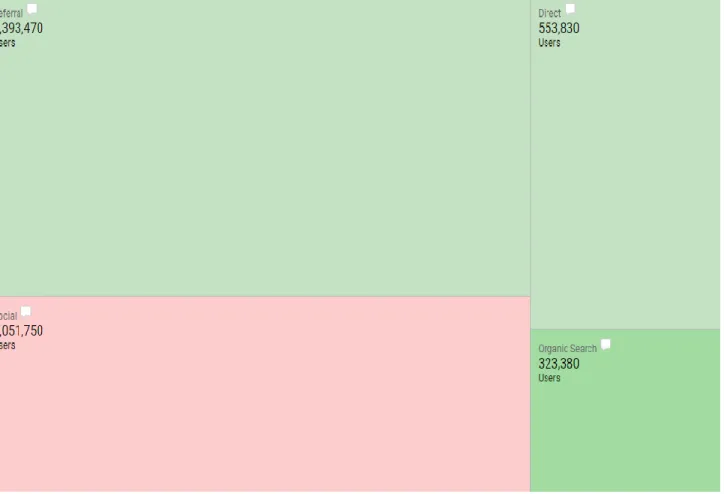
The following table shows the top four channels and the number of customers they direct to the mid-west Tool Manufacturing Company:
Channel Users
Referral 1,393,470
Social 1,051,750
Direct 553,830
Organic Search 323,380
Table 1- Top 4 channels directing customers
The following table shows the top five sources among the referral channel and the number of customers they direct to mid-west Tool Manufacturing Company:
Source Users
email.kregtool.com 758,481
kregtool.com
20
homemadebycarmona.com 56,576
hertoolbelt.com 53,392
thebalance.com
48,143
Table 2- Top 5 referral sources directing Customers
The following table shows the top five sources among the social channel and the number of customers they direct to mid-west Tool Manufacturing Company: Source Users Pinterest 897,233 Facebook 97,107 Instagram 29,474 YouTube 10,425 StumbleUpon 6,514
Table 3- Top 5 social sources directing Customers
The following table shows the top five sources among the direct channel and the number of customers they direct to mid-west Tool Manufacturing Company: Source Users https://www.buildsomething.com/ 93,699 https://www.buildsomething.com/plans /PC5F98F92F899D3B7/FarmhouseXB aseTable 53,177
21 https://www.buildsomething.com/plans /list 52,549 https://www.buildsomething.com/sign-in 23,268 https://www.buildsomething.com/plans /PCCE4E032F1E474F8/ModernFarmh ouseSquareCoffeeTable 12,029
Table 4- Top 5 direct sources directing Customers
The following table shows the top five sources among the organic search channel and the number of customers they direct to mid-west Tool Manufacturing Company: Source Users Kreg tool 313,006 Build something 531 Buildsomething.com 448 Amazon 383 Wood plans 207
22
The following heat-map shows the top channels (referral, social, direct, organic search) and the number of customers they direct to mid-west Tool Manufacturing Company:
Figure 4- Channels and customer distribution
The following chart shows the new versus returning visitors to the company’s websites:
New Visitors: 3,157,928 Returning Visitors: 823, 946
23
Figure 5- New versus Returning Customers
In this competitive market, where there are multitudinous products and services available, deeper understanding of customers and their characteristics and behaviors can help an organization to maximize its customers’ value. Hidden characteristics of customers and their behaviors can be extracted from large databases using several data mining techniques (Ngai, Xiu, & Chau, 2009). One or more types of modeling can be performed by each data mining technique such as Association, Clustering, Classification, Regression, Forecasting, Visualization, Sequence Discovery (Ngai, Xiu, & Chau, 2009).
To help the marketing team at mid-west Tool Manufacturing Company, classification technique has been used to model the problem of predicting whether a customer purchases the company’s product or not
24
if given an offer by the company. Using the customer purchases information collected by marketing offers and directing ads to the customers, the goal is to determine whether the customer will buy company’s product or not if an offer is given to the customer.
Classification techniques such as Logistic Regression, K-Nearest Neighbor, Support Vector Machine, Decision Tree, and Random Forest are used to build models on a sample of collected customer data to predict customer purchases.
DATASET: There are three independent variables in the dataset about marketing ads targeted towards the tool manufacturing company’s customers which are gender, age, and salary and the dependent variable is purchase (Purchased company’s product or not).
LIBRARIES USED:
Three essential libraries have been used throughout the project to build the machine learning models, which are: numpy, matplotlib, pandas, sklearn.
Numpy: This is a library which is needed to include any kind of mathematics in our code. This contains mathematical tools.
Matplotlib: This library is used to plot charts and visualizations. Pandas: This library is used to import and manage datasets.
Sklearn: This library contains libraries which are used to create machine learning models.
25
DATA PREPROCESSING
A matrix of features was created that is a matrix of three independent variables: gender, age, salary was created, and then a dependent variable vector was created.
• Imputing Missing Values: It is common for customer datasets to have missing values. In this collected dataset, the age values were missing for some of the customers, and for some customers, the salary values were missing. The mean of all the values in the column that contained the missing data, (i.e., for the missing age values, mean of all age values in the age column) was taken to fill in the missing age values — using the imputer pre-processing class provided by the scikit-library the missing values were imputed.
• Encoding Categorical Data: The dataset consisted of two categorical variables. First is the gender variable, which included two categories: male and female, and the second variable is the purchased variable, which included two categories that are yes or no. It was important to encode these categorical variables since the machine learning models are based on mathematical equations. Hence, categorical data cannot be fed into the mathematical equations. The LabelEncoder class was used to encode labels with values. This class is used to encode labels with values between 0 and n_classes-1.
• Splitting data into Training and Test Sets: The data was split into training and test sets. The training set is the dataset on which the machine learning model is build and test set is the dataset on which the performance of the built machine learning model is tested to get an idea of how well the machine learning model understood the data. The
26
machine learning model is built on the training set by establishing some correlations between the independent variables and the dependent variable and once the machine learning understands the correlations between independent variables and the dependent variable, then it is tested to see whether it is able to predict customer purchases if an offer is given to the customer. The train_test_split class is used to split the dataset into a training set and testing set.
• Feature scaling: The Age and Salary attributes in the dataset were feature scaled since they were not on the same scale, which could have caused a problem while building the machine learning model. The salary had a much wider range of values hence the Euclidean distance will be dominated by the salary attribute leading to incorrect predictions hence, it was essential to perform feature scaling to transform the two attributes so that they are in the same range and the same scale. The standardization technique was used to feature scale the two variables age and salary. The StandardScaler class is used to perform feature scaling.
Classification techniques used to build machine learning models are described as follows:
3.1 Logistic Regression:
Logistic Regression is a predictive analysis technique. It is a linear classifier which is used to describe the data and explain the relationship between a single dependent variable and one or more independent variables by predicting the probability or likelihood.
27
The mid-west tool manufacturing company sends offers to individual customers and wants to know if given an offer; the customers will purchase the company’s product or not? So, the logistic regression model is used to predict the probability or likelihood of a customer taking up an offer (purchasing company’s product) given that customer’s age and salary is known by the company.
Using the built model, the following questions can be answered:
• Which customers are the most likely to take up the offer?
• Which customers are least likely to take up the offer?
Figure 6- Training set results (Logistic Regression)
From the above figure, it can be seen that much of the customers who are young with low salaries did not buy company’s product
28
when given an offer, but customers who were young with little high salaries bought products when given an offer. Moreover, most of the customers who are old and have low salaries as well as the customers who are old and have high salaries bought a product when given an offer.
From this, it can be seen that the marketing campaign can be optimized by targeting offers to the customers in the grey region.
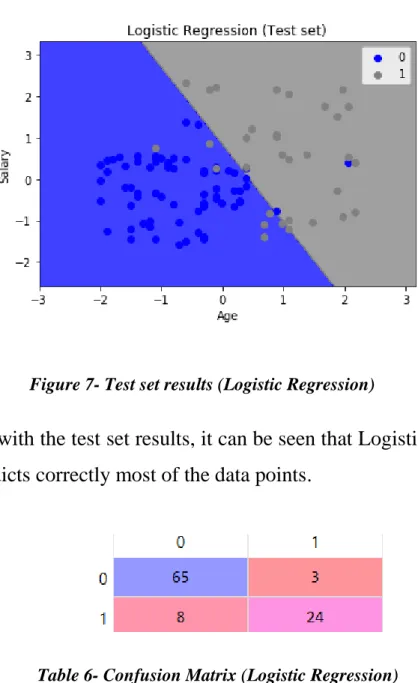
Figure 7- Test set results (Logistic Regression)
So, with the test set results, it can be seen that Logistic Regression predicts correctly most of the data points.
29
From, the above confusion matrix, it can be seen that Logistic Regression predicted only 11 incorrect values but rest all values were predicted correctly that means that the Logistic Regression classifier did perform reasonably well.
3.2 K-Nearest Neighbor:
K-Nearest Neighbor is a non-linear classifier. This classifier follows the following steps to correctly categorize the given data:
1. Chooses the number of K neighbors
2. Takes the K nearest neighbors of the new data point, according to Euclidean distance.
3. From among the K neighbors, it counts the number of data points in each category and finally assigns the new data point to the category where it counted the most neighbors.
30
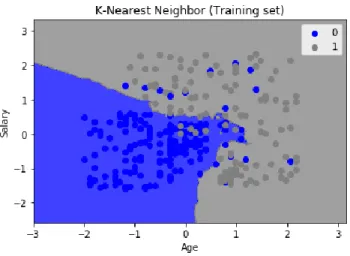
From the above figure, it can be seen that the prediction/decision boundary used by the K-NN did a great job in properly classifying most of the customers. The customers whose age was above average and salary below average were predicted accurately that means these customers will buy a product if given an offer.
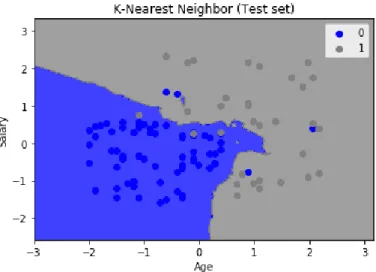
Figure 9- Test set results (K-Nearest Neighbor)
From the above figure, it can be seen that most of the blue points (customers who did not buy a product when given an offer) are in the right region, and most of the grey-points (customers who bought a product when given an offer) are in the right region.
That means that the classifier is able to correctly predict most of the customer purchases. There were some incorrect predictions because the classifier prevented over-fitting.
31
Table 7- Confusion Matrix (K-Nearest Neighbor)
From, the above confusion matrix, it can be seen that K-NN classifier predicted only seven incorrect values but rest all values were predicted correctly that means that this classifier performed better than the Logistic Regression classifier.
3.3 Support Vector Machine:
Support Vector Machine is a classification technique which tries to find an optimal hyperplane which can correctly categorize the given labeled data. The learning of hyperplane can be linear or non-linear depending upon what type of kernel value is fed to the classifier. In this case, we have assumed that the data is linearly separable that is the kernel value is linear.
32
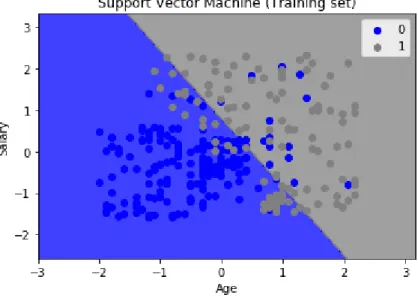
Figure 10- Training set results (Support Vector Machine)
From the above figure, it can be seen that the visualization obtained for the training set results is similar to logistic regression in case of support vector machine with a linear kernel.
33
The test set results, in case of support vector machine with a linear kernel, are also mostly similar to Logistic Regression.
Table 8- Confusion Matrix (Support Vector Machine)
From, the above confusion matrix, it can be seen that the Support Vector Machine with a linear kernel predicted only ten incorrect values. That means that the classifier did not perform better than the K-Nearest neighbor, which only predicted seven incorrect values.
3.4 Kernel Support Vector Machine (Support Vector machine with a non-linear kernel):
Support Vector Machine is a classification technique which tries to find an optimal hyperplane which can correctly categorize the given labeled data. The learning of hyperplane can be linear or non-linear depending upon what type of kernel value is fed to the classifier. In this case, we have assumed that the data is not linearly separable that is the kernel value is non-linear. There are various types of Kernel functions: Gaussian RBF Kernel, Sigmoid Kernel, Polynomial Kernel. In this case, the RBF kernel has been used to elevate the data to a new dimension because of the assumption that data is not linearly separable.
34
Figure 12- Training set results (Support Vector Machine (Non-linear kernel))
From the above figure, it can be seen that the prediction/decision boundary used by the support vector machine with a non-linear kernel did a great job in properly classifying most of the customers. The customers whose age was above average and salary below average were predicted accurately that means these customers will buy a product if given an offer.
35
Figure 13- Test set results (Support Vector Machine (Non-linear kernel))
From the above figure, it can be seen that most of the blue points (customers who did not buy a product when given an offer) are in the right region, and most of the grey-points (customers who bought a product when given an offer) are in the right region. That means that the classifier is able to correctly predict most of the customer purchases.
Table 9- Confusion Matrix (Support Vector Machine (Non-linear Kernel))
36
The number of incorrect predictions for Kernel Support Vector Machine is seven, which is better than Support Vector Machine with a linear kernel. With Logistic Regression and Support Vector Machine with a linear kernel, we had a straight line separating the two categories, which is not the case with a non-linear classifier. The Support Vector Machine with a non-linear kernel jumps to a higher dimensional space to find linear boundary hyperplane in this higher dimensional space and then it projects back this boundary into 2-dimensional space so that data is separable.
3.5 Decision Tree:
A decision tree is a classification approach which uses a divide and conquer method and follows a top-down approach to reach a conclusion or decision. There are two types of decision trees in data mining:
• Regression Decision Tree:
This type of decision tree is used when the predicted outcome/target variable can take continuous values.
• Classification Decision Tree: This type of decision tree is used when the predicted outcome is a class, or the targeted variable can take a discrete set of values.
37
Figure 14- Training set results (Decision Tree)
From the above figure it can, we can see that the prediction boundary is composed of only horizontal and vertical lines, it is trying to catch every single customer in the right category, but it is leading to overfitting. Hence, on new observations, it might lead to incorrect predictions.
38
Figure 15- Test set results (Decision Tree)
From the above figure, we can see that; there are some blue regions in the grey region which are not capturing anything which is the result of overfitting. So, overall decision tree classifier is correctly predicting most of the customers, but it is leading to overfitting, which is not good.
Table 10- Confusion Matrix (Decision Tree)
From the confusion matrix, it can be seen that Decision Tree predicted nine datapoints incorrectly, which is better than earlier classifiers.
39 3.6 Naïve Bayes:
Naïve Bayes is a probabilistic supervised machine learning classifier which is based on applying Bayes theorem with the “naive” assumption of conditional independence between the features given the value of the class variable.
Figure 16- Training set results (Naïve Bayes)
From the Training set results we can see that with Naïve Bayes classifier, we have a beautiful curve with fewer irregularities in comparison to Logistic Regression and K-Nearest Neighbor whose prediction boundaries contained a lot of irregularities and Naïve Bayes classifier manages quite well to capture all the customers with low estimated salaries who actually bought the product which the Logistic Regression and SVM couldn’t classify correctly because they were linear classifiers and their prediction boundary was a straight line. That means that the Naïve Bayes classifier is able to correctly predict most of the customer purchases.
40
Figure 17- Test set results (Naïve Bayes)
From the Test set results we can see that most of the blue points (customers who did not buy a product when given an offer) were predicted correctly by the Naïve Bayes classifier because they ended up in the blue region and the same is with the grey-points (customers who bought a product when given an offer) were predicted correctly as they ended up in the grey region.
41
The number of incorrect predictions for Naïve Bayes is ten, which is more than K-Nearest Neighbor, Support Vector Machine with the non-linear kernel, and Decision Tree.
3.7 Random Forest:
It is a popular ensemble learning method for building predictive models. It fits several decision tree classifiers on various sub-samples of the dataset. The steps followed are as follows: Step 1: Pick at random K data points from the Training set. Step 2: Build the Decision Tree associated with these K data points.
Step 3: Choose the number of Ntree of trees you want to build and repeat STEPS 1 and 2.
Step 4: For a new data point, make each one of your NTree tree predict the category to which the data points belongs, and assign the new data point to the category that wins the majority vote.
42
Figure 18- Training set results (Random Forest)
From the Training set results, we can see that for each customer, there were ten decision trees which predicted whether the customer would buy a product or not when given an offer. Each of the ten trees make prediction yes/no whether the customer will buy a product or not and then there is a majority vote, i.e., random forest classifier counts the number of trees that voted yes that the customer will buy a product and counts the number of trees that voted no that the customer will not buy a product and then takes the prediction that was voted the most time. Most of the blue customers are well classified here, and most of the grey customers are well classified here. We can see that there are very less incorrect predictions here.
43
Figure 19- Test set results (Random Forest)
From the Test set results, we can see that there was some overfitting which can be depicted from the blue region in the grey region. The blue region was made in the grey region to capture the blue customers (customers who did not buy the product) in the grey region, but unfortunately, this region in the test set contains some of the customers who bought the product.
44
From the confusion matrix, it can be seen that we have only eight incorrect predictions incorrectly predicted by the Random Forest classifier.
4.
Evaluation and Comparison:
From the above classifiers modeled to predict customer purchases, we can see that the best classifier that correctly predicted most of the customer purchases was the Kernel Support Vector Machine because for this classifier we had smooth boundaries and it did not have any overfitting. Also, with this classifier we had good accuracy with less number of incorrect predictions, but at the same time it was correctly able to predict the blue customers in the blue region properly (customer who did not buy a product) and the grey users in the grey region properly (customers who bought a product) without having irregular regions like in Random Forest as with Random Forest we had the problem of overfitting which actually let it not perform well for the new observations and also the kernel SVM was better than the linear classifiers like logistic regression and normal SVM because these linear classifiers were not able to correctly classify customers in different region, i.e. blue region and grey region in our case.
45
5.
Discussion and Conclusion:
Based on the above analysis it can be concluded that classification techniques such as Logistic Regression, K-Nearest Neighbors, Support Vector Machines, Kernel SVM, Decision Tree, and Random Forest can be used by the mid-west tool manufacturing company to model the problem of predicting customer purchases if given an offer by the company. However, with the current customer data classification technique: Kernel Support Vector Machines can be used by the mid-west tool manufacturing company to correctly predict customer purchases if given an offer by the company. Based on the current customer data supplied by the company Kernel, SVM performed the best in predicting the customer purchases when given an offer by using the customer demographic data such as age, salary, and gender. Moreover, Google Analytics can be used for analyzing the customer data collected through the company’s websites to get a better understanding of the company’s customers and their purchasing characteristics.
Finally, I hope the above analysis will help the Marketing department at the company to optimize their existing marketing strategies by better understanding their customer’s needs and wants and will help them in better targeting their customers and become a top brand in the market in terms of offering woodworking plans and tools.
46
References:
1. Chen, Mu-Chen, Ai-Lun Chiu, and Hsu-Hwa Chang. “Mining Changes in Customer Behavior in Retail Marketing.” Expert Systems with Applications 28, no. 4 (May 1, 2005): 773–81. https://doi.org/10.1016/j.eswa.2004.12.033.
2. Cheung, Christy M. K., Gloria W. W. Chan, and Moez Limayem. “A Critical Review of Online Consumer Behavior: Empirical Research.” Journal of Electronic
Commerce in Organizations; Hershey 3, no. 4 (December 2005): 1–19.
http://dx.doi.org.proxy.lib.iastate.edu/10.4018/jeco.2005100101.
3. Zhang, Tao, and David Zhang. “Agent-Based Simulation of Consumer Purchase Decision-Making and the Decoy Effect.” Journal of Business Research, Complexities in Markets Special Issue, 60, no. 8 (August 1, 2007): 912–22.
https://doi.org/10.1016/j.jbusres.2007.02.006.
4. Changchien, S. Wesley, and Tzu-Chuen Lu. “Mining Association Rules Procedure to Support On-Line Recommendation by Customers and Products Fragmentation.” Expert Systems with Applications 20, no. 4 (May 1, 2001): 325–35.
https://doi.org/10.1016/S0957-4174(01)00017-3.
5. Bala, P. K. “Mining Changes in Purchase Behavior in Retail Sale with Products as Conditional Part.” In 2010 IEEE 2nd International Advance Computing Conference (IACC), 78–81, 2010. https://doi.org/10.1109/IADCC.2010.5423033.
6. Kim, Young‐Gul, and Chung‐Hoon Park. “Identifying Key Factors Affecting
Consumer Purchase Behavior in an Online Shopping Context.” International Journal of Retail & Distribution Management 31, no. 1 (January 1, 2003): 16–29.
https://doi.org/10.1108/09590550310457818.
7. Song, Hee Seok, Jae kyeong Kim, and Soung Hie Kim. “Mining the Change of Customer Behavior in an Internet Shopping Mall.” Expert Systems with Applications 21, no. 3 (October 1, 2001): 157–68. https://doi.org/10.1016/S0957-4174(01)00037-9. 8. Huang, Tony Cheng-Kui. “Mining the Change of Customer Behavior in Fuzzy
Time-Interval Sequential Patterns.” Applied Soft Computing 12, no. 3 (March 1, 2012): 1068–86. https://doi.org/10.1016/j.asoc.2011.11.017.
9. Böttcher, Mirko, Martin Spott, Detlef Nauck, and Rudolf Kruse. “Mining Changing Customer Segments in Dynamic Markets.” Expert Systems with Applications 36, no. 1 (January 1, 2009): 155–64. https://doi.org/10.1016/j.eswa.2007.09.006.
10. Cho, Yeong Bin, Yoon Ho Cho, and Soung Hie Kim. “Mining Changes in Customer Buying Behavior for Collaborative Recommendations.” Expert Systems with
47
Applications 28, no. 2 (February 1, 2005): 359–69.
https://doi.org/10.1016/j.eswa.2004.10.015.
11. Walter, Joanne S., and David K. Schrader. System and method for analyzing
customer transactions and interactions. United States US6334110B1, filed March 10, 1999, and issued December 25, 2001.
https://patents.google.com/patent/US6334110B1/en.
12. Applebaum, William. “Studying Customer Behavior in Retail Stores.” Journal of Marketing 16, no. 2 (1951): 172–78. https://doi.org/10.2307/1247625.
13. Liao, Shu-hsien, Pei-hui Chu, Yin-ju Chen, and Chia-Chen Chang. “Mining
Customer Knowledge for Exploring Online Group Buying Behavior.” Expert Systems with Applications 39, no. 3 (February 15, 2012): 3708–16.
https://doi.org/10.1016/j.eswa.2011.09.066.
14. Changchien, S. Wesley, Chin-Feng Lee, and Yu-Jung Hsu. “On-Line Personalized Sales Promotion in Electronic Commerce.” Expert Systems with Applications 27, no. 1 (July 1, 2004): 35–52. https://doi.org/10.1016/j.eswa.2003.12.017.
15. Koufaris, Marios. “Applying the Technology Acceptance Model and Flow Theory to Online Consumer Behavior.” Information Systems Research 13, no. 2 (June 1, 2002): 205–23. https://doi.org/10.1287/isre.13.2.205.83.
16. Pawar, Sudarshan, and Sunil Naranje. “‘A Study on Factors Influencing on Buying Behaviour of Customers.’” SSRN Scholarly Paper. Rochester, NY: Social Science Research Network, July 15, 2016. https://papers.ssrn.com/abstract=2810090.
17. Constantinides, Efthymios. “Influencing the Online Consumer’s Behavior: The Web Experience.” Internet Research 14, no. 2 (April 1, 2004): 111–26.
https://doi.org/10.1108/10662240410530835.
18. Chan, Gloria, Christy Cheung, Timothy Kwong, Moez Limayem, and Lei Zhu. “Online Consumer Behavior: A Review and Agenda for Future Research.” BLED 2003 Proceedings, December 31, 2003. https://aisel.aisnet.org/bled2003/43. 19. Hwang, Yujong, and Jaeseok Jeong. “Electronic Commerce and Online Consumer
Behavior Research: A Literature Review.” Information Development 32, no. 3 (June 1, 2016): 377–88. https://doi.org/10.1177/0266666914551071.
20. Liu, Yuping. “The Long-Term Impact of Loyalty Programs on Consumer Purchase Behavior and Loyalty.” Journal of Marketing 71, no. 4 (October 2007): 19–35. 21. Landon, E. Laird. “Self Concept, Ideal Self Concept, and Consumer Purchase
48
22. Chen, Chun‐Shuo, and Long‐Yi Lin. “The Influence of the Country‐of‐origin Image, Product Knowledge and Product Involvement on Consumer Purchase Decisions: An Empirical Study of Insurance and Catering Services in Taiwan.” Journal of Consumer Marketing 23, no. 5 (August 1, 2006): 248–65.
https://doi.org/10.1108/07363760610681655.
23. Jones, J. Morgan, and Fred S. Zufryden. “Adding Explanatory Variables to a
Consumer Purchase Behavior Model: An Exploratory Study.” Journal of Marketing Research 17, no. 3 (1980): 323–34. https://doi.org/10.2307/3150530.
24. Krishna, Aradhna. “The Normative Impact of Consumer Price Expectations for Multiple Brands on Consumer Purchase Behavior.” Marketing Science (1986-1998); Linthicum 11, no. 3 (Summer 1992): 266–286.
25. Chi, Dr Hsin Kuang, Dr Huery Ren Yeh, and Ya Ting Yang. “The Impact of Brand Awareness on Consumer Purchase Intention: The Mediating Effect of Perceived Quality and Brand Loyalty” 4, no. 1 (2009): 10.
26. Moon, Junyean, Doren Chadee, and Surinder Tikoo. “Culture, Product Type, and Price Influences on Consumer Purchase Intention to Buy Personalized Products Online.” Journal of Business Research, Marketing research in Korea: Special joint issue of journal of business research and journal of the Korean academy of marketing science, 61, no. 1 (January 1, 2008): 31–39.
https://doi.org/10.1016/j.jbusres.2006.05.012.
27. Bellman, Steven, Gerald L. Lohse, and Eric J. Johnson. “Predictors of Online Buying Behavior.” Communications of the ACM 42, no. 12 (December 1, 1999): 32–38.
https://doi.org/10.1145/322796.322805.
28. Mittal, Banwari. “Measuring Purchase-Decision Involvement.” Psychology and Marketing; New York, N.Y. 6, no. 2 (Summer 1989): 147–162.
29. Grewal, Dhruv, R Krishnan, Julie Baker, and Norm Borin. “The Effect of Store Name, Brand Name and Price Discounts on Consumers’ Evaluations and Purchase Intentions.” Journal of Retailing, Research Perspective on Retail Pricing, 74, no. 3 (September 1, 1998): 331–52. https://doi.org/10.1016/S0022-4359(99)80099-2. 30. Wu, Shwu‐Ing, and Chen‐Lien Lo. “The Influence of Core‐brand Attitude and
Consumer Perception on Purchase Intention towards Extended Product.” Asia Pacific Journal of Marketing and Logistics 21, no. 1 (January 9, 2009): 174–94.
https://doi.org/10.1108/13555850910926317.
31. Khajvand, Mahboubeh, Kiyana Zolfaghar, Sarah Ashoori, and Somayeh Alizadeh. “Estimating Customer Lifetime Value Based on RFM Analysis of Customer Purchase Behavior: Case Study.” Procedia Computer Science, World Conference on
49
Information Technology, 3 (January 1, 2011): 57–63.
https://doi.org/10.1016/j.procs.2010.12.011.
32. Narkhede,S. (2017, May) Understanding Logistic Regression. Retrieved from
https://towardsdatascience.com/understanding-logistic-regression-9b02c2aec102.
33. Ngai, E. W. T., Li Xiu, and D. C. K. Chau. “Application of Data Mining Techniques in Customer Relationship Management: A Literature Review and
Classification.” Expert Systems with Applications 36, no. 2, Part 2 (March 1, 2009): 2592–2602. https://doi.org/10.1016/j.eswa.2008.02.021.