Received September 16, 2019, accepted November 4, 2019, date of publication November 14, 2019, date of current version December 2, 2019.
Digital Object Identifier 10.1109/ACCESS.2019.2953451
Classification Hardness for Supervised Learners
on 20 Years of Intrusion Detection Data
LAURENS D’HOOGE , (Student Member, IEEE), TIM WAUTERS , (Member, IEEE), BRUNO VOLCKAERT, (Member, IEEE), AND FILIP DE TURCK , (Senior Member, IEEE)
Department of Information Technology, IDLab, Ghent University–imec, 9052 Ghent, Belgium Corresponding author: Laurens D’hooge ([email protected])
This work was supported by the IDLab-Imec.
ABSTRACT This article consolidates analysis of established (NSL-KDD) and new intrusion detection datasets (ISCXIDS2012, CICIDS2017, CICIDS2018) through the use of supervised machine learning (ML) algorithms. The uniformity in analysis procedure opens up the option to compare the obtained results. It also provides a stronger foundation for the conclusions about the efficacy of supervised learners on the main classification task in network security. This research is motivated in part to address the lack of adoption of these modern datasets. Starting with a broad scope that includes classification by algorithms from different families on both established and new datasets has been done to expand the existing foundation and reveal the most opportune avenues for further inquiry. After obtaining baseline results, the classification task was increased in difficulty, by reducing the available data to learn from, both horizontally and vertically. The data reduction has been included as a stress-test to verify if the very high baseline results hold up under increasingly harsh constraints. Ultimately, this work contains the most comprehensive set of results on the topic of intrusion detection through supervised machine learning. Researchers working on algorithmic improvements can compare their results to this collection, knowing that all results reported here were gathered through a uniform framework. This work’s main contributions are the outstanding classification results on the current state of the art datasets for intrusion detection and the conclusion that these methods show remarkable resilience in classification performance even when aggressively reducing the amount of data to learn from.
INDEX TERMS CICIDS2017, CICIDS2018, cyber security, intrusion detection, ISCXIDS2012, network security, network traffic classification, NSL-KDD, ML, supervised machine learning.
I. INTRODUCTION
The second layer of protection in computer networks, behind a well-configured firewall, is an intrusion detection sys-tem (IDS). This technology has been a mainstay in network security research for more than 30 years with documentation outlining the requirements and potential designs of such sys-tems [1]. Throughout the years many strategies have been developed, both in academic and commercial settings. This work and all its referenced work will refer to network-based intrusion detection (NIDS) as opposed to host-based intrusion detection. Network-based intrusion detection systems only have access to information that can be obtained on the net-work. In practice this means that the evaluation is done on the features that can be derived from packets and network
The associate editor coordinating the review of this manuscript and approving it for publication was Wei Quan.
flows or on the corresponding raw data. Host-based intrusion detection systems reduce their vision of the network to the incoming and outgoing traffic of that host, but they have access to information of the live operating system such as file access, user sessions, running software, etc. The most popular implementations of network intrusion detection sys-tems are tools like Snort [2] and Bro [3]. These are so-called rule-based systems. The evaluation of traffic happens at the packet level and is essentially a comparison to a database of signatures of known, malicious traffic. This approach proved to be very successful in recognizing known patterns, but breaks down when tasked with the classification of perturbed known or unknown patterns. While these methods are still in use today, they are only part of the picture of available strategies in intrusion detection. Taxonomies have identified two other popular approaches. The first of which is stateful protocol analysis in which attempts are made to model valid
interactions at the network protocol level. Since some attacks deviate from the expected interaction pattern, these can be identified [4]. A related field is focused on uncovering flaws in networks that employ new protocols. The vulnerabilities are often associated with the protocol itself, its implementa-tion or the available interacimplementa-tions with other devices and / or actors in experimental setups. Research in this field ( [5], [6]) tries to get ahead of problems with new technologies before they reach widespread adoption. The third strategy can be put under the umbrella of statistical anomaly detection. Early implementations in this category relied on static metrics of a network, with later implementations introducing dynamic metrics to avoid a rigid system that reports lots of false positives. The expansion of processing power and memory has allowed more expensive techniques to be used that have the ability to cope with large amounts of data and learn from them. These methods, classified under the umbrella term machine learning, have proven to be very successful on the benchmark datasets that are available in the research community. Within the set of ML methods several broad paradigms exist. Four distinctions exist: supervised ML mod-els a domain through experiencing labeled samples from it. Unsupervised ML has data without labels from which it tries to learn useful lower-dimensional representations, find relevant clusters or estimate the distribution(s) whence the samples come from [7]. Semi-supervised learning combines both methods, starting out with an often small set of labeled samples and a larger corpus of unlabeled samples [8]. The final paradigm that has enough distinction to be its own category is reinforcement learning in which an agent per-forms actions towards a goal, being rewarded for actions that lead to achieving the goal and punished for poor actions. The combination of exploration and feedback lets the agent develop good strategies and techniques to tackle the issue it was given [9]. Most of the current research effort into intrusion detection is focused on improving within the super-vised learning paradigm [10], [11]. This article contributes an in-depth evaluation of several families of supervised ML techniques when placed under increasingly severe restrictions with regard to the available data to learn from. The evaluation is done on four datasets that contain data from 20 years of intrusion detection data generation. The key research finding is the robustness of the classifiers on all datasets against aggressive forms of both sample and feature reduction.
II. RELATED WORK
An extensive body of research on the topic of intrusion detec-tion through machine learning exists. Because this analysis is wide rather than focused on a single technique, it fits more closely among review papers and other comparative analyses. Some of the key conclusions related to machine learning for IDSs are summarized hereafter.
Mishraet al.[12] provide a very extensive review, focus-ing on the KDD98/99, NSL-KDD family. The main part of the article is a four-part overview of the application of ML in intrusion detection. The authors decided to group the
reviewed articles based on whether they use a single or mul-tiple classifiers for detection and whether all features were available for the classifiers to learn from. The article covers a large, representative sample of published material from 2002 to 2017. Reducing features for single classifiers did not improve detection rate, but when using multiple classifiers this works well. Another interesting conclusion is that the state of the art methods differ significantly for the various classes of cyber attacks.
Wuet al. [13] surveyed computational intelligence (CI) methods over the KDD-collection and constrained their review to five classes of algorithms, most of which are biologically-inspired models. This set of algorithms includes artificial neural networks (ANN), evolutionary computa-tion (EC), fuzzy sets, artificial immune systems and swarm intelligence. During their survey the authors note that these techniques are not always standalone, but can be used as optimizing or explaining components for the other classes. The review ends its main part with soft computing, really zooming in on the synergy between earlier methods to arrive at techniques like neuro- and genetic-fuzzy systems. The dis-cussion contains the numerical results from articles published between 1997 (and earlier) and 2007. From the review it would seem that CI methods built up to a peak at 2005 and then declined. This would be consistent with the increased attention for other machine learning methods that has been going on for several years now. Perhaps a rediscovery of the methods described in this article, could be of great benefit.
Thaseen and Kumar [14] explored the use of many tree-based classifiers for intrusion detection systems. Their evaluation happens on NSL-KDD and features eight decision tree (DT) learners: alternating DTs (ADT), C4.5, J.48, ADTs with logistical boosting, naive-bayes trees, random tree, random forest and reduced-error pruning trees (REPTree). It should be noted that two feature selection strategies were used, reducing the number of features to learn from to eight and ten respectively. Their results show that methods that incorporate boosting are computationally an order of mag-nitude more expensive, without achieving superior perfor-mance. Random forests reach the highest scores of 0.975 on both precision and recall on the test dataset, while being one of the most inexpensive methods.
Liaoet al.[15] included research from the other paradigms in intrusion detection, namely signature-based IDS and state-ful protocol analysis. The compiled research is distinguished further by including the level at which the intrusion detection was being done (host, network or protocol) and whether it could pick up on known and unknown attacks. By casting a much wider net than just focusing on machine-learning IDSs, more generalist claims could be substantiated. This article provided a stronger foundation for the claim that signature-based intrusion detection systems really do not gen-eralize well, making maintenance of the rule database very costly. Anomaly-based methods fare better on the generaliza-tion front, but are often held back by performance constraints with regard to time. Classification performance is given only
in a tiered notation (Low, Medium, High). The authors also devote a section to intrusion detection in virtualized environ-ments noting that performance degradation was an avenue that needed more research.
The work detailed in this article vastly expands on an earlier publication [16] which applied a smaller ver-sion of the comparative strategy to produce a baseline for CICIDS2017 that was not yet available. The work concludes by identifying tree-based learners as the best choice, with meta-estimators based on decision trees being optimal. Other methods can be as performant, but often on a smaller set of attack classes or at a higher computational cost. The only class for which a tree-based meta-estimator did not achieve great performance was infiltration. This shortcoming was attributed to the lack of training samples in the data (CICIDS2017 only contains 36 positive infiltration samples). Recognition of all other classes went consistently higher than 99% on multiple metrics, including both precision and recall.
III. METHODOLOGY
This section describes the experiment, starting with the choices in framework design, followed by a description of the datasets, the included algorithms and adaptations to test the robustness of classification when faced with reduced learning data.
A. FRAMEWORK DESIGN
As mentioned earlier, all datasets have been processed with the same lightweight framework. Some key principles are embedded in the design and implementation of the frame-work. The corresponding code is publicly available.1This is a deliberate move towards more transparency in the experiment design.
1) STANDARDIZED PIPELINE
The paths through which the data moves reflect the standard that has emerged in the industry. The data gets loaded and pre-processed after which the hyperparameters of the algorithms are optimized. These optimized parameters are then used in a final training of the model that can be deployed. Code is maximally shared between the two pipelines. The pre-processing is the only section that contains dataset-specific modifications. For the hyperparameter search 33 or 50% of the data is split off first in a stratified manner after which it is broken down further into 5 train-validation folds. The second split is repeated five times, resulting in a total of 25 train-validation folds that are used to select the optimal hyper-parameter values. The remaining 67 or 50% of the original data is not used during the hyperparameter optimization. Only the optimal sets of parameters are stored. These values are retrieved and set for the algorithms in the single execution part of the pipeline. The single execution part is disjoint from the hyperparameter optimization to be able to set fresh
1Base framework code: https://gitlab.ilabt.imec.be/lpdhooge/clean-ml
train-test splits with rate couples that vary between 0.1-99.9% and 33-67% or 50-50%. Five metrics were taken into con-sideration to rank the models with the tested hyperparame-ter combinations. These metrics are: balanced accuracy (the average of the per-class accuracy, implicitly incorporating class imbalance), precision (the proportion of truly positive items in the data to the amount of items deemed by the model as positives), recall (the number of samples classified as positive divided by the total amount of positive samples in the data), F1-score (the harmonic mean of recall and precision) and the receiver-operator characteristic area under the curve (ROC-AUC) (a visual metric summarized as class separa-bility with 1 being perfect separation and 0.5 meaning total overlap). The hyperparameter set that was deemed optimal was the set that ranked highest most consistently in the five available rankings. The results of this process: mean fold validation scores for each of the metrics, optimal hyperpa-rameters, as well as the search time are stored in Javascript Object Notation (JSON) files.
2) MODEL PERSISTENCE FOR FUTURE RESEARCH
After evaluation the trained models are not thrown away, but saved to disk in a serialized format. The naming scheme used to store the cross-validation results was extended so that settings with which the models were trained are easily recognizable. This is a preparatory step for future research investigating the generalization strength of machine learning models for intrusion detection.
3) EXTENSIBILITY
Due to the dynamic nature of the demands being placed on the framework, it is crucial that the system is extensible without breaking earlier results. The insistence on this principle is the reason why adding new datasets could be done with solely modifications to the preprocessing.
4) PORTABILITY
The set of dependencies is deliberately minimal and their capabilities maximally used so that an external party can get the entire system working with these commands (example for Ubuntu Linux distributions).
apt-get update
apt-get install -y python3 python3-pip pip3 install sklearn numpy xgboost
ln -s -f /usr/bin/python3 /usr/bin/python Paths might differ and the symlinking might not be required if the distribution uses python3 as the standard python executable.
Because of the amount of variable parameters to the anal-ysis, two scripts have been written to produce files with the proper invocations. A side-effect of this is that upon reading these files an understanding of the input and out-put of the system is obtained without doing source code inspection.
TABLE 1. Per dataset normal / malicious sample composition.
B. INCLUDED DATASETS
This section contains short introductions to the four data sets that are included in this analysis. More details about the specifics of this data that impacts the results, is dis-cussed alongside the results. Table 1 lists the sample com-positions (benign / malign) for each dataset and each attack class.
1) NSL-KDD
Published in 2009, but still only containing traffic generated in 1998, NSL-KDD [17], [18] is the most well-studied dataset in intrusion detection to date. Improving on structural flaws present in KDD99, this reinvigoration of the data has been successful as a baseline against which all researchers compare their results. It is for that reason that it is included here alongside the much newer datasets.
2) ISCXIDS2012
The need for more modern, realistic data to test network intru-sion detection systems was apparent after the republishing of data from 1998. That is why the same research institute that created the updated version of KDD99 set up a new experiment for data generation. That experiment culminated in a first public data set labelled ISCXIDS2012 [19], [20]. The generation process happened in a separate network with real machines operating under automated scenarios to generate both baseline and attack traffic. It contains a mere 15 features including 4 that are derivatives of packet payload.
3) CICIDS2017
Five years after publishing ISCXIDS2012 a new version CICIDS2017 ( [21], [22]) was released that expanded the scale of the experiment, the available dynamic baseline and attack scenarios. It also vastly improved the capture file processing to result in 7 days (7 files) of 80-feature, labeled flows. The separation into several days, each containing a specific class of cyber attacks is useful to differentiate the results.
4) CICIDS2018
The most recent iteration from 2018 [23] moved the infrastructure for the experiment to the cloud. Besides an increase in the amount of simulated clients in subnetworks, no real changes in methodology were included. The data for researchers to work with consists of 10 days of 80-feature, labeled comma separated values (CSV) files containing benign and malicious network flows.
C. INCLUDED ALGORITHMS
A total of twelve supervised classifiers were included, two of which were left out of hyperparameter optimiza-tion, due to computational infeasibility or limitations in the algorithm’s implementation. (i.e. radial-basis-function kernel support vector machine (RBF-SVM) and nearest centroid) The algorithms are divisible into three classes. All tree-based methods used gini-impurity to make splitting decisions. The abbreviations next to the methods will be used through-out the rest of the text and in the figures. Important innova-tions in the field are captured in the set of decision tree based classifiers. The methods from other families were added for comparative purposes. Detailed information on every individ-ual algorithm can be obtained in these references [24]–[26].
1) Tree-based methods • Decision tree (dtree)
• Decision trees with bagging (bag) • Adaboost (ada)
• Gradient-boosted trees (gradboost) • Regularized gradient boosting (xgboost) • Random forest (rforest)
• Randomized decision trees (extratree) 2) Neighbor methods
• K-nearest-neighbours (knn) • Nearest-centroid (ncentroid) 3) Other methods
• Linear kernel SVM (linsvc) • RBF-kernel SVM (rbfsvc) • Logistic regression (binlr)
D. INCREASING THE LEARNING DIFFICULTY
The results obtained with the earlier implementation of this framework on CICIDS2017, documented in [16], showed great classification results. Through inspection of the inter-mediate results of the cross-validation process, the sin-gle execution results could not be written off as flukes.
This prompted new work to improve the results further. Efforts to try to increase the learning difficulty included aggressively reducing the amount of samples to learn from (vertical reduction) and iteratively removing the features with the highest discriminating power (horizontal reduc-tion). The objective was to break classification up to the point where the methods could no longer be considered usable.
1) VERTICAL DATA REDUCTION
The data was sampled in a stratified way in a train-testing splitter. On NSL-KDD, ISCXIDS2012 and CICIDS2018 a linear space with 11 increments between 0.01 and 0.50 was chosen. For CICIDS2017 a finer-grained space from 0.01 to 0.33 with single percent increases was used. Intermediate visualization of the results did not yet show a clear breaking point in many cases. Therefore additional results were col-lected with only 0.001 and 0.005 percent of data available for training. Because it is a train-test split, one percent used for training, means that testing gets done on 99% of the data. It follows that good results after training on little data are extra impressive.
2) HORIZONTAL DATA REDUCTION
Work that includes feature selection and / or -reduction often does so to reduce computational workload or to stabilize results by removing redundant (e.g. heavily correlated) fea-tures. This work has opted to do the opposite to increase the classification difficulty.
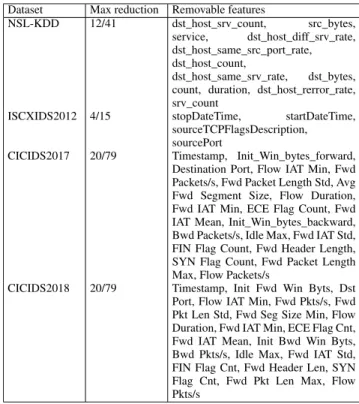
From each dataset certain features are removed, either because they would obviously contaminate the results, are redundant or are otherwise problematic. For NSL-KDD the labels_numeric feature has been removed. For ISCXIDS2012 the featuresgenerated, sourcePayloadAs-Base64,sourcePayloadAsUTF,destinationPayloadAsBase64 and destinationPayloadAsUTF have been removed. For CICIDS2017/8Flow ID,Source IP,Source Port,Destination IPandDestination Porthave been removed.
To find out which of the remaining features are most consequential, decision trees trained on 33 or 50% of the data for each available day were kept. Subsequently these trees were parsed, collecting which feature was used to split at each node. The top features were removed in proportional blocks to the number of available features, until around ~25% of the most successful features were removed.
As noted earlier, features that could be considered artifacts of the data creation process had already been removed. The procedure resulted in the additional removal of the features in table2.
One finding immediately stands out. A strong argument can be made against including simple time features in the data as these will not be representative in real-world scenarios. Unfortunately, they are the top feature(s) for several datasets and will probably still be included in analysis by researchers who use the full feature set.
TABLE 2.Most discriminative features to remove from each dataset.
IV. RESULTS
A very large volume of results has been collected, due to the expansiveness of the experiment. This section will therefore be divided into multiple parts. The results for every data set will be reported individually at first. Per dataset the break-down will be according to the algorithm classes described in section III-C. The last subsection V aims to merge the individual conclusions to create a well-founded total picture. Textual information is always given in a manner that contrasts the results so that the (dis)advantages of methods compared to each other are more pronounced. All mentions of percentual increases or reductions in classification performance are to be interpreted as absolute values.
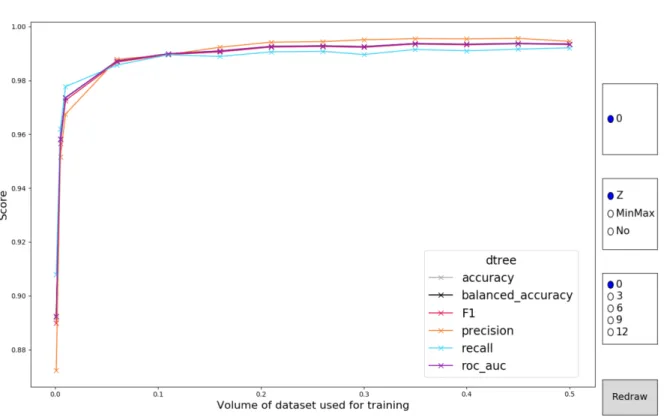
A. NOTE ON GRAPHICS
In total, 76468 result points with six metrics each have been collected. Tooling has been created to get visual insight in these results. This tooling consists of 48 interactive plots in which the metric scores are set against the volume of data used for training. Parameters such as attack class (if the dataset has multiple days), the type of scaling and the number of removed features can be altered. This approach yields contained units for every algorithm (and every dataset) in which all relevant parameters of the analysis can be tweaked with immediately updated visualizations. A sample graphic of the visualization is shown in figure IV-A. All results and corresponding code of both the analysis and the visualizations are at the following locations:
• https://gitlab.ilabt.imec.be/lpdhooge/nslkdd • https://gitlab.ilabt.imec.be/lpdhooge/iscxids2012
FIGURE 1. Example of the available interactive plots.
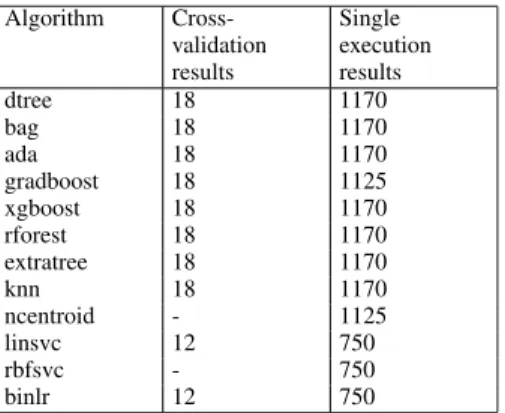
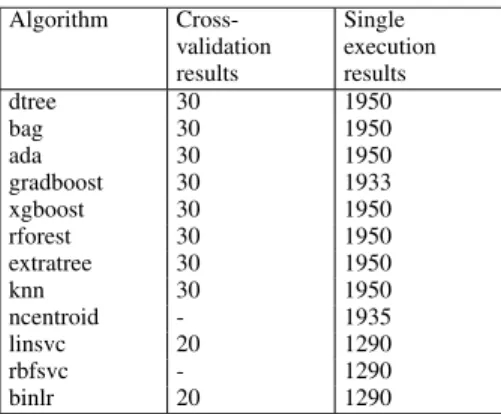
TABLE 3. NSL-KDD: number of files with results collected per algorithm.
• https://gitlab.ilabt.imec.be/lpdhooge/CICIDS2017 • https://gitlab.ilabt.imec.be/lpdhooge/cicids2018 It is highly recommended to use the interactive plots when reading the article. Information on how to run the visualiza-tion is included on the homepages of the repositories.
B. NSL-KDD
The most heavily studied dataset NSL-KDD has been included to establish a clear first reference point. Table 3 shows the number of collected files for each of the algo-rithms. NSL-KDD has been evaluated as 1 day, with 3 types of scaling (2 for linsvc, rbfsvc and binlr), 13 vertical reduction test points and 5 horizontal reduction test points.
Multiplication yields the single execution results indicated in the table without exception.
1) TREE-BASED METHODS
Starting off with a single decision tree, the results already reveal several things. All metrics plateau high (~99%) fairly early (between 10% & 20% of data used for training). The choice of how to scale features in preprocessing has a clear, visible impact. No feature scaling squeezes all metrics together tightly, standardization introduces a minor spread (< 1%), but MinMax scaling results show less stability and a spread of up to 3% within the same metric. Adding in training percentages of 1- and 5 thousands of the data was a great idea, because the reliability of the classifier drasti-cally (~10%) drops in this region, compared to the plateau. Removing the most discriminative features in a step-wise manner increases the spread between the metrics. This is true regardless of scaling, but more pronounced for MinMax scal-ing, because it was less stable to begin with. The metric that suffers most from this horizontal reduction is recall. Precision stays relatively high, but as it is now measured on a smaller pool of recognized samples, an observer should look at the F1-score to keep the overview. The total impact of horizontal reduction on classification performance was noticeable, but less severe than expected with a maximal reduction of around 5% (plateau region). The metrics break away most from each other when going from the removal of the best 9 to the 12 best
features. When using 40% to 50% of the dataset to train, slight signs of overfitting could show up, with a decline on all metrics.
Introducing the first meta-estimator, the bagging classifier applied on decision trees had few interesting outcomes. Nei-ther the absolute performance, nor the spread of the metrics when faced with either type of reduction moved much. The required amount of training data to make the classifier plateau remains between 10 and 20 percent. The most interesting conclusion is the new irrelevance of scaling method. MinMax scaling is as stable as the other two forms and even groups tighter than using No scaling with a bare decision tree.
When using adaboost as a classifier, the absolute per-formance moves up slightly towards perfect classification, but not quite reaching it. Vertical reduction has very similar impact, severely degrading performance to under 90%. The method still plateaus in the same region, but the individual metrics fluctuate more in unpredictable ways when increasing the training size. This is not surprising and indicates testing points where the boosting was either more or less successful. A moderately interesting note on the impact of feature scaling is the greater instability when normalizing the features. This could be an issue related to the numerical precision of the fea-tures. Standardization pushes the features into the narrowest range and double precision floating point numbers might have caused the algorithm to optimize on tiny range differences, ultimately settling on a value that is too precise.
A second type of boosted trees, the gradient-boosted trees show the steepest performance increase on the low-end of the amount of data used to train, never dropping below 91% on a single metric, with most of the evaluated metrics between 92 and 95 percent depending on the scaling being applied. The method increases its classification performance faster than any other algorithm, including adaboost. The topping off already occurs around a 5-10% use of training data. Scaling does not affect result stability much when including both hor-izontal and vertical data reduction. Where gradient-boosted trees beat adaboost on the low-end, they suffer from stability issues on the high-end of used training data. Metric results obtained with adaboost stay consistent longer when gradually removing the top-features and under those conditions also plateau around 1% higher than gradient-boosted trees.
Finishing off the list of boosted trees, xgboost reached the highest absolute numbers with metrics closely clustered around 99.5%. Because it is basically gradient-boosted trees with regularization, it is not surprising that it has the same steep increase in classification performance for very low amounts of training data. As with the other methods, a fall in all metrics is observed when going from removing the 9 best features to the 12 best. The other steps in between no reduction and ~25% reduction of features are limited.
Moving towards trees with more built-in randomization shows the strength of these methods. Random forests, essen-tially a bagging classifier with random feature subsets to build individual trees also get consistent metrics above 99% in the stable zone, reaching stability with just 5-10% of the
data available for training, regardless of the scaling applied. This strength carries on when removing features, but ulti-mately breaks down sooner than the boosted trees. Regardless of scaling, this method averages 98% when removing the most discriminative 9/41 features, falling further to around 96-96.5% when removing the 12 best. These results are very similar to the regular bagging classifier, but the random forests have less per metric spread for the tested data points. Boosted methods reach somewhat higher scores and show much less variance in the metrics when including the best features, but this situation reverses when the best features are removed.
Increasing the influence of randomness further with extra-trees shows a couple of things. It does not reach the best results of boosted trees, but it comes ever so close. What’s more interesting is the consistency of this method. Random forests get somewhat better metric scores, but extratrees reduce the variance between metrics further than any method. Mixing this with the fact that they are computationally very cheap, makes them stand out.
2) NEIGHBOR METHODS
Arguably one of the simplest classifiers, k-nearest neighbors levels around 99% on all metrics in the plateau zone with-out reducing features. This plateau is reached when using approximately 20% of the data available for training. For this method training is nothing more than adding the data points to a data structure that is more suited for neighbor search than the brute-force way. So when only part of the data is considered for training this directly translates into a sampling. What is interesting about this is the performance. Knn is an expensive algorithm, but only taking around 8% of the data and testing on the 92% unseen data points gives classification metrics stably upwards of 98%. There is one caveat to this method and that’s the instability when taking out the best features. Scaling the features exacerbates this issue, with wild (~10%) drops and surges in metric scores. Not applying scaling suffers considerably less from this issue. When exposed to high amounts of training data, the run time of this method rises much faster than that of the tree-based methods. These shortcomings should alert users that this classifier can be used as the first in a chain, but only if given a small sample to compare new data points.
The nearest centroid classifier proves too simple to be practically useful. The recall tends to be very low at around 70% in the stable zone. Stability is already reached after using five or more percent of the data to train on. Of those 70% recognized as malicious in 99% of the cases this was an accurate statement (MinMax and Z scaling). Interestingly, not scaling the features swaps these conclusions, with recall around 95% and precision now at only 73%. Even taking the top-3 features out deteriorates the recall to less than 60%. Not scaling the features keeps the same scores until removing the best 9 or more features. At that point recall and precision act like they did with standardization or minmax scaling. Something that can be observed regardless of scaling and
reduction is the stability of the metrics. They are closer to a flat line than any other classifier. Without scaling, this method is stable even with a mere 1% of the data used to train. The word training should again be viewed very lightly, calculating the center of each class in the training set can hardly be seen as real training. This simplicity has a major upside and that’s the computational efficiency. Testing is done in O(1), making this blaze through the data. Combining this classifier to select the samples for further testing, with a more potent classifier would give great results.
3) OTHER METHODS
An SVM with a linear kernel is not a very suitable method. While it does reach stability, recall sits around 92%, which is much lower than previous methods. Taking the best-performing features out only reduces this to 90-91%, but introduces more instability in the results. Stability is reached with 1-5% of data used for training which is good and the inter-metric spread is less than for that for the ncentroid classifier, but worse than of knn and the tree-based methods. An SVM with a radial basis function in the kernel gets better results, clustering metrics around 97%, but only when using standardization as scaling method. This clustering gets wider as soon as the best features start to get removed. Both types of scaling yield results pretty much invariant to the amount of training data after using 10+% when not reduc-ing features aggressively and around 20+% with horizontal reduction. Absolute numbers drop when removing the best features, but not by much (1-2% drop). This method does not scale well into large sample sizes, which is an additional factor holding it back.
The final classifier, a logistic regression suffers similarly. Recall does not get higher than 92% even without feature removal. Removing features does not affect the metrics much, but it does introduce some instability. This happens regard-less of scaling. Like the linear support vector machine, this method would seem to be too simple, because the data is not well-separable in the ways that these classifiers try to find. A noise issue probably also hurts these classifiers. Feature reduction in the conventional direction would benefit these methods.
4) INTERMEDIATE CONCLUSIONS
Tree-based methods take the cake when it comes to raw performance metrics, with boosted trees scoring best overall, but methods that include (extreme) randomization come close at lower computational costs. Neighbor-based methods would not be recommended as standalone classifiers, but under the right circumstances they can be used as effective steps in a pipeline or ensemble. The scaling choice during prepro-cessing can make a difference, sometimes in unexpected directions so it should not be overlooked. The results of some methods converge with very little data (e.g. 1%), while the majority did need between 5 and 15 percent of the data to reach stability. This is an interesting finding for researchers who want to improve the time requirements for intrusion
detection systems. Given the splitting method a more pre-cipitous drop in classification performance was expected. This is true when using less than one percent of the data to train (and the other 99+% to test), but it is not true when using even slightly more. Removing the features that could be considered most discriminative according to the method described in paragraphIII-D2, did reduce metric scores as expected, but infrequently by more than 10% even with the 25% best features removed. It does increase the inter-metric spread and sometimes affects the stability of the classifiers. Overall the effect is less catastrophic than expected, leading to the conclusion that there is real structural difference between benign and malign traffic embedded in the dataset which the methods are able to learn.
C. ISCXIDS2012
Originated at the same research institute as NSL-KDD and aimed at improving on its shortcomings, ISCXIDS2012 tries to set a standard for intrusion detection datasets with full, labeled captures of diverse normal and malicious traffic. As described in sectionIII-B2 this dataset contains 6 days of traffic with malicious activity. Similarly to NSL-KDD, 3 types of scaling (2 for linsvc, rbfsvc and binlr), 13 ver-tical reduction test points and 5 horizontal reduction test points were used. Multiplication yields the results indicated the table, but exceptions exist. For some classifiers files are missing due to errors in execution because at very low (per class) sampling rates no instances of malicious flows could be included. The sampling strategy was purposefully not adapted so as to not skew the results. Whereas one would expect all classifiers to fail during execution at such low sampling rates, this is not the case. After investigating this it was clear that whether they fail or not is dependent on the implementation. E.g. gradient-boosting trees fail during execution when starting the boosting procedure, but regular decision trees complete normally because they deliver a tree consisting only of a root node and do no further processing. The separation of the data into different days containing different types of attacks opens up the ability to assess how the methods differ for the available types of malicious traffic. This extra dimension will be covered when discussing the results, but day 2 with only 11 malicious samples (as tallied up in table1) will not be considered. A second noteworthy comment before the result presentation, is the reduced valid-ity of plain accuracy as a metric. NSL-KDD is well-balanced in terms of representation for attack and non-attack traffic. ISCXIDS2012 and the other new datasets are not. They show a heavy preponderance of non-attack traffic, much more akin to a real network. Standard accuracy does not factor in this class imbalance, therefore its values can be dismissed in favor of balanced accuracy (which was also reported for NSL-KDD).
1) TREE-BASED METHODS
A single regular decision tree almost reaches perfect classi-fication (99+%), but for some classes this requires 30% or
TABLE 4. ISCXIDS2012: number of files with results collected per algorithm.
more of the data to train on. Moreover there are issues with the stability of the metric spread. Scaling affects the spread between the metrics. Standardizing the features provided the tightest clustering of metrics north of 99.5% after plateauing. Reducing the features, drastically reduces efficacy for some classes when using minmax scaling, with standardization and not scaling being far less affected. Reducing the amount of features to learn by the maximum amount leaves only 11 fea-tures. Still performance plateaus above 98% under almost all conditions. Very rarely a spike in the metric scores was observed.
The bagging classifier based on decision trees achieves its theoretical goal of reducing the variance of decision trees. Scaling becomes irrelevant and while the absolute perfor-mance only receives a very slight bump upwards, the inter-metric spread is visibly reduced. The inter-metrics’ peak lies above 99.9%. For feature-reduced data, the performance often gains half a percent compared to decision trees. Convergence to the plateau typically happens when using 15% of the data or more as training samples.
For attack classes where the curve of the classification metrics isn’t too steep, adaboost steepens it. Even when given only 5 thousandths of the samples to train, metric scores above 95% are the norm. The faster convergence and clas-sification improvement does come at a cost. Stability of the results when exposed to higher levels of training data isn’t always as good as the bagging classifier or plain decision trees. The algorithm overshoots its target by tailoring too much to the misclassified samples, repositioning the splitting points and / or tree-layout to a point where they are less globally optimal. For methods where there was still some headroom after removing the features, adaboost takes some of that. Adaboost’s most useful property is its resilience and stability in the face of aggressive feature reduction. Regard-less of scaling, the metrics cluster together more, at higher scores and earlier than other methods.
Gradient-boosted trees, another boosting strategy has worse results, especially when it comes to recall at low levels of training data. It does not always lead to faster conver-gence, nor are the levels at which it converges higher than those of adaboost. What’s more disconcerting are the random
downward spikes on the precision metric. They are unpre-dictable and quite severe (dipping as low as 65%). Reducing features doesn’t reliably increase the number or the scale of these dips. They occur at different points of volume of the dataset used for training.
The undisputed winners in classification are extreme gradient-boosted trees. They stably converge regardless of scaling, typically with 10% of data used for training. They show no sudden downward spikes and give consistent, extremely high classification metric scores. The robustness of xgboost against the feature reduction is remarkable, with all metrics staying above 99.5% on all classes except infiltration (where it stays above 97.5%).
Random forests show very similar performance to the results obtained on NSL-KDD, reaching very high numbers and level off after using only 5-10% of the data for training. Weirdly enough the usable days containing brute force attacks (day 3 & 4) are the easiest to classify for all methods, yet the random forest classifier with standardization of the features levels off early at 88% precision. This anomaly stays when reducing features. Overall, removing the best features has clear negative impact on the classification. It stays stable, but metric scores easily drop 5% across the board.
Extratrees, like xgboost score incredibly well. Bruteforce attacks are recognized with all metrics above 99.6% even with just a thousandth of the samples to train from (Z-scaling). In more general terms scaling can be disregarded, because all scenarios reach metrics in the upper half between 99 and 100%. This plateau is reached with just one to five percent of training data. Heavily reducing the features, breaks down per-formance by maximally 2% invariant to scaling (with a single exception for DDoS traffic (Day 1) with MinMax scaling). Adding the favorable run time complexity of extratrees, this classifier is a serious contender for best-overall choice.
2) NEIGHBOR METHODS
Despite its simplicity, nearest neighbor search continues to perform very well, with metrics above and beyond 99% con-sistently for all scenarios. As was the case with NSL-KDD, not applying scaling clusters the metrics even more because of the higher outlier impact in the calculation. This method reaches stability quickly, most often with a mere 5% of data available during training. Removing the best features has a peculiar effect on the recognition of brute-force attacks, mak-ing classification rates stably higher on all metrics, in many cases moving to perfect classification. This is impressive, given that at this point only 11 flow-features are available. Recognizing the DDoS instances does worsen when reducing features, but this effect is dependent on the type of scaling used and not predictable. (e.g. MinMax scaling loses substan-tially when removing the top 2 and 3 features, but jumps back up when removing the top 4, no similar effect was found with the other types of scaling.)
The nearest centroid classifier continues to be surprising in that it obtains perfect recall on all classes (except infiltration 98%+) with very little training data, regardless of scaling.
The corresponding precision rules it out in terms of having predictive validity as a single classifier for attack traffic, but it has ROC-AUC scores in the 90% range indicating that a good separation between the classes exists. Paired with the sub-second performance of this classifier even on files of several hundred megabytes, it is hands-down the best quick-and-dirty classifier. Adding to this success is the fact that these rates are already observed with minimal training data and that they stay stable when increasing the amount. This conclusion holds even when reducing features.
3) OTHER METHODS
A linear-kernel SVM has a story akin to the nearest centroid classifier. It performs really well in terms of recall on all classes, but the precision is a mixed bag with only brute force attacks being recognized at a practically applicable rate. Whether standardization or minmax scaling is employed is irrelevant. This method takes at least 5% of the data to train to get useful results. Taking the best features out does reduce performance slightly and introduces some instability, but the effects don’t make classification all that worse. Overall results of this classifier are underwhelming.
Changing the kernel to a radial basis function greatly improves precision on the other classes with HTTP-DoS and DDoS upwards of 85% and infiltration hovering around 98%. It is certainly worth pointing out that these numbers only occur if the features were standardized. Minmax scaling does not always converge to these numbers and if it does needs much more training data. Luckily with Z-scaling the numbers are gotten with just 5+% of data used for training, which kept execution time under a minute. Reducing features maximally decreases performance by ~15%, on the classes for which this classifier had gained performance compared to the linear SVM. The drop in classification happens pretty fast (in terms of training data used) and stays stable.
Finally, the logistic regression shows results very similar to the linear SVM, with good results only in recognizing brute force attacks. Similarly to the RBF-SVM, minmax scaling will plateau but takes more data to get there compared to stan-dardizing the features which will plateau much faster. Reduc-ing the features, reduces the metric scores, often by 10%. The only redeeming quality is the execution speed.
4) INTERMEDIATE CONCLUSIONS
Referring back to sectionIV-B4is very appropriate because the conclusions outlined there hold up for ISCXIDS2012. Tree-based methods are clear winners when it comes to clas-sification metrics, with meta-estimators improving stability and (with very few exceptions) abstract over the scaling choice. Extreme gradient-boosted trees have the overall high-est scores, but are very closely followed by extratrees, that put less computational demand on the system. A classic two thirds one third train-test split is overkill, because stability is reached most often with just 5-15% of the samples used for training. The similarity between the intermediate conclu-sions between NSL-KDD and ISCXIDS2012 is remarkable,
TABLE 5.CICIDS2017: number of files with results collected per algorithm.
because the underlying experiments that collected the data were conducted in different environments with more than a decade between them.
D. CICIDS2017
ISCXIDS2012 was a stepping stone for a bigger experiment with more diverse attack and baseline data as well as a new flow reconstructing tool for the raw pcap files that calculates more than 80 traffic features. The data consists of seven days, each embedding a different class of attack traffic. Results on the infiltration class (day 3 in my results) were collected, but should be disregarded because a positive sample count of only 36 is not substantial enough to draw conclusions from. The granularity with which results have been collected on CICIDS2017 is three times higher than that of the other data sets, collecting at 35 data points between 0.1 and 33 percent of samples used in training. A tiny amount of results could not be collected, because the train-test splits at very low sampling rates did not contain positive samples. Data was deliberately collected at more points to get a higher resolution image of the situation at sampling rates between 1 and 10 percent.
1) TREE-BASED METHODS
Increasing the tested points for training volume immediately shows the expected results. If improvement in metric scores happens, it does so when using training data between 1 and 10 percent of the full set and it happens in a step-wise upward motion. Single decision trees have a mixed set of results. Discovery of brute-force attacks has multiple, severe downward spikes in classification performance, but only if the features undergo a form of scaling. The other classes show much cleaner results with steep rises up to 5% of data used for training, levelling off afterwards. It should be mentioned that the points at which this method levels off are not equal for all classes. Recognition of web attacks, brute force attacks and botnet traffic reach an F1-score around 0.9, but Dos, DDoS and port scanning are pretty much perfectly classified (F1 > 99.99%). Scaling choices can impact this: e.g. No scal-ing diminishes the F1-score on DDoS traffic by 10% to 0.9. Feature reduction trashes classification performance for the
FTP-SSH brute force traffic with recall now consistently at the low point of the aforementioned downward spikes (0% recall). Curiously this effect only happens when the features underwent a scaling operation. Removing the same amount of features, on non-scaled data creates losses of up to 20% on a single metric, but still reaches an F1-score of 87%. This peculiarity is highlighted to show the potentially massive impact of preprocessing choices. Overall, the reduction of features has a big impact on performance for botnet and web attack traffic (~20%), a small impact for HTTP-DoS attacks and no discernable impact for port scanning or DDoS traffic. The first issue solved by the bagging classifier are the dips when classifying ftp-ssh brute force traffic. Scaling becomes irrelevant and reducing the features drops classification from near perfect to 87% (F1). Web attacks and botnet traffic are more stably recognized. Changes in classification per-formance for DDoS and port scanning traffic happen at the fourth decimal point between 99.8 and 1.00 on all metrics (regardless of feature reduction). Feature reduction substan-tially lowers classification rates on web attacks and http-DoS attacks levelling off on a lower plateau and taking more training data to reach that plateau.
As with previous datasets, adaboost pushes the metrics up in the low training volume range, leading to faster conver-gence with less data, but not necessarily as stable as other methods. In terms of absolute classification performance it does not score better than the bagging classifier. Adaboost abstracts over the scaling choice. Taking the best 20 features out, yields results indistinguishable from the bagging classi-fier. It substantially lowers performance on the recognition of web attacks and http-DoS traffic, while leaving recognition of port scanning and DDoS traffic intact.
Gradient-boosted trees (scikit-learn implementation [27]) had very comparable results to the adaboost classifier, trading back and forth when it came to classification metrics and convergence. This comes with a major caveat and that’s the reappearance of downward spikes on the classification metrics. The occurrence of these spikes is not predictable and can happen with any type of scaling. It can only be said that removing features increases the likelihood. The inconsistent behavior, paired with only similar classification scores dis-qualifies this method as a usable classifier.
XGboost, employing the same boosting strategy as the gradient boosting trees now showed the same defect. Harsh downward spikes in classification performance can reduce recall to 0 (most intensely when using Z-scaling on the web attack traffic (day 2)). Curiously this doesn’t happen when using no scaling, raising the possibility that squeezing the feature values together tightly through standardization is not appropriate for these boosting algorithms. The results aren’t as stellar as they were on ISCXIDS2012, showing resistance to feature reduction that is only as good as it is for adaboost or gradient-boosted trees and reaching no higher classification scores.
Random forests need more data to converge a plateau than the methods that employ boosting. Similarly to
ISCXIDS2012, it has issues with the brute force traffic, lev-elling off at just 80% precision (100% recall) whereas the boosting methods reach perfect classification. Performance on HTTP-DoS, DDoS and port scanning traffic is in line with the boosting methods, reaching perfect classification. F1-scores on web attacks and botnet traffic reach 95+% and 90+% respectively. Even just removing the top 5 features totally trashes recognition of brute force attacks to a stable 0%, indicating that the variation in the data that allowed classification only existed in the five best features. Perfor-mance drops of 15-20% were observed on the classification of web attack and botnet traffic. Similarly to previous meth-ods HTTP-DoS, DDoS and port scanning are (almost) not impacted even by the most aggressive feature and training volume reduction.
Randomized decision trees take the crown for CICIDS2017, reaching close to perfect scores on all metrics for all classes (except botnet) and independently of scaling choice with no random breakdowns. The curves all have a steep slope often plateauing with as little as 3-5% of data used during training. The computational efficiency of this method is an extra plus. The only downside to this method is that its performance takes a heavy hit when aggressively removing the top performers from the available feature set. The DoS-and port scanning attack types are not heavily impacted by feature reduction, but all other classes are.
2) NEIGHBOR METHODS
Nearest neighbor search can converge to the same levels as some tree-bases methods, but to do that it takes more data and the metrics are less well-clustered. All classes are well-recognized except for botnet traffic. This conclusion holds regardless of scaling, but breaks down severely when facing aggressive removal of the best features. Classification of FTP-SSH brute force attacks is worse by up to 15%. Recognition of HTTP-DoS traffic shows multiple 10% loss spikes. DDoS and port scanning (days 5 & 6) are almost unaf-fected by feature removal. The overall variability between the results should dissuade researchers from employing this as a single method. Moreover, convergence is slower than for tree-based methods, which is an extra complication because knn scales poorly.
The nearest centroid classifier was characterized by wicked fast convergence and no variation in metric score by increas-ing the amount of data to train from. This claim is further solidified by the results on CICIDS2017 with lines that are often just horizontal. The downside is that the values where it flatlines are most often useless, with two noteworthy excep-tions: port scanning and botnet traffic (Z-scaling). Recall sits at 100% after using 5% or less of the data as training samples. When also taking feature reduction into account, it can be said that this perfect recall stays as long as the features are stan-dardized and more than 5% of the data is used to train. Port scanning traffic is so resistant that neither feature reduction (horizontal or vertical) nor scaling has any impact. The ease of this classifier, both conceptually as computationally makes
it a good candidate for a defensive measure in networks with many connected devices. It can easily spot if machines are being used as slaves in a botnet or as proxies to scan other hosts.
3) OTHER METHODS
A linear kernel SVM has good overall performance for the DoS and port scanning attack classes, but not quite as good as earlier classifiers. It is unusable for any other class because it has very high to perfect recall but very poor to fair precision. The only upside is that the computational efficiency of this method can be leveraged to get a rough first-pass over a large set of flows, making a selection that will include the malicious traffic. The high recall stays stable even at very low volumes of data used for training and after removing the 20 best features. Precision drops further under these conditions. The choice of scaling is unimportant.
An RBF-kernel SVM reaches better overall metrics than its linear kernel counterpart, but not to the degree that it could be considered when comparing it to the tree-based methods. It does not have the computational efficiency that the linear SVM has so the improvements in metric scores are less useful. The feature reduction hurts performance, but not in an unpredictable manner. Recall stays close to perfection while precision drops.
The results for the logistic regression look very akin to those for the linear support vector machine. Both methods do converge with particularly high recall but poor precision. As a standalone classifier the results aren’t usable (except for port scanning & DDoS). Heavy feature reduction creates minor losses in terms of recall. The choice of scaling is again unimportant.
4) INTERMEDIATE CONCLUSIONS
CICIDS2017 rests on a bigger experimental setup than ISCXIDS2012, resulting in larger captures with more classes of attack traffic and more diversified baseline traffic. The analysis reveals that this dataset contains 3-5 easy classes depending on the used classifier. The three easiest classes for all methods were DDoS, port scanning and HTTP-DoS traffic. On these, perfect classification even with serious reductions in data available to learn from and removal of the best features is a real outcome. The days containing FTP-SSH brute force traffic, web attacks and botnet traffic prove to be more difficult to recognize, especially when reducing the set of features to learn from. The singular day containing infiltration traffic is not usable, because it only has 36 positive samples on a total 288602 that day. The most recommended method is a randomized decision trees classifier. These obtain classification results that would justify their use in real appli-cations. Extreme gradient boosted trees and adaboost are similarly potent classifiers, but they are more fragile, require more tuning and quality control. Resistance against reduc-tions in training volume was very impressive with the usable methods reaching stability with just 3-10% of the data as training samples. Horizontal data reduction has more impact,
TABLE 6.CICIDS2018: number of files with results collected per algorithm.
reducing classification performance for the harder classes. Increasing the granularity with which results have been col-lected has shown that a smooth transition happens in the 1-10% range in terms of training data used. Additionally it shows that the (sometimes perfect) classification scores are no fluke.
E. CICIDS2018
CICIDS2018, the next iteration from the CIC moved the infrastructure to Amazon Web Services, expanding the scale of the experiment, with 5 user clusters of each 20-100 hosts (Windows / Ubuntu mix), a server cluster with file-, email-and appservers email-and domain controller email-and an external attacker network with 50 machines. This scale increase ultimately led to 10 days containing attack traffic, totalling 3.2 GB of CSV-files (compared to 2.3 GB for CICIDS2017). The rest of the experiment was unchanged. A very small proportion of results could not be collected, because the amount of available training samples was too low when paired with sampling rates of 0.1% & 0.5%.
1) TREE-BASED METHODS
It is immediately apparent that certain classes are easier than others. Brute force, Dos, DDoS and botnet traffic are very well represented in the dataset, leading to extremely high rates (99.5+% on all metrics) of classification even at a stratified sampling rate of just 0.1% to train on. Once more it should be restated that these results are extra impressive because the remaining 99.9% of the data was used for testing. Even at the most aggressive feature reduction settings the classification scores don’t drop precipitously. The resistance against feature reduction works best if the features were not scaled beforehand. Results on the two remaining classes tell a different story. Web attacks are underrepresented in CICIDS2018 with just 362 out of 1048575 samples on day 5 and 566 out of 1048575 samples on day 6. Consequently results aren’t as good as they are on classes with lots of positive samples. Ultimately densely clustered scores around an F1-score of 98.3% were observed, but this required a sampling rate of 50%. Reducing the sample rate to 20%,
reduces this score to around 90%, which can still be consid-ered acceptable. The oddball in classification is infiltration traffic (days 7 and 8). While it is very well represented with positive sample counts well into the 5-digit range, classifica-tion proved hard. Classificaclassifica-tion results for day 7 are worthless with recall hovering around 0%. This is offset by the results on day 8 where recall moves to 97.5%, but precision stays relatively low around 80% irrespective of the amount of data given to train on.
The bagging classifier built on decision trees smooths the curves. These now resemble the expected upward trend more clearly. Classification metrics now level out slightly higher and more stably for the web and infiltration attack classes. A side-effect of using multiple trees is the increased difficulty in reaching perfect (1.0) classification scores. This trade-off is worth it because the bottom gets lifted much higher than the top gets lowered. Heavily reducing features only has a distinct impact on the attack types that already proved hard to classify.
Adaboost does what it did in all previous datasets. At very small sampling rates it pushes the metrics higher to an earlier point of stability. At larger sampling rates it still tends to improve classification performance, but only slightly. It abstracts over the scaling choice during preprocessing. For the easy classes a reduction in the amount of features available for use is barely noticeable, amounting to a max-imum reduction of 1% in classification scores. Even more importantly is that this reduction happens gradually in tandem with the amount of features removed. The difficult classes take a major hit from even removing the 5 most discriminative features, reducing recall by up to 50%.
Gradient boosted trees perform similar to adaboost. It does behave more erratically. This is very obvious when looking at the web attack classification. The results fall in such wide margins, untethered from the volume of data used during training. In terms of stability at the high-end it goes back and forth with adaboost. Stability is often found with just 5% of the data used to train, keeping in line with adaboost’s results. XGboost includes web attack traffic in the list of malicious classes that it recognizes well. This leaves only infiltration as the hard class. The curves for the classification metrics don’t contain anomalies. Convergence on the easy classes happens with as little as 1% of data used during training and the point to which it converges is indistinguishable from perfect classification. Removing the 5 most discriminative features kicks web attack traffic back into the hard to classify category and demolishes performance on infiltration traffic. Computationally it was faster than the other methods that employ boosting.
Random forests improve on XGboost by converging as fast, regardless of scaling to similarly high, stable levels on all easy classes. Furthermore it was as proficient at recognizing the web attack traffic as xgboost. On top of that it performed well on one of the days (8) containing infiltration traffic with recall up to 94.5% and precision up to 90%. This leaves day 7 as the singular scenario that has not had a sufficiently good
solution from any of the algorithms. Interestingly a downward trend in the metrics on day 7 has been observed in all methods that had smooth lines. This continues with the random forests. The documentation of the dataset mentions that unrestricted file upload is part of the infiltration scenario. When exposed to higher levels of data to train on, it might include many of these file upload samples. It is no stretch to imagine that illegitimate file upload traffic is very hard to distinguish from legitimate file upload at the network level. Removing the top features has a bigger impact on random forests than it had on the boosting classifiers with a larger inter-metric spread and slightly lower plateau. Random forests should still be seriously considered, because they are very parallelizable and without feature reduction hold the record for highest amount of attack classes properly identified.
Randomized decision trees don’t improve on any of the best classifiers so far. They introduce slightly more variation in the scores around which metrics converge. Random inter-section points in the nodes prove inadequate compared to the standard algorithm to keep classifying days 6 & 8 well. It does have one thing that is absent from the other classifiers and that is a remarkable resistance against removing the best features. Whereas random forests suffered badly from this procedure on the hard days it had gained control over (6 & 8), this is not the case for the extratree classifier. As one of the most inexpensive classifiers this method keeps proving its worth as a classifier that is viable even as a single source of information for the intrusion detection system.
2) NEIGHBOR METHODS
K-nearest neighbors holds its own often requiring more data than tree-based classifiers but still getting to the same clas-sification scores. It only leaves infiltration (day 7) as largely misclassified, tying it to random forests in terms of number of properly classified scenarios. Removing the most dis-criminative features hurts this classifier more than it hurts other methods because it lowers the variance in the distances between samples. This shortcoming is most visible on the easy classes where tree-based features often stay invariant to feature reduction. These side marks and the computational complexity of knn, rule it out as a viable method.
The nearest centroids classifier is only interesting in so far that when no scaling is applied it has great recall on the DDoS and botnet classes. It keeps these results independently of the amount of data used to train or the amount of features reduced. Layer-7 based DoS has more mixed results and the classifier is not worth considering in all other scenarios.
3) OTHER METHODS
A linear kernel support vector machine has no issues on the easy classes. These are well-recognized with little data to learn from (5%). Aggressive feature reduction can reduce the overall performance, but the recall stays intact. This very high recall even under serious constraints is present on the harder web traffic class. This method is too simple to divide the samples of infiltration traffic.
Changing the kernel to a radial basis function yields the same results. This method could realistically be used to clas-sify the easy classes. By far the most interesting finding is the recall score on the toughest day (7) to classify. When given 20% of that day’s data as training samples, recall reaches 90%. Adding to this is that this metric only degrades gradually when removing features, stranding at 70% when reducing the top-20 features.
A logistic regression doesn’t add interesting conclusions. It performs very well on the classes for which the other meth-ods performed equally well. It is reasonably computationally efficient, justifying keeping it around as a first pass classifier.
4) INTERMEDIATE CONCLUSIONS
CICIDS2018 increases the size of the experiment setup while moving it to Amazon Web Services, resulting in even larger capture files. Of the roughly six available classes of attack traffic, four are easy to classify (FTP-SSH brute force, HTTP-DoS, DDoS and botnet). By easy it is meant that even at very low volumes of training data (1-5%), perfect classifi-cation is achieved (99.995+%). Additionally the easy classes remain very well-recognized even when removing the most discriminative 25% of the available features. The tree-based classifiers remain the most powerful with extreme gradient boosted trees and random forests leading the pack. These two move classification of web attack and a single day of intrusion traffic into the realm of practically usable methods. Nearest centroids, linear SVMs and logistic regressions are too simple as a single classifier but they all share very high to perfect recall. Combined with the computational efficiency (certainly of nearest centroids) these methods can be so called first-pass methods, making a relevant selection of the attack traffic. CICIDS2018 addressed the serious shortage of intrusion traf-fic samples in CICIDS2017. The quality of this improvement is still up for debate because it included unrestricted file upload as intrusion traffic while this might be indistinguish-able at the network level from legitimate file upload. This hypothesis is supported by the fact that for multiple methods classification performance gradually worsens (with volume provided for training) on one of the days containing intrusion traffic. Conversely CICIDS2017 contained more than twice the amount of web attack traffic samples. Given that for each positive sample of this class well over 1500 other included samples were baseline traffic, the results can still be good (albeit for the best 2 classifiers without feature reduction).
V. CONCLUSION
This work details classification with supervised machine learning methods on network intrusion detection data under increasingly difficult conditions, through evaluation on public data sets that cover 20 years of data generation in the field. Based on the dataset-specific conclusions in paragraphs IV-B4,IV-C4,IV-D4 and IV-E4, multiple overarching conclusions can be formulated. Tree-based meta-estimators win on absolute metrics for all datasets. Perfect or borderline perfect classification (99+%) is no
exception for these methods. More impressively these fig-ures are obtained with very limited access to training data. Convergence almost invariably happens with between 5 and 15 percent of the dataset used to train. Some extreme cases with lots of representation in the data converge with just 1% or less. Resistance against removing the most discriminative features from the data varies between attack classes. Classes with clear network footprints DoS, DDoS, port scanning, brute force, botnet are less (sometimes not at all) impacted, because the remaining features still contain enough informa-tion. Other classes such as infiltration or web attack traffic are more heavily impacted by either form of data reduction. Sometimes this is due to underrepresentation in the datasets, leaving room for improvement in future iterations.
VI. FUTURE WORK AND HYPOTHESES
Two routes of further inquiry have been set up in this work. First, the comparative nature of this work has revealed clear winners and methods that can be useful under the right cir-cumstances. An intrusion detection system that builds on this knowledge that is capable of working in real-time would be of obvious benefit. Second, the collection of exported models will be used to test how well they generalize. As the penultimate requirement of any AI system getting an answer to the question whether meaningful patterns are uncovered through supervised machine learning for intrusion detection is vital.
APPENDIX
As mentioned in subsectionIV-A, 48 interactive visualiza-tions are available to be used alongside the article. To avoid cluttering the text, a single still of one of the 48 visualizations has been included in the text itself (figure IV-A). All result data and the visualization code is available publicly per dataset at the following locations:
• https://gitlab.ilabt.imec.be/lpdhooge/nslkdd • https://gitlab.ilabt.imec.be/lpdhooge/iscxids2012 • https://gitlab.ilabt.imec.be/lpdhooge/CICIDS2017 • https://gitlab.ilabt.imec.be/lpdhooge/cicids2018
REFERENCES
[1] D. Denning and P. Neumann. (1985).Requirements Model for Ides— A Real-Time Intrusion-Detection Expert System. [Online]. Available: http://faculty.nps.edu/dedennin/publications/IDESReportSRI1985.pdf [2] M. Roesch, ‘‘Snort: Lightweight intrusion detection for networks,’’Lisa,
vol. 99, pp. 229–238, Jun. 1999.
[3] V. Paxson, ‘‘Bro: A system for detecting network intruders in real-time,’’
Comput. Netw., vol. 31, nos. 23–24, pp. 2435–2463, 1999.
[4] M. Vallentin, R. Sommer, J. Lee, C. Leres, V. Paxson, and B. Tierney, ‘‘The NIDS cluster: Scalable, stateful network intrusion detection on commodity hardware,’’ inRecent Advances in Intrusion Detection, Berlin, Germany: Springer, 2007, pp. 107–126.
[5] G. Liu, W. Quan, N. Cheng, H. Zhang, and S. Yu, ‘‘Efficient DDoS attacks mitigation for stateful forwarding in Internet of Things,’’J. Netw. Comput. Appl., vol. 130, pp. 1–13, Mar. 2019. [Online]. Available: https://doi.org/10.1016/j.jnca.2019.01.006
[6] G. Liu, W. Quan, N. Cheng, K. Wang, and H. Zhang, ‘‘Accuracy or delay? A game in detecting interest flooding attacks,’’Internet Technol. Lett., vol. 1, no. 2, p. e31, 2018.