a Date: 5 September 2002
Origin: European
Latest date for receipt of comments: 2002.11.30
Project no.: 2002/02592Responsible committee: B/526/3 Site investigation and ground testing Interested committees: B/2 B/11 CB/1 B/526
Title: pr EN ISO 22476-2 Geotechnical engineering - Field testing - Part 2: Dynamic probing
Supersession information: If you are aware of a current national standard which may be affected, please notify the secretary (contact details below).
WARNING: THIS IS A DRAFT AND MUST NOT BE REGARDED OR USED AS A BRITISH STANDARD. THIS DRAFT IS NOT CURRENT BEYOND 2002.11.30.
This draft is issued to allow comments from interested parties; all comments will be given consideration prior to publication. No acknowledgement will normally be sent. See overleaf for information on commenting.
No copying is allowed, in any form, without prior written permission from BSI except as permitted under the Copyright, Designs and Patent Act 1988 or for circulation within a nominating organization for briefing purposes. Electronic circulation is limited to dissemination by e-mail within such an organization by committee members.
Further copies of this draft may be purchased from BSI Customer Services, Tel: +44(0) 20 8996 9001 or email
orders@bsi-global.com. British, International and foreign standards are also available from BSI Customer Services. British Standards on CD or Online are available from British Standards Publishing Sales Limited.
Tel: 01344 404409 or email bsonline@techindex.co.uk.
Information on the co-operating organizations represented on the committees referenced above may be obtained from the responsible committee secretary.
Cross-references
The British Standards which implement International or European publications referred to in this draft may be found via the British Standards Online Service on the BSI web site http://www.bsi-global.com.
Direct tel: 0208 996 7228 Responsible Committee Secretary: Mr D I Hyde (BSI)
E-mail: david.hyde@bsi-global.com
Head Office
389 Chiswick High Road London W4 4AL
Telephone: +44(0)20 8996 9000 Fax: +44(0)20 8996 7001
b draft are welcome and will assist in the preparation of the consequent British Standard. If no comments are received to the contrary, then the UK will approve this draft and implement it as a British Standard. Comment is particularly welcome on national, legislative or similar deviations that may be necessary.
Even if this draft standard is not approved by the UK, if it receives the necessary support in Europe, the UK will be obliged to publish the official English Language text unchanged as a British Standard and to withdraw any conflicting standard.
UK Vote
Please indicate whether you consider the UK should submit a negative (with reasons) or positive vote on this draft. Submission
The guidance given below is intended to ensure that all comments receive efficient and appropriate attention by the responsible BSI committee. Annotated drafts are not acceptable and will be rejected.
All comments must be submitted, preferably electronically, to the Responsible Committee Secretary at the address given on the front cover. Comments should be compatible with Version 6.0 or Version 97 of Microsoft® Word for Windows™, if possible; otherwise comments in ASCII text format are acceptable. Any comments not submitted electronically should still adhere to these format requirements.
All comments submitted should be presented as given in the example below. Further information on submitting comments and how to obtain a blank electronic version of a comment form are available from the BSI web site at:
http://www.bsi-global.com/Standards+Development/Drafts/index.xalter Date Document National Committee Clause/ subclause Paragraph/ Figure/ Table Type of comment (General/ technical/editorial)
COMMENTS Proposed change OBSERVATIONS OF THE SECRETARIAT
3.1 1st definition Editorial Definition is ambiguous and needs clarifying.
Amend to read ‘... so that the mains connector to which no connection ...’ 6.4 § 2 Technical The use of the UV
photometer as an alternative cannot be supported as serious problems have been encountered in its use in the UK.
Delete reference to UV photometer.
NORME EUROPÉENNE
EUROPÄISCHE NORM
prEN 22476-2
August 2002 ICS English versionGeotechnical investigation and testing - Field testing - Part 2:
Dynamic probing (ISO/DIS 22476-2:2002)
Reconnaissance et essai géotechnique Essais en place -Partie 2: Essai de pénétration dynamique (ISO/DIS
22476:2002)
Geotechnische Erkundung und Untersuchung -Felduntersuchungen - Teil 2: Rammsondierungen (ISO/DIS
22476-2:2002)
This draft European Standard is submitted to CEN members for parallel enquiry. It has been drawn up by the Technical Committee . If this draft becomes a European Standard, CEN members are bound to comply with the CEN/CENELEC Internal Regulations which stipulate the conditions for giving this European Standard the status of a national standard without any alteration.
This draft European Standard was established by CEN in three official versions (English, French, German). A version in any other language made by translation under the responsibility of a CEN member into its own language and notified to the Management Centre has the same status as the official versions.
CEN members are the national standards bodies of Austria, Belgium, Czech Republic, Denmark, Finland, France, Germany, Greece, Iceland, Ireland, Italy, Luxembourg, Malta, Netherlands, Norway, Portugal, Spain, Sweden, Switzerland and United Kingdom.
Warning : This document is not a European Standard. It is distributed for review and comments. It is subject to change without notice and
shall not be referred to as a European Standard.
EUROPEAN COMMITTEE FOR STANDARDIZATION C O M I T É E U R O P É E N D E N O R M A L I S A T I O N E U R O P Ä I S C H E S K O M I T E E F Ü R N O R M U N G
Management Centre: rue de Stassart, 36 B-1050 Brussels
© 2002 CEN All rights of exploitation in any form and by any means reserved worldwide for CEN national Members.
Contents
1 Scope ...3
2 Normative references ...4
3 Terms and definitions...4
4 Equipment...5
4.1 Cone ...5
4.2 Drive rods ...6
4.3 Anvil ...6
4.4 Torque measuring wrench ...6
4.5 Optional equipment ...7
4.5.1 Blow counter ...7
4.5.2 Penetration length measuring device ...7
4.5.3 Injection system ...7
4.5.4 Apparatus for measuring the dimensions of the cone ...7
4.6 Equipment checks and calibrations ...8
4.7 Driving device...9 5 Test procedure ...9 5.1 Test preparation ...9 5.2 Test execution ...9 5.3 Safety requirements ...10 6 Interpretation of tests ...10 7 Reporting of results ...10 7.1 Field report ...10 7.2 Test report ...11
8 Additional factors influencing the results of dynamic probing ...11
8.1 General...11
8.2 Geotechnical influences...12
8.2.1 Influence of soil type, soil group and soil characteristics ...12
8.2.2 Influence of the groundwater...12
8.3 Equipment influences...12
Annex A (normative) Summary log for dynamic probing ...13
Annex B (normative) Test record for dynamic probing...14
Annex C (informative) Examples for geotechnical and equipment influences on the dynamic probing results ...15
C.1 Examples for results of dynamic probing in coarse-grained soils...15
C.2 Examples for results from dynamic probing in fine-grained soils ...17
C.3 Example for results of dynamic probing in mixed-grained soils...20
C.4 Example for penetration resistance results in shallow depths...21
C.5 Example for the influence of groundwater...22
C.6 Examples for equipment influences ...23
Annex D (informative) Example of a method to measure the actual energy ...26
D.1 Principle ...26
D.2 Equipment...26
D.3 Measurements ...27
D.4 Calculation...27
Annex E (informative) Interpretation of test results by using the dynamic point resistance...29
Foreword
This document (prEN ISO 22476-2) has been prepared by Technical Committee CEN/TC 341, "Geotechnical investigation and testing", the secretariat of which is held by DIN, in collaboration with Technical Committee ISO/TC 182 "Geotechnics".
This document is currently submitted to the parallel Enquiry.
Annexes A and B are normative; annexes C, D and E are informative.
EN ISO 22476 Geotechnical engineering - Field testing has the following parts:
Part 1: Cone and piezocone penetration tests
Part 2: Dynamic probing
Part 3: Standard penetration test
Part 4: Borehole expansion tests
1 Scope
This European standard specifies requirements for indirect investigations of soil by Dynamic Probing within the scope of the geotechnical investigations according to ENV 1997.
This European standard covers the determination of the resistance of soils and soft rocks in situ to the dynamic penetration of a cone. A hammer of a given mass and given falling height is used to drive the cone. The penetration resistance is defined as the number of blows required to drive the penetrometer over a defined distance. A continuous record is provided with respect to depth but no samples are recovered.
Four procedures are included, covering a wide range of specific work per blow:
Dynamic probing light (DPL): test representing the lower end of the mass range of dynamic equipment;
Dynamic probing medium (DPM): test representing the medium mass range of dynamic equipment;
Dynamic probing heavy (DPH): test representing the medium to very heavy mass range of dynamic equipment;
Dynamic probing super heavy (DPSH): test representing the upper end of the mass range of dynamic equipment.
The test results of this European standard are specially suited for the qualitative determination of a soil profile together with direct explorations (e.g. drilling and sampling according to EN ISO 22475) or as a relative comparison of other in situ tests. They may also be used for the determination of the strength and deformation properties of soils, generally of the cohesionless type but also possibly in fine-grained soils, through appropriate correlations. The results can also be used to determine the depth to very dense ground layers indicating the length of end bearing piles, and to detect very loose, voided, backfilled or infilled ground.
2 Normative references
This European Standard incorporates by dated or undated reference, provisions from other publications. These normative references are cited at the appropriate places in the text and the publications are listed hereafter. For dated references, subsequent amendments to or revisions of any of these publications apply to this European Standard only when incorporated in it by amendment or revision. For undated references the latest edition of the publication referred to applies.
EN 1997-1, Eurocode 7: Geotechnical design — Part 1: General Rules.
EN 1997-3, Eurocode 7: Geotechnical design — Part 3: Design assisted by field testing. EN 10204, Metallic products - Types of inspection documents.
EN ISO 22475, Geotechnical engineering – Drilling and sampling methods and groundwater measurements. EN ISO 22476-3, Geotechnical engineering – Field tests – Part 3: Standard Penetration Test.
3 Terms and definitions
For the purpose of this European standard the following terms and definitions apply: 3.1
dynamic penetrometer cone and drive rods 3.2
dynamic probing equipment
penetrometer and all equipment necessary to drive the penetrometer 3.3
anvil or drive head
that portion of the drive-weight assembly that the hammer strikes and through which the hammer energy passes into the drive rods
3.4 cone
pointed probe of standard dimensions used to measure the resistance to penetration (see Figure 1) 3.5
drive rods
rods that connect the drive-weight assembly to the cone 3.6
drive-weight assembly
a device consisting of the hammer, hammer fall guide, the anvil and the drop system 3.7
actual energy EM
energy delivered by the drive-weight assembly into the drive rod immediately below the anvil, as measured. 3.8
theoretical energy ET
energy as calculated for the drive weight assembly,
ET = m·g·h
m is the mass of the hammer
g is the acceleration due to gravity
h is the falling height of the hammer 3.9
energy ratio Er
ratio of the actual energy EM and the theoretical energy ET of the hammer expressed in percentage. 3.10
hammer
that portion of the drive-weight assembly which is successively lifted and dropped to provide the energy that accomplishes the penetration of the cone
3.11 N-values
number of blows required to drive the penetrometer over a defined distance, expressed in centimetres by the corresponding sub-index (N10L, N10M, N10H,N20SA, N20SB)
4 Equipment
4.1 Cone
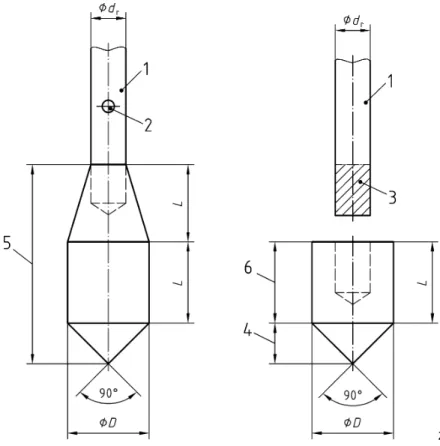
The cone of steel shall have an apex angle of 90° and an upper cylindrical extension mantle and transition to the extension rods as shown in Figure 1 and with the dimensions and tolerances given in Table 1. The cone may be sacrificial (lost) or retained (fixed) for recovery.
zez
Key
1 extension rod
2 injection opening (optional) 3 point mounting
4 cone tip
5 cone
6 mantle
Figure 1 – Alternative forms of cones for dynamic probing (for L, D and dr see Table 1)
4.2 Drive rods
The rod material shall be of a high-strength steel with the appropriate characteristics for the work to be performed without excessive deformations and wear. The rods shall be flush jointed, shall be straight and may have spanner flats. The maximum axial deviation for any one rod shall not exceed 1 mm in 1000, i.e. 1 mm in 1 m. Dimensions and masses of the drive rods are given in Table 1.
Hollow rods should be used; solid rods may be used.
4.3 Anvil
The anvil shall be made of high strength steel. A damper or cushion may be fitted between the hammer and anvil.
4.4 Torque
measuring
wrench
The torque necessary to turn the driving rods is measured by means of a torque wrench. The apparatus shall be able to measure a torque of at least 200 Nm and be graduated to read at least all 5 Nm.
A sensor for recording the torque may be used.
4.5 Optional equipment
4.5.1 Blow counter
A device to count the number of blows of the hammer by measuring mechanical or electric impulses can be placed on the system.
4.5.2 Penetration length measuring device
The penetration length is measured either by counting on a scale on the rods or by recording sensors. In this latter case, resolution shall be better than 1/100 of the measure length.
4.5.3 Injection system The injection system includes:
hollow rods;
a pump with mud connected to a device fixed under the anvil and intended to ensure the filling, of the annular space between the ground and the drive rods created by the enlarged cone.
The flow of the pump is such that it will always ensure that the annular space between the ground and the drive rods is filled.
NOTE 1 Mud, for example, can be a mixture of bentonite and water with a mass relationship between the dry particles and water is 5 % to 10 %.
NOTE 2 The mud circulation towards the surface is not obligatory. The pressure of injection is that corresponding, after deduction of the head losses, to the hydrostatic pressure due to mud on the level of the cone.
A manual pump may be used.
4.5.4 Apparatus for measuring the dimensions of the cone
The measurement of the diameter and length of the cone is made by means of a slide caliper to the 1/10 of mm or by an equivalent system.
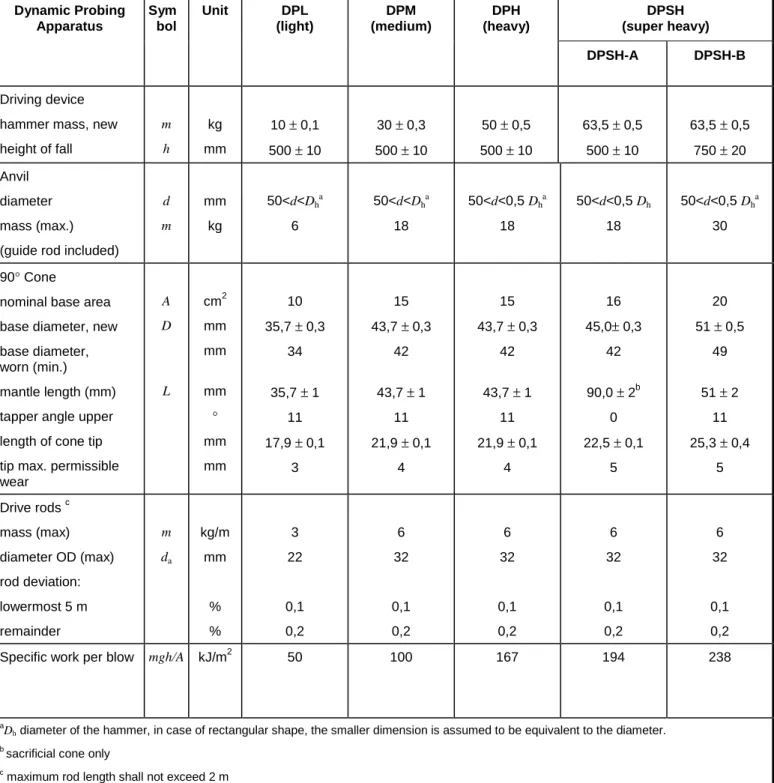
Table 1 — Dimensions and masses for the four types of dynamic probing apparatus DPSH (super heavy) Dynamic Probing Apparatus Sym bol Unit DPL (light) DPM (medium) DPH (heavy) DPSH-A DPSH-B Driving device hammer mass, new height of fall m h kg mm 10 ± 0,1 500 ± 10 30 ± 0,3 500 ± 10 50 ± 0,5 500 ± 10 63,5 ± 0,5 500 ± 10 63,5 ± 0,5 750 ± 20 Anvil diameter mass (max.) (guide rod included)
d m mm kg 50<d<Dha 6 50<d<Dha 18 50<d<0,5 Dha 18 50<d<0,5 Dh 18 50<d<0,5 Dha 30 90° Cone
nominal base area base diameter, new base diameter, worn (min.) mantle length (mm) tapper angle upper length of cone tip tip max. permissible wear A D L cm2 mm mm mm ° mm mm 10 35,7 ± 0,3 34 35,7 ± 1 11 17,9 ± 0,1 3 15 43,7 ± 0,3 42 43,7 ± 1 11 21,9 ± 0,1 4 15 43,7 ± 0,3 42 43,7 ± 1 11 21,9 ± 0,1 4 16 45,0± 0,3 42 90,0 ± 2b 0 22,5 ± 0,1 5 20 51 ± 0,5 49 51 ± 2 11 25,3 ± 0,4 5 Drive rods c mass (max) diameter OD (max) rod deviation: lowermost 5 m remainder m da kg/m mm % % 3 22 0,1 0,2 6 32 0,1 0,2 6 32 0,1 0,2 6 32 0,1 0,2 6 32 0,1 0,2
Specific work per blow mgh/A kJ/m2 50 100 167 194 238
a
Dh diameter of the hammer, in case of rectangular shape, the smaller dimension is assumed to be equivalent to the diameter. b sacrificial cone only
c
maximum rod length shall not exceed 2 m
NOTE Tolerances given are manufacturing tolerances
4.6 Equipment checks and calibrations
Prior to each test, a check of dimensions shall be made to ensure that they are within the values given in Table 1. The straightness of the rods shall be checked once on each new site and at least every 20 penetration tests at that site.
At the test site, the rate of blows, the height of fall, the friction free fall of the hammer, the proper condition of the anvil and the mechanical release devices shall be checked for satisfactory operation which is to be ensured for the whole test series. In addition, the proper functioning of the recording device has to be checked in case automatic recording equipment is used.
The precision of the measuring instruments – if applicable - shall be checked after any damage, overloading or repair but at least once every six months, unless the manufactures specify shorter inspection intervals. Faulty parts shall be replaced. Calibration records shall be kept together with the equipment.
To check pneumatic dynamic penetrometers, the driving energy per impact referred to the cone area shall be measured directly. This shall not deviate from the theoretical value as specified in Table 1 by more than 3 %. Manufacturers of pneumatic dynamic probing equipment shall provide factory certifications as stipulated by EN 10204 together with each unit they supply. The user shall have such penetrometers checked every six months. Energy losses occur e.g. due to friction at the hammer (velocity loss compared to the free fall) or due to energy losses during the hammer impact on the anvil. Therefore also for the free-fall equipment, it is generally recommended to know by calibration the actual energy transmitted to the drive rods. An example for the method to determine the actual energy is given in Annex D.
4.7 Driving device
Dimensions and masses of the components of the driving device are given in Table 1. The following requirements shall be fulfilled:
a) the steel hammer shall be conveniently guided to ensure minimal resistance during the drop;
b) the automatic release mechanism shall ensure a constant free fall, with a negligible speed of the hammer when released and no induced parasitic movements in the drive rods;
c) the steel drive head or anvil should be rigidly connected to the top of the drive rods. A loose connection can be chosen.
5 Test procedure
5.1 Test preparation
In general, dynamic probing is performed from the ground surface; the number of blows N10 or N20 is recorded
continuously.
Dynamic probing test equipment shall be set up with the penetrometer vertical, and in such a way that there will be no displacement during testing. The inclination of the driving mechanism and the driving rod projecting from the ground shall not deviate by more than 2 % from the vertical; in difficult ground conditions deviations up to 5 % may be allows provided that they are reported. If this is not the case, the dynamic probing test shall be started anew. Trailer-mounted dynamic probing test equipment shall be supported in such a way that the suspension travel of the support trailer cannot influence the test. The equipment shall be set up with appropriate clearance from structures, piles, boreholes etc., in order to be certain that they will not influence the result of the dynamic probing test.
When carrying out dynamic probing in situations where the rods are free to move laterally, for instance in surface waters and boreholes, the rods shall be restrained by low-friction supports in order to prevent bowing during driving or when the penetration force is applied.
5.2 Test
execution
The drive rods and the cone shall be driven vertically and without undue bending of the protruding part of the extension rods above the ground.
No load shall be applied to anvil and rods during lifting of the hammer.
The penetrometer shall be continuously driven into the ground. The driving rate shall be kept between 15 and 30 blows per minute, except when known to be penetrating sand and gravel, where the driving rate may be increased up to 60 blows per minute. All interruptions longer than 5 minutes shall be recorded.
The rods shall be rotated 1½ turns at least every 1,0 m and the maximum torque required to turn the rods shall be recorded.
For rotating the rods, a torque measuring wrench or an equivalent torque measuring device shall be used.
To decrease skin friction, drilling mud or water may be injected through horizontal or upwards holes in the hollow rods near the cone. A casing is sometimes used with the same purpose.
The number of blows shall be recorded every 10 cm for the DPL, DPM and DPH and every 20 cm for the DPSH-A and DPSH-B.
The normal range of blows, especially in view of any quantitative interpretation of the test results according to ENV 1997-3 , is between N10 = 3 and 50 for DPL, DPM and DPH and between N20 = 5 and 100 for DPSH-A and
DPSH-B. For specific purposes, these ranges may be exceeded. In cases beyond these ranges, when the penetration resistance is low, e.g. in soft clays, the penetration depth per blow may be recorded. In hard soils or soft rocks, where the penetration resistance is very high, the penetration for a certain number of blows may be recorded.
5.3 Safety requirements
National safety regulations shall be followed; e. g. regulations for:
personal health- and safety equipment;
ear protectors;
clean air, if working inside;
ensuring the safety of the equipment.
6 Interpretation of tests
The tests shall be interpreted based on values of N10 for DPL, DPM, DPH and N20 for DPSH-A and DPSH-B.
Another possibility for the interpretation of test results is the use of the dynamic point resistance (see Annex E). Consideration shall be given to the fact that the rod friction will influence N-values recorded ( see e.g. Annex C). Due to energy losses, when this test is used for quantitative evaluation purposes, it is recommended to know by calibration the actual energy EM transmitted to the drive rods.
7 Reporting of results
7.1 Field
report
At the project site, a summary log according to Annex A shall be completed. Test records according to Annex B are to be used to record the data of each test. The number of blows N10 or N20, as applicable as well as the measured
torque are to be recorded as a function of depth.
The following additional information shall be documented:
weather condition;
interruption of the probing operations with time duration, and change of rods;
each unusual event or observation during the operation (e.g. low blow count, rebound > 50 %, penetration without blows, temporary obstructions, artesian conditions, reasons for early end of probing);
use of any separate precautions against rod friction, e.g. casings or fluids;
7.2 Test report
In the test report, the results of the test shall be presented to scale as step diagram with results of the dynamic probing on the horizontal axis and the depth on the vertical axis.
All field investigations are to be reported about in such a fashion that third persons are able to check and understand the results.
For the purpose of identification and quality assurance, the test report shall include the following information: a) Name of company executing the test;
b) identification of the actual site or area; c) date of test;
d) location and elevation of each test;
e) the type of dynamic probing: DPL, DPM, DPH, DPSH-A or DPSH-B; all divergences from these test procedures shall be described in detail;
f) manufacturer of equipment, lost or fixed cone and fixed or loose anvil, use of dampers; g) a graphical representation with respect to depth of the following data:
the recorded number of blows to drive the cone 10 cm for the DPL, DPM and DPH or 20 cm for the DPSH-A and DPSH-B;
the maximum torque required to rotate the penetrometer at each test level (in Nm),
all interruptions during the work, longer than 5 minutes;
h) the use of any separate precaution against friction such as casing, drilling mud or water; i) any corrections in the presented data;
j) blow count frequency when operating the equipment;
k) details of any unusual event during driving, e.g. penetration without blows, temporary obstructions, artesian conditions.
l) reasons for the end of the test;
m) the signature of the operator in charge, or the field manager.
8 Additional factors influencing the results of dynamic probing
8.1 General
The following factors can effect the results:
geotechnical influences and
equipment influences.
In order to avoid misinterpretation of the dynamic probing results, these factors should be considered; also findings from direct soil explorations (e.g. drilling and sampling methods according EN ISO 22475) have to be available.
8.2 Geotechnical influences
8.2.1 Influence of soil type, soil group and soil characteristics
For coarse-grained soils for example, apart from density, the grain structure, the grain size distribution, the grain shape and grain roughness, the mineral type, the degree of cementation and the strain condition in the soil can effect the results.
Examples for influences of soil type, soil group and soil characteristics are given in Annex C.1 to C.3. An example for the influence of the boundary depth is given in Annex C.4.
For fine grained soils, rod friction can have a significant influence on the recorded blow count. The use of drilling mud and water can reduce this effect (Annex C.2).
8.2.2 Influence of the groundwater
Under otherwise equal soil conditions, the number of blows in coarse-grained soils is lower below the groundwater level; this is particularly marked for low penetration resistances. Examples of the influence of the ground water are given in Annex C.5.
Under otherwise equal soil conditions, the number of blows in silty soils is higher below the ground water level.
8.3 Equipment influences
To be considered as equipment influences on the penetration resistance are:
cone diameter;
rod length and deviation;
energy losses within the drive systems.
Annex A
(normative)
Summary log for dynamic probing
Only the content of the summary log is normative. The user is free to create a different format.
Place within which or which is nearest to*) location of penetration test: ____________________________________ ____________________________________________________________________________________________ X,Y,Z coordinates: ____________________________________________________________________________ Client/job number: _____________________________________________________________________________ Name and location of project: ____________________________________________________________________ Contractor: ______________________________ Equipment operator: __________________________________ Date of test: __________________________________________________________________________________ Type of dynamic probing *): DPL, DPM, DPH, DPSH-A, DPSH-B: _______________________________________ Equipment checked and in accordance with EN ISO 22476-2, 4.4; Yes/No*) on: ____________________________
Field sketch (scale 1 :_______/not to scale) *) with direct explorations (e.g. boreholes) entered:
Other relevant data: ___________________________________________________________________________
Signature:___________________________________________ Name of the operator in charge
or field manager: _____________________________________ *) Delete as applicable
Annex B
(normative)
Test record for dynamic probing
Only the content of the test record is normative. The user is free to create a different format.
Contractor: Job number: Enclosure:
Name of project:
Dynamic probing test No: Date:
Type of dynamic probing test*): DPL, DPM, DPH, DPSH-A, DPSH-B or:
Lost/fixed cone *) Fixed/loose anvil *)
X, Y, Z coordinates
Depth; add 10, 20 or 30 m (as depth > 10 m): + m
Depth N10/N20*) Depth N10/N20*) Depth N10/N20*) Depth N10/N20*) Depth N10/N20*)
0,10 2,10 4,10 6,10 8,10 0,20 2,20 4,20 6,20 8,20 0,30 2,30 4,30 6,30 8,30 0,40 2,40 4,40 6,40 8,40 0,50 2,50 4,50 6,50 8,50 0,60 2,60 4,60 6,60 8,60 0,70 2,70 4,70 6,70 8,70 0,80 2,80 4,80 6,80 8,80 0,90 2,90 4,90 6,90 8,90 1,00 3,00 5,00 7,00 9,00 Nm Nm Nm Nm Nm 1,10 3,10 5,10 7,10 9,10 1,20 3,20 5,20 7,20 9,20 1,30 3,30 5,30 7,30 9,30 1,40 3,40 5,40 7,40 9,40 1,50 3,50 5,50 7,50 9,50 1,60 3,60 5,60 7,60 9,60 1,70 3,70 5,70 7,70 9,70 1,80 3,80 5,80 7,80 9,80 1,90 3,90 5,90 7,90 9,90 2,00 4,00 6,00 8,00 10,00 **) **) **) **) **) *) Delete as applicable. **) measured torque Other data
Groundwater: ... m below starting point
Annex C
(informative)
Examples for geotechnical and equipment influences on the dynamic
probing results
C.1 Examples for results of dynamic probing in coarse-grained soils
Other conditions remaining the same, the following applies:a) The penetration resistance increases more than linearly with increasing relative density of the soil; thus a change in relative density, for example as a result of deep compaction, can be detected by dynamic probing; b) soils with sharp-edged or rough particles possess a higher penetration resistance than soils with round and
smooth particles;
c) cobbles and boulders can significantly increase the penetration resistance;
d) particle size distribution (uniformity coefficient and grading curve) influence the penetration resistance; e) penetration resistance is considerably increased by cementation.
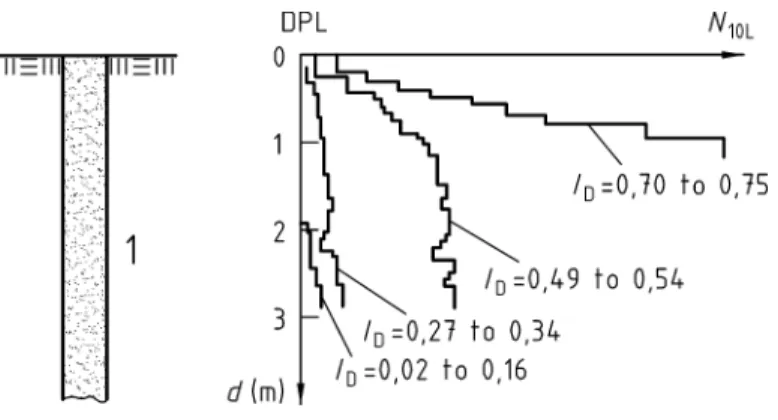
Figure C.1 shows the results of a light dynamic probing test (DPL) in backfilled soil.
Key
1 Medium and coarse sand
ID Relative density
d Depth
Figure C.1 — Change in penetration resistance with relative density in a homogeneous backfilled soil The test were made in a test pit in which medium and coarse sand had been placed in layers of different relative densities. The penetration resistance increases sharply with increasing relative density of the soil; the indication thus becomes more sensitive.
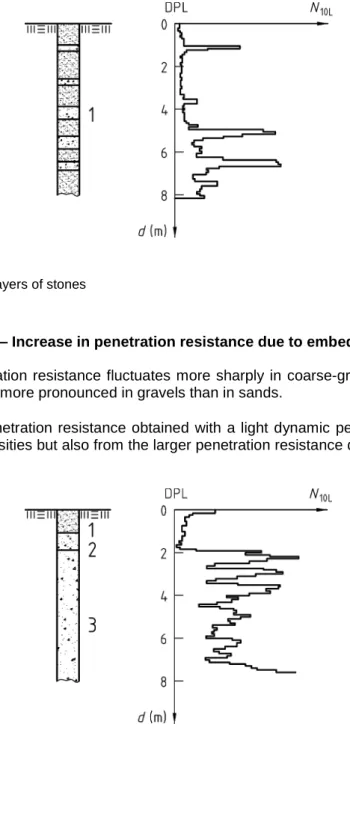
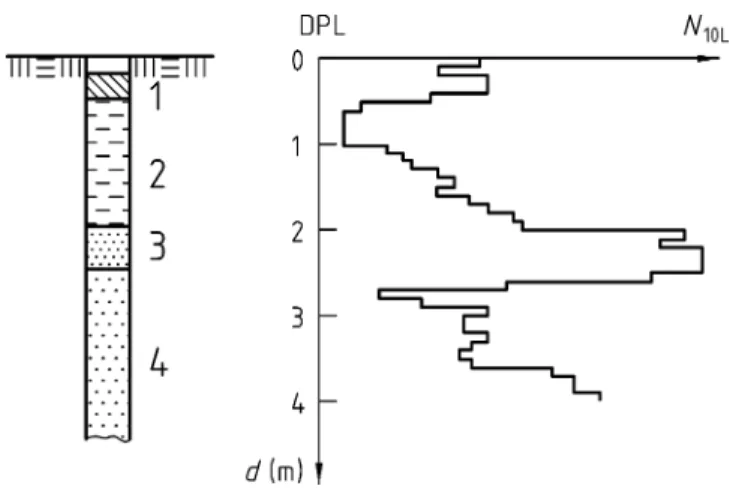
Figure C.2 shows the increase in penetration resistance when there are thin layers with embedded cobbles. Locally occurring peaks of penetration resistance do not represent a measure of the bearing capacity of the whole layer.
Key
1 Medium silt, fine-sandy with layers of stones
d Depth
Figure C.2 — Increase in penetration resistance due to embedded cobbles
Figure C.3 shows that penetration resistance fluctuates more sharply in coarse-grained soils than in fine grained soils. The range of variation is more pronounced in gravels than in sands.
The absolute variations in penetration resistance obtained with a light dynamic penetrometer (DPL) do not result only from differing relative densities but also from the larger penetration resistance due to displacing or breaking up of embedded larger particles.
Key
1 Silt, sandy 2 Silt
3 Gravel
d Depth
Figure C.3 — Variations in penetration resistance in fine-grained and coarse-grained soils
Figure C.4 shows the effect of cementing of the particles of a sand layer on the penetration resistance to a light dynamic penetrometer (DPL). This type of cementing may remain undetected with borings. The cementing was observed in trial pits.
Key
1 Loam
2 Clay
3 Medium sand, cemented 4 Medium sand
d depth
Figure C.4 — Increase in penetration resistance in a cemented medium sand
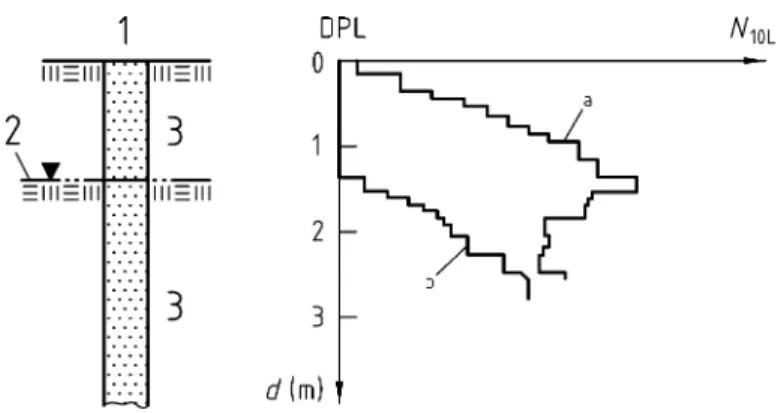
C.2 Examples for results from dynamic probing in fine-grained soils
In soft soil types the skin friction along the rod has considerable influence on the penetration resistance. This may mean, for example, that cavities in the subsoil are not recognised as such.
Figure C.5 shows that the Standard Penetration Test (SPT), unlike the result produced by the heavy dynamic penetrometer (DPH), shows virtually the same penetration resistances in clay because here the skin friction along the rod has been eliminated by performing the SPT in a borehole.
Key
1 Fill earth
2 Silt, sandy, gravely 3 Gravel, sandy 4 Clay
d depth
Figure C.5 — Increase in penetration resistance as a result of skin friction along the rod using a heavy dynamic penetrometer (DPH) compared with the Standard Penetration Test (SPT)
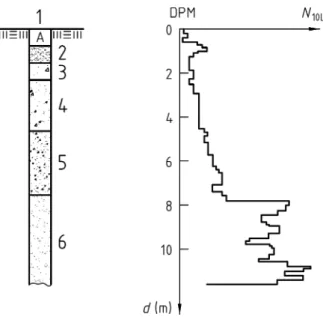
Figure C.6 shows DPM profiles driven with and without the aid of drilling mud. The drilling mud reduces the friction on the drive rods allowing penetration to greater depth. This data has not been corrected for friction using the torque measurements.
Figure C.6 — Reduction of skin friction due to drilling mud
Figure C.7 shows the DPM data from Figure C.6 corrected using the torque readings to correct for the effect of friction on the rods. The correction reduces the N10M values at the deeper depths and presents a reproducible depth
profile both with and without the drilling mud.
Figure C.7 — Example for the effect of torque measurement correction in a fine-grained soil
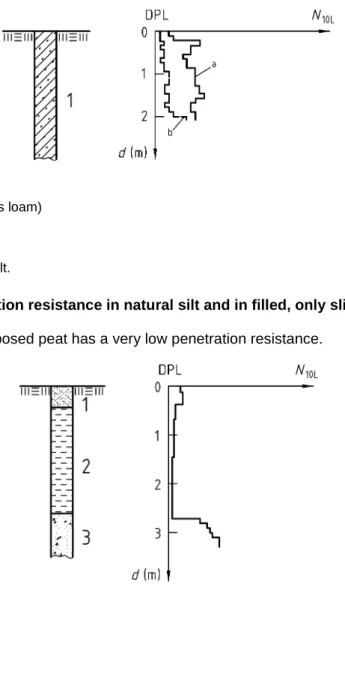
Figure C.8 shows the result of a dynamic probing using the light dynamic penetrometer (DPL) in relation to structural changes in a soil in:
a) natural silt and
b) filled, only slightly compacted silt.
Key
1 Medium silt, weak, clayey (loess loam)
d depth a) natural silt
b) filled, only slightly compacted silt.
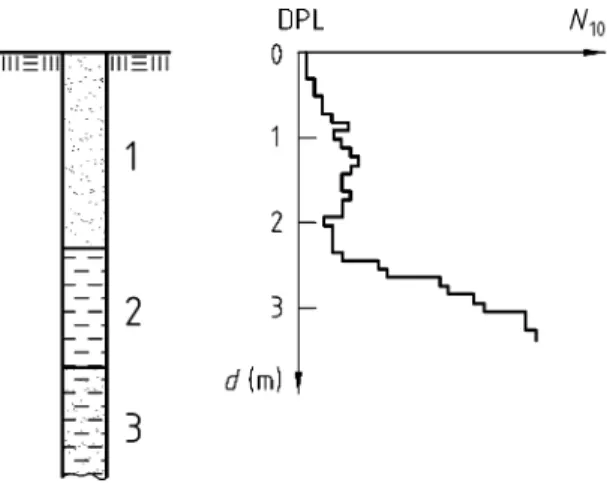
Figure C.8 — Penetration resistance in natural silt and in filled, only slightly compacted silt Figure C.9 shows that a decomposed peat has a very low penetration resistance.
Key
1 Silty clay
2 Peat decomposed 3 Clay, sandy, very silty
d depth
Figure C.9 — Dynamic probing in decomposed peat
Figure C.10 shows that a fibrous, barely decomposed peat shows high levels of penetration resistance, including skin friction. Similiar effects can be observed in highly organic clays and silts.
Key
1 Gravel and sand 2 Peat, fibrous
3 Fine sand and silt, slightly clayey
d depth
Figure C.10 — Dynamic probing in fibrous, barely decomposed peat
C.3 Example for results of dynamic probing in mixed-grained soils
Since these influences overlap, the possibility of an incorrect interpretation is relatively great.Figure C.11 shows the fluctuations in penetration resistance using a medium dynamic penetrometer (DPM) in various types of soil. The fluctuations are greater in soils with mixed grain sizes (e.g. silty coarse sand) owing to the higher proportion of coarse grains, than in fine-grained soils with organic admixtures (e.g. lake marl).
Key
1 Fill
2 Clayey sand, gravel, silty 3 Peat
4 Lake marl with remnants of plants 5 Clayey lake marl
6 silty coarse sand, fine-sand
d depth
Figure C.11 — Variations in penetration resistance in various soils
C.4 Example for penetration resistance results in shallow depths
In coarse-grained soils, the boundary or critical depth (1 to 2 m below the ground surface) increases with relative density and cone diameter. In addition, the penetration resistance increases sharply until the boundary depth is reached. Below the boundary depth, the penetration resistance remains nearly constant under otherwise equal conditions.
The overburden of the layer investigated (e.g. by back-fill) or any additional loading of the subsoil (e.g. foundation loads) may increase the penetration resistance.
Figure C.12 shows two results of dynamic probing with a light dynamic penetrometer in a test pit in which a coarse sandy medium sand of the same density throughout the depth has been laid. The test carried out from the surface of the back-fill showed initially an increase in penetration resistance with depth and then a virtually constant value. After removing a 1,30 m thick layer, a second test was carried out. This showed, starting from the new surface, initially a lower penetration resistance in the zones near the surface compared with the first test, but after a sharp increase in penetration resistance it gave the same values at greater depths as the first test, i. e. from the surface of the back-fill.
Key
a) Test from the surface of the back-fill b) Test from the bottom of the pit 1 Surface of back-fill
2 Bottom of pit
3 Coarse medium sand, dense
d depth
Figure C.12 — Low penetration resistance in the zone near the surface of a dense medium sand
C.5 Example for the influence of groundwater
In coarse-grained soils, other conditions being the same, the penetration resistance in groundwater is lower than above the groundwater.
In fine-grained soils, owing to the capillary effect, the groundwater has little influence on penetration resistance. The penetration test results may be influenced by porewater pressures and groundwater flow.
The results shown in Figure C.13 show the influence of groundwater in coarse-grained soils. Where there is groundwater, lower penetration resistances are measures even if the relative density is the same.
Key
a) No groundwater
b) Groundwater at 0,2 m below the surface of the terrain 1 Fine and medium sand
d depth
Figure C.13 — Change in the penetration resistance of a fine and medium sand as a result of groundwater The following is an example of quantifying the influence of groundwater on dynamic probing test results in cohesionless soils. Comparative tests were conducted with DPL and DPH in a poorly graded sand (SP) and with DPH in a well graded sand-gravel mixture (GW) under controlled conditions above and below groundwater level. Figure C.14 shows the corresponding relations of number of blows N10L and N10H above to number of blows N’10L
and N’10H below groundwater. The relations have the general form N10 = a1 N’10 + a2; they are of deterministic
Soil classification Uniformity coefficient Coefficients DPL DPH Uc = d60/d10 a1 a2 a1 a2 SP 2,0 2,0 1,3 2,0 GW - - 1,2 4,5 Key
1 Number of blows N'10L and N'10H below groundwater
2 Number of blows N10L and N10H above groundwater
SP poorly graded sand
GW well graded sand-gravel mixture
Figure C.14 — Examples of the influence of ground water on dynamic probing results
C.6 Examples for equipment influences
In dynamic probing, penetration resistance increases with increasing cross-section of the penetrometer cone. Penetration resistance is influenced to an extent that depends on how the ratio of cone diameter to rod diameter affects skin friction along the rod. This influence also depends on the type of soil, the sequence of layers and the depth of penetration.
In fine-grained soils, when the ratio of cone cross-section to rod diameter is small the skin friction along the rod can increase rapidly.
Figure C.15 shows that in layers near the surface the penetration resistance is generally greater with a larger penetrometer cone diameter than with the smaller cone diameter at constant rod diameter. In deeper layers, the change in penetration resistance depends on the type and condition of the soil. Thus with dynamic probing in silt layers, the penetration resistance of a smaller cone diameter is greater compared with a larger cone diameter due to skin friction.
With the smaller cone diameter, the skin friction along the rod has a very substantial effect because the cone is only slightly wider than the rod.
With dynamic probing, other conditions remaining the same, a larger number of blows is necessary as the length of the rod increases, because the efficiency decreases.
Key
a) larger cone diameter b) smaller cone diameter 1 Gravel, sandy
2 Silt, sandy, slightly clayey (stiff) 3 Silt, clayey (soft)
d depth
Figure C.15 — Influence of the cross section of the cone on the results of dynamic probing
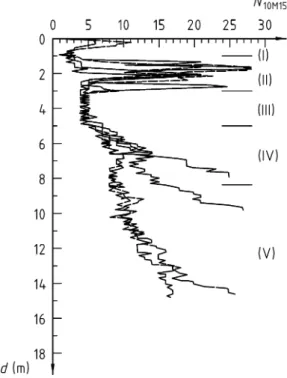
Figure C.16 shows N10 data from four different configurations of dynamic probing equipment. The sensitivity of the
lighter weight configurations show greater variations within each soil layer and the heavier configurations give N10
values close to or lower than the recommended minimum acceptable value. Drilling mud was used to reduce the friction on the drive rods for all but the DPSH probing significantly reducing penetration depth.
Key
I crust
II weathered till III unweathered till IV silty sand
d depth
Annex D
(informative)
Example of a method to measure the actual energy
D.1 Principle
The measurement of the energy transmitted to the drive rods can be made by means of an instrumented section of rod positioned at a distance greater than 10 times the rod diameter below the point of hammer impact on the anvil.
Key
1 Anvil
2 Part of instrumented rod 3 Drive Rod
4 Strain gauge (measuring transducer) 5 Accelerometer
6 Ground
F Force
da diameter of the rod
Figure D.1 — Instrumented rod (example)
D.2 Equipment
The measuring device consists of a removable instrumented rod fixed between the anvil and the head of rods. It includes :
a system for measurement of vertical acceleration having a linear response up to 5000 g;
a system for measurement giving the axial deformation induced in the rod;
an apparatus, with a resolution better than 1.10-5s, for viewing, recording and pre-treatment of the signals;
data processing system (data logger and computer).
When strain gauges are used for the measurement of the axial deformation, they should be uniformly distributed around the instrumented rod, preferable in two orthogonal pairs.
D.3 Measurements
At each impact, check the correct operation of the measuring equipment and the sensors by displaying the results of measurements
It should be verified that the signals from the accelerometers and of the gauges are null before and after the impact For the measurement of the acceleration and deformation, the precision should be better than 2 % of the measured value.
D.4 Calculation
D.4.1 The force F transmitted to the rods is calculated as follow:
( )
t
A
E
( )
t
F
=
a⋅
a⋅
ε
m (D.1)where
m(t) is the measured deformations of the instrumented rod at time t
Aa is the cross-sectional area of the instrumented rod
Ea is the Young’s modulus of the instrumented rod.
D.4.2 The particle velocity v(t) of the measurement section is calculated by integration of the acceleration a(t) with time t.
D.4.3 The basic equation for the energy E which passes into the drive rods is:
∫
=
' 0)
(
)
(
)
'
(
tdt
t
V
t
F
t
E
(D.2) whereE(t’) is the driving energy which passes into the drive rod up to time t’ after the impact.
Various methods for developing the above equation and additional information can be found in the bibliography. C.4.4 The SPT hammer energy to take into account is the mean value obtained from at least five measures :
∑
=
nE
n
EM
11
(D.3)D.4.5 The hammer energy ratio which characterises each dynamic penetrometer is given by :
1
≤
=
ET
EM
E
r (D.4) where ET = mghh is the falling height of the hammer
m is the mass of the hammer
Hammer Energy Measurement Report
Type of dynamic probing Job number
Date of the test Mass of the hammer Falling height
ET = m·g·h
Characteristics of the instrumented rod Diameter da
Length of the instrumented rod Area A
Modulus Ea
Velocity of wave Ca
Key see Figure D.1
Mass density ρa
Force Particle Velocity
Acceleration Displacement
Observations:
EM= ET=
Date
Name and signature of the operator in charge or field manager
Annex E
(informative)
Interpretation of test results by using the dynamic point resistance
The results from dynamic probing are usually presented as blows per 10 cm penetration (N10) against depth as a
straight field record and should be within the standard range of values (typically 3 to 50). The N10 values can be
interpreted to give the unit point resistance rd and the dynamic point resistance qd. The value of rd is an assessment of
the driving work done in penetrating the ground. Further calculation, to produce qd, modifies the rd value to take account of the inertia of the driving rods and hammer after impact with the anvil. The calculation of rd includes the different hammer weights, the height of fall and the different cone sizes. The different sizes and number of extension rods are included in the calculation of qd, and so this should allow comparison of different equipment configurations.
Typically the equations used are:
Ae
ET
r =
d (E.1) orAe
EM
r =
d (E.2) andr
m
m
m
q
d d'
+
=
(E.3) whererd and qd are resistance values in Pa
m is the mass of the hammer in kg
g is the acceleration due to gravity in m/s2. h is the height of fall of the hammer in m
A is the area at the base of the cone in m2
e is the average penetration in m per blow (0,1/N10 from DPL, DPM, DPM, and DPH, and 0,2/N20 from DPSH)
N10 is the number of blows per 100 mm
N20 is the number of blows per 200 mm
m' is the total mass of the extension rods, the anvil and the guiding rods at the length under consideration, in kg The Figure E.1 gives data from DPL, DPM ands DPH for a stiff overconsolidated clay site. While each configuration of test equipment gives a different value of N10 the calculation of rd brings the DPM and DPH closer and the calculation of
qd shows all three configurations giving very similar profiles.
The Figure E.2 shows data from an overconsolidated glacial till and includes data from DPL, DPM, DPH and DPSH. Here again the rd values bring the profiles closer but calculation of qd gives very similar profiles.
The use of qd has the potential to allow the configuration of equipment to be varied down a profile as the blow counts fall too low (reduce the hammer mass) or rise too high (increase the hammer mass).
Key
I weathered London Clay II unweathered London Clay
d depth
Figure E.1 — Data from DPL, DPM and DPH for a stiff overconsolidated clay site
Key
I crust
II weathered till III unweathered till IV silty sand
d depth
Bibliography
ASTM D 4633-86: Standard test method for stress wave energy measurements for dynamic penetrometer testing systems. American Society for Testing and Materials, Philadelphia 1986.
Butler, J.J., Caliendo, J.A., Goble, G.G.: Comparison of SPT energy measurements methods. Proc. 1st Int. Conf. on Site Characterization, Atlanta 1998, Vol. 2, 901–905.
Farrar, J.A.: Summary of Standard Penetration Test (SPT) energy measurements experience. Proc. 1st Int. Conf. on Site Characterization, Atlanta 1998, Vol. 2, 919–926.
Gonin, H.: Du Pénétromètre dynamique au battage des pieux. - Revue Française de Géotéchnique No 76, 1996. Gonin, H.: La formule des Hollandais ou le conformisme dans l'enseignement. - Revue Française de Géotéchique No 87,1999.
Matsumoto, T; Sekeguchi, H., Yoshida, H. & Kita, K: Significance of two-point strain measurements in SPT. - Soils and Foundations, JSSMFE, Vol. 32, 1992, No 2, pp. 67-82.