861$7,21$/&200,66,2121/,%5$5,(6$1',1)250$7,216&,(1&(
1110 Vermont Avenue, NW, Suite 820, Washington, DC 20005-3522 Telephone: 202-606-9200; Fax: 202-606-9203; Web: www.nclis.gov
The National Commission on Libraries and Information Science is a permanent, independent agency of the federal government, established in 1970 with the enactment of Public Law 91-345. The Commission is charged with:
• advising the President and the Congress on the implementation of policy;
• conducting studies, surveys, and analyses of the library and informational needs of the nation;
• appraising the adequacies and deficiencies of current library and information resources and services; and
• developing overall plans for meeting national library and informational needs.
The Commission also advises Federal, state, and local governments, and other public and private organizations, regarding library and information sciences, including consultations on relevant treaties, international agreements and implementing legislation, and it promotes research and development activities which will extend and improve the nation's library and information handling capability as essential links in the national and international networks
Jeanne Hurley Simon, Chair Martha Gould, Vice Chair
C.E. “Abe” Abramson LeVar Burton Frank J. Lucchino
Walter Anderson Joan R. Challinor Bobby L. Roberts
Rebecca T. Bingham Mary S. Furlong Joel D. Valdez
José-Marie Griffiths
James H. Billington, Diane B. Frankel,
Librarian of Congress
Robert S. Willard
Director, Institute of Museum & Library Services Executive Director
Judith C. Russell
Deputy Director
The views, opinions and recommendations expressed in the body of this report are those of the U.S. National Commission on Libraries and Information Science, and not necessarily those of the American Library Association or its members. The views, opinions and recommendations in the appendices to this report are those of the contractors, Dr. John Carlo Bertot and Dr. Charles R. McClure, and do not necessarily reflect the official position or policy of the research sponsors.
6XJJHVWHG&LWDWLRQ
U.S. National Commission on Libraries and Information Science.
Moving toward more effective public Internet access: the 1998 national survey of public library outlet Internet connectivity; a report based on research sponsored by the U.S. National Commission on Libraries and Information Science and the American Library Association and conducted by John Carlo Bertot and Charles R. McClure. Washington, DC: U.S. Government Printing Office, 1999.
861
$7,21$/&
200,66,2121/
,%5$5,(6$1',
1)250$7,216
&,(1&(0RYLQJ7RZDUG0RUH(IIHFWLYH3XEOLF,QWHUQHW$FFHVV
7KH1DWLRQDO6XUYH\RI3XEOLF/LEUDU\2XWOHW,QWHUQHW&RQQHFWLYLW\
$5HSRUW%DVHGRQ5HVHDUFK6SRQVRUHGE\WKH861DWLRQDO&RPPLVVLRQ RQ/LEUDULHVDQG,QIRUPDWLRQ6FLHQFHDQGWKH$PHULFDQ/LEUDU\$VVRFLDWLRQ DQG&RQGXFWHGE\-RKQ&DUOR%HUWRWDQG&KDUOHV50F&OXUH861DWLRQDO&200,66,2121/,%5$5,(6$1',1)250$7,216&,(1&( 9HUPRQW$YHQXH1:6XLWH:DVKLQJWRQ'&
BBBBBBBBBBBBBBBBBBBBBBBBBBBBBBBBBBBBBBBBBBBBBBBBBBBBBBBBBBBBBBBBB
For sale by the U.S. Government Printing Office
Superintendent of Documents, Mail Stop SSOP, Washington, DC 20402-9328 Stock Number 040-000-00718-1
United States National Commission on Libraries and Information Science
March 1999
The President The White House Washington, DC 20500
The Vice President United States Senate Washington, DC 20510
The Speaker of the House of Representatives United States House of Representatives Washington, DC 20515
Dear Mr. President, Mr. Vice President and Mr. Speaker:
In fulfilling the Commission's statutory mission to advise the President and the Congress on the library and information needs of the public, I am pleased to present Moving Toward More
Effective Public Internet Access: The 1998 National Survey of Public Library Outlet Internet Connectivity. This report is based on research sponsored by the National Commission on Libraries
and Information Science and the American Library Association. The research was conducted at the Commission's request to follow up on the 1997 survey of public libraries and the Internet, also co-sponsored by the National Commission on Libraries and Information Science and the American Library Association. This report also uses information from the 1994, 1995 and 1996 studies sponsored by the Commission on the same topic.
The 1998 survey is based on a sample of 2,500 of the nation's 15,718 public library outlets. For purposes of this survey an outlet is a main or branch library (bookmobiles are excluded). The survey found that 73.3% of public library outlets now offer public access to the Internet. However, only 68.6% offer graphical public Internet access to the World Wide Web and only 45.3% offer graphical public access to the Web at speeds of 56 kbps or greater.
The earlier surveys measured Internet access in approximately 8,900 public library systems. A library system is a main library and its branches. From those surveys we know that 60.4% of public library systems offered public Internet access in 1997, although only 52.1% offered graphical public Internet access. This was up from 27.8% of library systems offering public Internet access in 1996, with only 23.7% able to provide graphical public Internet access.
Despite the change from a survey of public library systems to a survey of public library outlets, we believe that the trend is clear and the progress is substantial. Nevertheless, the 1998 survey identified significant gaps that continue to concern us.
This report, Moving Toward More Effective Public Internet Access, raises pertinent questions about unequal distribution of Internet access among libraries serving rural, suburban and urban populations. It also addresses for the first time the concept of effective public Internet access, including access to the World Wide Web on workstations with sufficient capability and at speeds of 56 kbps or greater, as well as having a sufficient number of workstations for the population to be served.
In the Commission's letter to the President transmitting the results of the first survey of public libraries and the Internet in June 1994, we stated:
The Commission is concerned that public libraries offer advanced telecommunications and information services that benefit local communities. Just as they have offered open access to recorded knowledge since the earliest days of our nation's history, public libraries have a vital role in assuring that advanced information services are universally available to all segments of the population on an equitable basis.
We know that each of you share our commitment to the critical role of public libraries in assuring broad public participation in the networked environment, and we deeply appreciate your repeated actions and statements confirming that commitment.
This report is transmitted to show the progress we have made toward your goal of having every public library in America connected to the Internet by the year 2000. It also shows the progress we still must make, not just to connect every library, but to make every library a source of effective
public Internet access.
Thank you again for your continued interest in and attention to networked information services for all citizens of this nation through libraries and schools.
Sincerely,
Jeanne Hurley Simon Chairperson
0RYLQJ7RZDUG0RUH(IIHFWLYH3XEOLF,QWHUQHW$FFHVV
7
$%/(2)&
217(176List of Figures and Tables ... ii
Executive Summary...iii
Acknowledgements... v
Moving Toward More Effective Public Internet Access: ... 1
I. Background... 1
1. Telecommunications Act of 1996, Universal Service, and Public Libraries ... 1
2. Public Policy Debate ... 2
3. Information Technology, Internet, and the Digital Economy... 2
4. Public Libraries as a Public Point of Internet Presence... 4
II. Results of the 1998 National Survey of Public Library Outlet Internet Connectivity... 4
1. Availability of Public Internet Access... 5
2. Public Internet Access for Areas with Varying Levels of Poverty... 6
3. Public Internet Access for Urban, Suburban and Rural Areas ... 7
4. Graphical Public Internet Access ... 7
5. Bandwidth as a Component of Public Internet Access... 8
6. Defining Effective Public Internet Access ... 9
7. Key Measures Connectivity and Public Internet Access, 1996-1998... 10
8. Number of Graphical Workstations as a Component of Effective Access ... 11
9. Use of Filtering Software and Availability of an Acceptable Use Policy for Public Internet Access ... 12
III. Findings, Policy Issues, and Commission Responses ... 14
1. Supporting Ongoing Surveys on Public Libraries and the Internet ... 14
2. Initiating a Dialog on Effective Public Internet Access ... 15
3. Identifying Policy Questions and Promoting Additional Research ... 15
IV. Bibliography of Other Statistical Studies Funded by the Commission ... 17 Appendix A: The 1998 National Survey of U.S. Public Library Outlet Internet
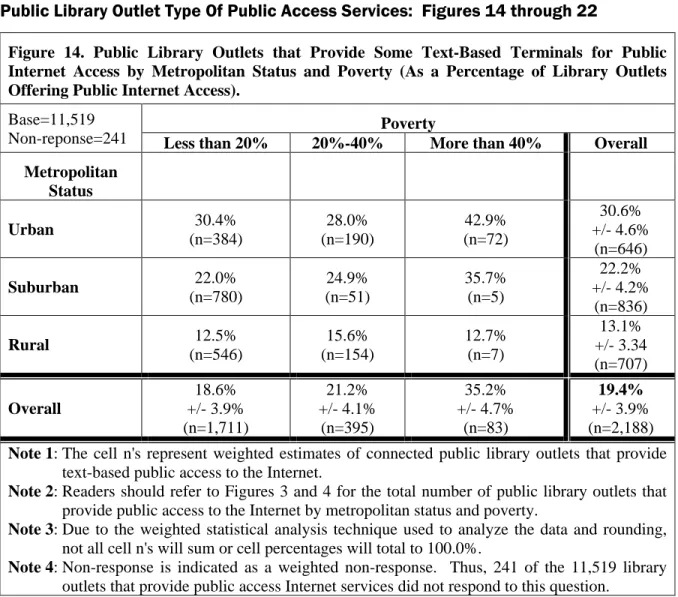
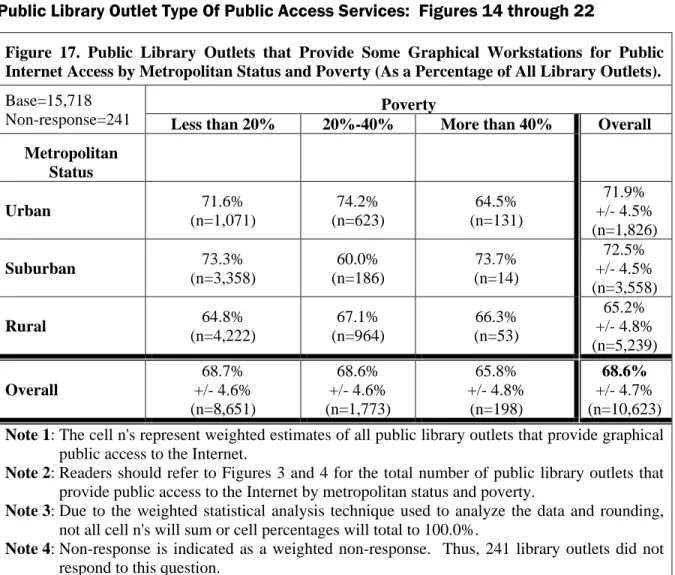
Connectivity; Summary Results, October 1998... A-1 Appendix B: Survey Instrument ... B-1 Appendix C: Survey Methodology ... C-1 Introduction... C-3 1998 Study Survey Methodology... C-3 Outlet Geocoding by Metropolitan Status and Poverty... C-5 Appendix D: Survey Results... D-1 Survey Universe: Figure 1 ... D-3 Public Library Outlet Internet Connectivity and Public Access: Figures 2 through 13 ... D-4 Public Library Outlet Type Of Public Access Services: Figures 14 through 22 ... D-16 Maximum Speed Of Public Access: Figures 23 through 42 ... D-25 Special Software/Hardware For Persons With Disabilities, Filtering Software, and
861DWLRQDO&RPPLVVLRQRQ/LEUDULHVDQG,QIRUPDWLRQ6FLHQFH
— ii —
Appendix E: Contractor's Analysis of the Survey Results ... E-1 Executive Summary... E-3 Key Findings ... E-3 Background ... E-5 Terms and Context ... E-6 Comparisons to Earlier Data... E-6 Themes and Implications from the 1998 Findings ... E-7 Linking Data to Policy Debates and Strategic Planning ... E-9 Acknowledgments ... E-9 References ... E-10
/
,672))
,*85(6Figure 1: Public Library Universes Under Study ... 4
Figure 2: Public Library Internet Connectivity ... 5
Figure 3: Public Internet Access in Public Libraries ... 6
Figure 4: Public Internet Access by Service Area Poverty Levels ... 6
Figure 5: Public Internet Access by Service Area Location... 7
Figure 6: Graphical Internet Access in Public Libraries ... 8
Figure 7: Fastest Speed of Internet Access in Public Libraries ... 9
Figure 8: Progress Toward Effective Public Internet Access ... 10
Figure 9: U.S. Public Libraries and the Internet 1996 To 1998 ... 11
Figure 10: Number of Graphical Internet Workstations for Public Access in Libraries ... 11
Figure 11: Status of Acceptable Use Policies and Internet Filtering Software in Public Libraries ... 13
0RYLQJ7RZDUG0RUH(IIHFWLYH3XEOLF,QWHUQHW$FFHVV
— iii —
(
;(&87,9(6
800$5<Moving Toward More Effective Public Internet Access: The 1998 National Survey of Public Library Outlet Internet Connectivity is a report on research sponsored by the U.S. National Commission on
Libraries and Information Science and the American Library Association. The research was conducted to follow up on the 1997 survey of public libraries and the Internet, also co-sponsored by the National Commission on Libraries and Information Science and the American Library Association. The views, opinions and recommendations expressed in the body of this report are those of the Commission, and not necessarily those of the American Library Association or its members.
Dr. John Carlo Bertot, with the School of Information Science and Policy at the State University of New York, Albany, conducted the survey and processed the results in collaboration with Dr. Charles R. McClure of the School of Information Studies, Syracuse University. The views, opinions and recommendations in the appendices to this report are theirs and do not necessarily reflect the official position or policy of the research sponsors.
The 1998 survey is based on a sample of 2,500 of the nation's 15,718 public library outlets. For purposes of this survey an outlet is a main or branch library (bookmobiles are excluded). The survey found that:
• A substantial number of public library outlets have Internet connectivity (83.6%), provide public Internet access (73.3%), and offer graphical public Internet access (68.6%). However, only 45.3% offer graphical public access to the World Wide Web at speeds of 56 kbps or greater.
• Although the poverty level of the population served does not seem to be a significant factor in determining the availability of public Internet access, metropolitan status does: rural libraries lag behind other types of libraries in providing Internet access. Only 67.6% of rural public libraries offer public Internet access which places these libraries 9.1% behind suburban libraries and 16.4% behind urban libraries.
• Nearly one-third (31.4%) of the library outlets currently offer no graphical public Internet access. 28.3% of the outlets have only one graphic workstation for public Internet access and 14.3% have only two graphic workstations. More needs to be learned about what constitutes an adequate number of public access Internet workstations in a library. Nevertheless, in many libraries, one graphic workstation for public Internet access is likely to be inadequate to meet public needs.
• The Commission believes that achieving universal Internet connectivity is not enough. Libraries need to implement effective public Internet access, offering graphic capability, as well as sufficient speed, workstation functionality, and staff support to meet local needs.
The Commission understands that questions regarding effective public Internet access will require dialog among a number of parties. Since there are a variety of perspectives that federal agencies and departments can bring to bear on this question, the Commission will coordinate within the federal sector to assess what constitutes a minimal level of effective public Internet access. Based on this
861DWLRQDO&RPPLVVLRQRQ/LEUDULHVDQG,QIRUPDWLRQ6FLHQFH
— iv —
assessment, the Commission will advise the President and the Congress about the types and levels of support necessary to achieve effective public Internet access.
The Commission recognizes that the advent of the discount rate for telecommunications services authorized by the Telecommunications Act of 1996, popularly known as the E-Rate, and the importance of the Internet as a national resource ensure that questions about effective public Internet
access will continue to be debated at the federal level for the foreseeable future. Nevertheless, the
Commission feels strongly that these questions remain primarily issues for local assessment and decision-making. To be successful, current and future national programs for public Internet access, such as the E-Rate, need to be based on guidelines for effective public Internet access that allow for the wide variation in local resources and requirements. For these reasons, the Commission will lead a dialog among state and local governments about how to implement and measure effective public
Internet access in light of varying local conditions, including the degree of existing Internet access
among the populations served.
The Commission will continue its support for the annual National Survey of Public Libraries and the Internet to track the evolving state of public Internet access and the implementation of the goals of universal service for public library Internet access.
0RYLQJ7RZDUG0RUH(IIHFWLYH3XEOLF,QWHUQHW$FFHVV
— v —
$
&.12:/('*(0(176The U.S. National Commission on Libraries and Information Science (NCLIS) gratefully acknowledges our partner in funding the research on which this report is based, the American Library Association Office for Information Technology Policy (ALA-OITP).
As with any research project of this scope, there are a number of individuals whose participation contributed greatly to the success of this effort. Dr. John Carol Bertot, with the School of Information Science and Policy at the State University of New York, Albany, conducted the survey and processed the results in collaboration with Dr. Charles R. McClure of the School of Information Studies, Syracuse University. Dr. Dean Jue of Florida State University provided geocoded data for identification of the library outlets and contributed to the development of the study methodology. Andrew Magpantay, then with the ALA Office for Information Technology Policy, also provided guidance and suggestions for the development of the study and for presentation of the data. At the Commission, Judy Russell and Howard Harris reviewed the data and made recommendations for specific analyses as well as preparing this report for publication.
Of course, the Commission also wishes to thank those public librarians who completed the survey. The information they contributed has made it possible to obtain a valuable snapshot of public library Internet service immediately prior to issuance of the first E-Rate funding authorized by the Telecommunications Act of 1996.
861DWLRQDO&RPPLVVLRQRQ/LEUDULHVDQG,QIRUPDWLRQ6FLHQFH
0RYLQJ7RZDUG0RUH(IIHFWLYH3XEOLF,QWHUQHW$FFHVV
0
29,1*7
2:$5'0
25((
))(&7,9(3
8%/,&,
17(51(7$
&&(667KH1DWLRQDO6XUYH\RI3XEOLF/LEUDU\2XWOHW,QWHUQHW&RQQHFWLYLW\ , %DFNJURXQG
The National Commission on Libraries and Information Science (NCLIS) has a long-standing interest in library statistics. Since 1988 NCLIS has maintained a partnership with the National Center for Education Statistics (NCES) focused on collecting and reporting statistics regarding libraries of various types across the United States. In addition, since 1994 NCLIS has tracked the increasing use of the Internet among public libraries.1 At first NCLIS supported these studies solely with its own resources. In 1997 and 1998 the survey was funded jointly by NCLIS and the American Library Association (ALA) Office of Information Technology Policy.2 In each case, the contractors for the research were John Carlo Bertot and Charles R. McClure.3
National surveys of U.S. public libraries and the Internet were done in 1994, 1996, 1997, and 1998 during a period in which the Internet has undergone tremendous growth in terms of users, accessible information content, and range of services. The 1998 National Survey of Public Library Outlet
Connectivity was conducted between April and June 1998, against the backdrop of pending universal
service support for telecommunications services including Internet access in schools and public libraries. The findings of the 1998 survey provide a very useful baseline of data about public library Internet connectivity prior to the availability of universal service funding.
7HOHFRPPXQLFDWLRQV$FWRI8QLYHUVDO6HUYLFHDQG3XEOLF/LEUDULHV
In the Telecommunications Act of 1996 the U.S. Congress recognized the growth of the Internet and the significance of providing individual citizens with access to Internet information content and services. In that legislation the U.S. Congress acknowledged, “the rapidly developing array of Internet and other interactive computer services available to individuals Americans…[as] an extraordinary advance in the availability of educational and informational resources to our citizens” [47 U.S.C. 230]. The Congress also acknowledged the special role of elementary and secondary schools, public libraries, and health care providers in conveying public access to these resources by providing discounted telecommunications services under a program of universal service originally established as a part of the Communications Act of 1934 [47 U.S.C. 254h].
1
A bibliography of the reports in this series is available in Section IV. 2
The views, opinions and recommendations expressed in the body of this report (Sections I through IV)) are those of the Commission, not necessarily those of the American Library Association or its members.
3
Dr. John Carol Bertot, now with the School of Information Science and Policy at the State University of New York, Albany, conducted the 1998 survey and processed the results in collaboration with Dr. Charles R. McClure of the School of Information Studies, Syracuse University. The views, opinions and recommendations in the appendices to this report are theirs and do not necessarily reflect the official position or policy of the research sponsors.
861DWLRQDO&RPPLVVLRQRQ/LEUDULHVDQG,QIRUPDWLRQ6FLHQFH
— 2 —
The Telecommunications Act of 1996 recognizes universal service as “an evolving level of telecommunications services that the [FCC] shall establish periodically under this section, taking into account advances in telecommunications and information technologies and services.” The legislation created the Joint Federal State Board on Universal Service and directs the Board and the Federal Communications Commission (FCC) “to consider the extent to which such telecommunication services,” among other criteria “are essential to education, public health, or public safety” in establishing the definition of universal service.
The Telecommunications Act of 1996 also directs the Joint Federal State Board on Universal Service and the FCC to base forthcoming policies for the preservation and advancement of universal service on a set of principles that provide some insight into the goals of the program. Among these principles are:
• Access to advanced services in all regions of the nation;
• Access in rural and high cost areas; and
• Access to advanced telecommunications services for schools, health care, and libraries. [47 U.S.C. 254b]
For eligible schools and libraries, the mechanism for implementation of universal service established under the Telecommunications Act of 1996 is through a discount program to assist with the costs of Internet and other telecommunications services. Discounts range from 20 to 90% based on need. The discount rate is popularly called the Equity Rate or “E-Rate” because it will provide equitable access for all communities.
3XEOLF3ROLF\'HEDWH
As plans have moved forward to implement universal service for schools and libraries, a wide-ranging public discussion of policy issues related to schools, public libraries, and universal service has begun. From some quarters questions have emerged about the need for universal service support for schools and libraries and about the impact that information technology and Internet access can make upon teaching and learning. Other questions have arisen about the mechanisms for assessing and distributing Universal Service Fund support. In addition, some concerns have been raised about appropriate types of safeguards to regulate the content to which adults and children may gain access via the Internet in schools and libraries. Some of these issues may reach resolution in the near term; debate about others may persist for a very long time.
Whether or not the incorporation of information technology in general or of the Internet in particular within the school curriculum has a direct, singular, and positive effect upon student academic performance is a question that will occupy researchers for some time. However, the role which the Internet and information technology play in the overall U.S. economy has become much clearer during the last year. Even more importantly a growing understanding has emerged about the need for education and training for students, the workforce, consumers, and the public in general to function within a rapidly changing technology-based economy and to assist in sustaining its continued growth.
,QIRUPDWLRQ7HFKQRORJ\,QWHUQHWDQGWKH'LJLWDO(FRQRP\
According to The Emerging Digital Economy,4 information technology and the Internet have begun to exert a great influence on the U.S. economy in recent years. This Commerce Department study states
4
The Emerging Digital Economy, U.S. Department of Commerce, Washington, DC, April 1998, p. 1-8, http://www.doc.gov/ecommerce/emerging.htm.
0RYLQJ7RZDUG0RUH(IIHFWLYH3XEOLF,QWHUQHW$FFHVV
— 3 —
that within four years of its arrival in the open market 50 million people had begun to use the Internet’s resources. Radio took 38 years to reach this level of penetration. Television reached 50 million viewers in 13 years. Sixteen years after the appearance on the market of the first PC kit, the microcomputer had claimed 50 million users. This study estimates that in recent years the information technology sector as a whole has contributed close to 15% of total nominal U.S. Gross Domestic Product, has lowered the overall inflation rate by one full percentage point, and has accounted for more than one-quarter of real U.S. economic growth. In 1996 the information technology sector represented 45% of all business equipment investments and it currently employs 7.4 million people at salaries and wages 64% higher than average salaries and wages in the private sector as a whole.
These perspectives on computing, communication, and the Internet do not yet take into account the rapidly emerging global marketplace of electronic Internet-based commerce. Electronic commerce among businesses is projected to exceed $300 billion worth of sales by 2002. For retail sales using electronic commerce the potential market of those who use the Internet is expected by some experts to grow from 100 million in 1998 to one billion by 2005.
These measures of the effect of the digital economy on overall U.S. economic well being have profound implications for efforts to assist all segments of the U.S. population in accessing and utilizing these technologies. Everyone needs to learn how to discern the value, accuracy, and usefulness of information content conveyed via the Internet. For young people obtaining the education, training, and skills needed to participate in the digital economy represents a high priority. For consumers and those in the workforce learning to make informed choices within the wider and wider array of information available through the Internet, including products, services, employment opportunities, and entertainment, is an important issue. For senior citizens knowledge of how to use various information technologies has significant impact in their efforts to communicate with distant family and friends as well as to identify, evaluate, and exercise options about healthcare, insurance, investments, personal interests, part-time employment, and volunteer work.5
Two recent studies highlight the gaps between our national aspirations for this new digital economy and the reality of those who remain isolated from participating in this sector of the economy.
Bridging the Racial Divide on the Internet6 documents gaps in personal computer ownership and Internet access and use between African Americans and Caucasians as students and as members of the workforce. Some of the policy points made by the authors that appear relevant for libraries include the findings and recommendations that:
• African American students need multiple points of Internet access;
• Educational levels positively influence computer access and Web (Internet) use; and
• Access to Internet accessible workstations in multiple locations translates into greater likelihood of using the Web (Internet).
The second study, Falling through the Net II: New Data on the Digital Divide7 represents work undertaken by the U.S. Department of Commerce as a follow-up to a similar study in 1994. Despite the Commerce Department’s finding of significantly increased computer and modem ownership and
5
Presentation of Jeanne Hurley Simon, Chairperson, National Commission on Libraries and Information Science, at the Forum: The Internet: Empowering Older Americans, Special Committee on Aging, United States Senate, July 16, 1998, http://www.nclis.gov/what/speeches/aging.html.
6
Thomas P. Novak and Donna L. Hoffman, "Bridging the Racial Divide on the Internet: The Impact of Race on Computer Access and Internet Use, Science, 280, April 17, 1998, p. 380 and following. A longer version of the paper is available at http://129.59.210.73/papers/race/science.html.
7
Falling through the Net II: New Data on the Digital Divide, National Telecommunications and Information Agency, U.S. Department of Commerce, Washington, DC, July 1998, http://www.ntia.doc.gov/ntiahome/net2/falling.html.
861DWLRQDO&RPPLVVLRQRQ/LEUDULHVDQG,QIRUPDWLRQ6FLHQFH
— 4 —
Internet use between 1994 and 1997, that study finds a persistent and widening gap in penetration of these technologies between income groups, racial groups, and other demographic groups. According to this Commerce Department study “the least connected” include:
• The rural poor;
• Rural and central city minorities;
• Young households; and
• Female-headed households.
Both studies identify geographic and demographic groups that lag with respect to Internet access and emphasize the need for schools, libraries, and community-based access centers (CACs) to provide access to computers and the Internet for those who otherwise lack such access. These studies also emphasize the value that access to computers and the Internet from more than one location (e.g., home, work, school, and library) can have in developing information technology skills and encouraging the use of those skills.
3XEOLF/LEUDULHVDVD3XEOLF3RLQWRI,QWHUQHW3UHVHQFH
Based upon recent research, the public library already serves as an important public point of Internet presence and access, which suggests that the library might play a role in bridging the gaps in Internet access which other researchers have identified. The 2nd Annual MCI LibraryLINK® study8 released in April 1998 found that the public library represents the first choice among a number of other locations as a public point of Internet access outside of home, school, and work. The 3,241 respondents to the survey who used the Internet during the prior six months represented 80.0 million people aged 16 or older in the U.S. and Canada. 15.6 % of those respondents, representing 12.5 million people, reported using the Internet from a location other than home, work, or school. 44.7% of those who used the Internet from a location other than home, work, or school used the Internet from a public library. This means that approximately 5.6 million individuals accessed the Internet through public libraries in the six months prior to the survey.
,, 5HVXOWV RI WKH 1DWLRQDO 6XUYH\ RI 3XEOLF /LEUDU\ 2XWOHW ,QWHUQHW &RQQHFWLYLW\
The 1998 National Survey of Public Library Outlet Internet Connectivity was conducted from April through June 1998 by John Carlo Bertot and Charles R. McClure. It was co-sponsored by the Office for Information Technology Policy of the American Library Association and the National Commission on Libraries and Information Science. The 1998 study builds and expands upon public library Internet data as reported in the 1997 ALA/NCLIS study and the 1994 and 1996 NCLIS research. A sample of 2,500 of the nation's 15,718 public library outlets was selected for this survey. The sample was weighted to represent public libraries servicing areas with varying degrees
8
The MCI Library Link study results are available at http://www.mci.com/librarylink/study.htm.
FIGURE 1
PUBLIC LIBRARY UNIVERSES UNDER STUDY
1996 8,929 Library Systems 1997 8,921 Library Systems 1998 15,718 Library Outlets
0RYLQJ7RZDUG0RUH(IIHFWLYH3XEOLF,QWHUQHW$FFHVV
— 5 —
of poverty as well as those with urban, suburban, and rural locations. The survey achieved a response rate of 75.5%.9
Earlier NCLIS studies about the library as a point of presence for public Internet access focused on the level of connectivity in place among
library systems. A library system consists of a single, independent library or a main library with one or more branch locations or other types of outlets for service, such as a bookmobile. As shown in Figure 1, there are approximately 8,900 library systems in the U.S.10 The 1998 National Survey of Public
Library Outlet Internet Connectivity departs
from the previous surveys in this series by focusing on the level of Internet connectivity at library outlets. For purposes of the 1998 survey, a library outlet is either a main library
or a branch, excluding bookmobiles. As shown in Figure 1, there are 15,718 public library outlets in the U.S. covered by the survey.11
Within this report, the terms “library outlet(s)” and “library(ies)” will be used interchangeably, and the term “library system(s)” will always be used when referencing data from the earlier surveys. Also, unless otherwise specified, references to library(ies) will mean public library(ies).
Comparisons between the results of the 1998 survey and previous surveys must be done with great caution due to the differences in universe size and library type under study.12 The 1998 percentages may be the result of new Internet access for library systems that previously reported no Internet service, or it may result from library systems that had reported Internet service in the main library in prior years that have now extended Internet service to additional outlets. It is probably a combination of both, but the 1998 survey was not designed to collect that data. Despite the differences, these three surveys depict a substantial increase in public library Internet connectivity: from 44.4% in 1996 and 72.3% in 1997 for public library systems to 83.6% in 1998 for public library outlets as shown in Figure 2.13
$YDLODELOLW\RI3XEOLF,QWHUQHW$FFHVV
The library connectivity reported in Figure 2, however, is not a measure of public Internet access, since it includes libraries that are connected to the Internet exclusively for staff use. Availability of public access to the Internet lags behind connectivity by 10.3%. Figure 3 shows that 27.8% of public library systems had public Internet access in place in 1996. By 1997 60.4% of public library systems
9 The survey instrument is available in Appendix B. The survey methodology is described in Appendix C. 10
Bertot, J.C., and McClure, C. R., The 1997 National Survey of Public Libraries and the Internet: Final Report, American Library Association, Office for Information Technology Policy, Washington, DC, 1997, page 8; and Bertot, J.C., and McClure, C.R., The 1996 National Survey of Public Libraries and the Internet: Progress and Issues, U.S. National Commission on Libraries and Information Science, Washington, DC, 1996, page 6.
11
Based on Appendix D, Figure 1: Public Library Outlets by Metropolitan Status and Poverty. According to NCES data on public library outlets, there are 16,792 public library outlets, of which 894 are bookmobiles. After subtracting the 894 bookmobiles and addressing other issues encountered by the study team, it was possible to geocode 15,718 outlets.
12
A bar appears between the 1996 and 1997 data and the 1998 data in each Figure that compares the three surveys in order to emphasize the difference between the survey universes and library types.
13
Based on Appendix D, Figure 2: Public Library Outlets Connected to the Internet (As a Percentage of All Library outlets).
FIGURE 2 PUBLIC LIBRARY INTERNET CONNECTIVITY 1996 44.4% Library Systems 1997 72.3% Library Systems 1998 83.6% Library Outlets
861DWLRQDO&RPPLVVLRQRQ/LEUDULHVDQG,QIRUPDWLRQ6FLHQFH
— 6 —
offered public Internet service. In the current survey 73.3% of all library outlets, including independent or main libraries and branch libraries, provide public Internet access.14
Historically, providing access to advanced communications and information services to individuals at various levels of income has been an important national goal. This is reaffirmed by provisions of the Telecom-munications Act making the availability of advanced communications and information services throughout the U.S. one objective of universal service. Public libraries are the traditional means of assuring broad public access to information services, without regard to income. Figure 3 shows that there has been remarkable progress toward assuring the availability of some level of free public Internet access through America’s public libraries in the past two years, before the release of the E-Rate funds authorized by the Telecommunications Act. However, based on the results of the 1998 survey, the Commission concludes that it is too soon to congratulate ourselves for a job well done. There is much work still to be done to define and achieve effective public Internet access for all Americans.
3XEOLF,QWHUQHW$FFHVVIRU$UHDVZLWK9DU\LQJ/HYHOVRI3RYHUW\
The 1998 survey represents the first attempt to examine library connectivity by geographic coding of each outlet as urban, suburban, or rural15 and to understand the disparities in public access to the Internet among libraries in these locations. The 1998 survey also makes a first attempt to study library Internet connectivity in terms of the relative concentration of poverty within the area surrounding the library. For purposes of the 1998 survey that area consisted of the population within a one mile radius from an urban library outlet and within a three or ten mile radius of an outlet in a suburban or rural location, respectively.16
14
Based on Appendix D, Figure 3: Internet Status for All Public Library Outlets by Metropolitan Status (As a Percentage of All Library Outlets).
15
This terminology represents an informal notation for the formal statistical categories provided in Appendix C. 16
This radius is not necessarily all, or even within, the library outlet’s service area. For example, a suburban branch library less than three miles from a city boundary may not be responsible for servicing city residents, but the relative poverty of those residents will be calculated in the geocoding of that outlet location.
FIGURE 3
PUBLIC INTERNET ACCESS IN PUBLIC LIBRARIES 1996 27.8% Library Systems 1997 60.4% Library Systems 1998 73.3% Library Outlets 79.5% 72.8% 73.2% 50.0% 55.0% 60.0% 65.0% 70.0% 75.0% 80.0% 85.0% Pove rty Le s s than 20% Pove rty Be tw e e n 20% and 40%
Pove rty Gre ate r than 40% 73.3%
Ave rage FIGURE 4
PUBLIC INTERNET ACCESS BY SERVICE AREA POVERTY LEVELS
0RYLQJ7RZDUG0RUH(IIHFWLYH3XEOLF,QWHUQHW$FFHVV
— 7 —
Results from the 1998 survey show little variation in public Internet access when comparing libraries with differing poverty levels in the surrounding area, although libraries with poverty levels of more than 40% have a marginally higher level of public Internet access than libraries with a lesser degree of poverty. As shown in Figure 4, 73.2% of public libraries with poverty levels less than 20% in their surrounding area offer public Internet access.17 By comparison, 72.8% of public libraries with poverty levels between 20% and 40% offer public Internet access, and 79.5% of libraries with poverty levels of more than 40% offer such access. Overall, in 1998 public libraries achieved a 73.3% level of public Internet access availability.
3XEOLF,QWHUQHW$FFHVVIRU8UEDQ6XEXUEDQDQG5XUDO$UHDV
A substantial difference does exist with respect to public Internet access through public libraries in terms of metropolitan status. As shown in Figure 5, in 1998 84.0% of urban public libraries and 76.7% of suburban libraries offered public Internet access while only 67.6% of rural public libraries offered such access.18 These percentages reflect a significant difference with respect to public Internet access. The finding that public Internet access in rural areas lags significantly behind that found in urban and suburban areas is consistent with findings regarding the state of individual Internet access as reported by the Commerce Department.19 Lagging wireline telecommunications infrastructure and a less competitive telecommunications market both may contribute to such a lower overall level of access. Suburban and urban libraries situated in more densely populated areas benefit from better access to traditional wireline telecommunications infrastructure and from greater competition among potential service providers.
Suburban and urban libraries also benefit from participation in “library systems” where multiple library outlets share a larger service area and a larger financial base. In such situations, a central decision to put public Internet access in place often results in a number of outlets gaining Internet access. By contrast, rural libraries are more likely to consist of a single library outlet and to have less financial resources.
*UDSKLFDO3XEOLF,QWHUQHW$FFHVV
Increasingly Internet access has come to mean graphical Internet access such as that which users experience via the World Wide Web – with the availability of pictures, sound and even video. While
17
Based on Appendix D, Figure 4: Internet Status for All Public Library Outlets by Poverty (As a Percentage of All Library outlets).
18
Based on Appendix D, Figure 3: Internet Status for All Public Library Outlets by Metropolitan Status (As a Percentage of All Library Outlets).
19
Falling through the Net II: New Data on the Digital Divide, National Telecommunications and Information Agency, U.S. Department of Commerce, Washington, DC, July 1998, http://www.ntia.doc.gov/ntiahome/net2/falling.html.
FIGURE 5
PUBLIC INTERNET ACCESS BY SERVICE AREA METROPOLITAN STATUS
67.6% 76.7% 84.0% 50.0% 55.0% 60.0% 65.0% 70.0% 75.0% 80.0% 85.0%
Urban Suburban Rural
73.3% Average
861DWLRQDO&RPPLVVLRQRQ/LEUDULHVDQG,QIRUPDWLRQ6FLHQFH
— 8 — this type of public Internet access has
increased substantially over time, graphical public Internet access lags behind overall public Internet access in public library outlets by nearly 5%.
As shown in Figure 6, in 1996 23.7% of public library systems offered graphical Internet access to users. The number of public library systems providing graphical Internet access to users more than doubled by 1997, reaching 52.1%. In 1998 68.6% of all public library outlets had implemented graphical Internet access for the public.20
While the percentage of library outlets connected to the Internet in 1998 stands at 83.6% (Figure 2) and the level of library outlets with public Internet access is 73.3% (Figure 3), the level of library outlets with graphical public access to the World Wide Web is only 68.6% (Figure 6). The 4.7% of library outlets that offer public Internet access without graphical Internet workstations cannot provide public access to the very capabilities that for many have come to define the Internet experience.
%DQGZLGWKDVD&RPSRQHQWRI3XEOLF,QWHUQHW$FFHVV
Speed of connection (bandwidth) has become an increasingly important component of Internet service as information services have improved to take advantage of the newest technology and software. With each advance in the speed of a user’s Internet connection, new services, applications, and resources become possible, and users without high speed connections do not have the capability to make effective use of these new developments. At present, a speed of 56 kbps represents the state of the consumer marketplace in terms of modem technology. Being able to connect at 56 kbps allows users to make effective use of graphic and multimedia content on the World Wide Web.21
The 1998 survey inquired about the maximum speed of the Internet connection available for public access in the responding library.22 As shown in Figure 7,23 the 68.6% of public library outlets that offer graphical public Internet access are fairly evenly distributed among those that offer speeds less than 56 kbps (22% of all public library outlets), those that offer 56 kbps Internet access (21.9%) and those that offer speeds greater than 56 kbps (23.7%).24 The remaining 1% of the libraries offering graphical public Internet access either did not respond to the survey question or did not identify a specific speed.
20 Based on Appendix D, Figure 17: Public Library Outlets that Provide Some Graphical Workstations for Public Internet Access by metropolitan Status and Poverty (As a Percentage of All Public Library Outlets).
21
Effective speed may be significantly different for a 56 kbps dial-up connection dedicated to a single workstation than for a 56 kbps leased line shared by multiple workstations. The effective speed of a shared connection varies with the number of workstations in use and is also affected by the age and configuration of those workstations.
22
Survey Instrument, Question 5, Appendix B. 23
Percentages of graphical public access are based on Appendix D, Figure 41: Public Library Outlets that Provide Graphical Public Internet Access by Speed of Connection and Metropolitan Status (As A Percentage of All Public Library Outlets). The other percentages are based on Appendix D, Figure 3: Internet Status for All Public Library Outlets by Metropolitan Status (As A Percentage of All Public Library Outlets) and Figure 17. Public Library Outlets that Provide Some Graphical Workstations for Public Internet Access by Metropolitan Status and Poverty (As a Percentage of All Library Outlets). 24
Based on Appendix D, Figure 41: Public Library Outlets that Provide Graphical Public Internet Access by Speed of Connection and Metropolitan Status (As A Percentage of All Public Library Outlets). Percentages are adjusted to reflect the non-respondents and those who provided "other" answers.
FIGURE 6
GRAPHICAL INTERNET ACCESS IN PUBLIC LIBRARIES 1996 23.7% Library Systems 1997 52.1% Library Systems 1998 68.6% Library Outlets
0RYLQJ7RZDUG0RUH(IIHFWLYH3XEOLF,QWHUQHW$FFHVV
— 9 —
FIGURE 7
MAXIMUM SPEED OF INTERNET ACCESS IN PUBLIC LIBRARIES
'HILQLQJ(IIHFWLYH3XEOLF,QWHUQHW$FFHVV
For individuals establishing personal Internet access in mid-1998, effective Internet access implies a 56 kbps connection to the Internet as well as a computer workstation with sufficient hardware and software capability to support graphic access to the World Wide Web. The Commission believes that effective public Internet access in a library in 1998 has similar requirements: an appropriately equipped computer workstation available for public access to the World Wide Web, with bandwidth from the workstation to the Internet of at least 56 kbps. In the library setting there is, however, one additional requirement — an adequate number of workstations for the population served. As shown in Figure 8, between April and June of 1998 only 45.6% of public library outlets had graphical public Internet access at 56 kbps or greater at one or more workstations.25
25
Based on Appendix D, Figure 41: Public Library Outlets that Provide Graphical Public Internet Access by Speed of Connection and Metropolitan Status (As A Percentage of All Public Library Outlets). Percentages are adjusted to reflect the non-respondents and those who provided "other" answers. The survey instrument did not inquire about other characteristics of the library workstations that would affect their performance.
16.4% 10.3% 4.7% 22.0% 21.9% 23.7% 1.0% 68.6% Not Connected (16.4%)
Connected, No Public Access (10.3%)
Connected, No Graphical Public Access (4.7%)
Graphical Public Access Below 56Kbps (22.0%) Graphical Public Access at 56Kbps (21.9%) Graphical Public Access Above 56Kbps (23.7)
861DWLRQDO&RPPLVVLRQRQ/LEUDULHVDQG,QIRUPDWLRQ6FLHQFH
— 10 —
FIGURE 8
PROGRESS TOWARD EFFECTIVE PUBLIC INTERNET ACCESS
Thus, although the 1998 survey shows levels of connectivity and public Internet access at 83.6% (Figure 2) and 73.3% (Figure 3) respectively, and the level of graphical public Internet access at 68.6% (Figure 6), less than half of all public libraries offered graphical public Internet access at speeds of 56 kbps or greater — the minimum configuration currently necessary for effective public
Internet access in the view of the Commission.
At the time of the survey, any speed less than 56 kbps certainly represented access using a dial-up modem configuration. Some of the 56 kbps access could be dial up connections through modems or modem pools as well. For libraries, use of a dial-up connection may pose additional barriers to
effective public Internet access. In many locations libraries incur per call or per minute charges for
business phone lines. In cases where such charges exist, public Internet access may need to be re-established for each user via a dial-up connection in order to avoid the high cost of a connection which remains in place throughout the day. Such an arrangement may restrict or hinder access in a number of ways -- from library concern about the duration of a user’s Internet session due to financial constraints to the need for staff assistance to dial-out with attendant issues of user privacy.
.H\0HDVXUHV&RQQHFWLYLW\DQG3XEOLF,QWHUQHW$FFHVV
Figure 9 summarizes some of the key measures of connectivity and public Internet access tracked by the surveys sponsored or co-sponsored by NCLIS in 1996, 1997, and 1998. As noted at the beginning of Section II, comparisons between the 1998 survey and the earlier surveys must be done with great caution due to the differences in universe size and library type under study in each year. 26 The earlier NCLIS studies about the library as a point of presence for public Internet access focused on the level of connectivity in place among library systems, while the 1998 survey focuses on the level of
26
A bar appears between the 1996 and 1997 data and the 1998 data in the Table in order to emphasize the difference between the survey universes and library types.
100.0% 83.6% 73.3% 68.6% 45.6% 0.0% 20.0% 40.0% 60.0% 80.0% 100.0% Public Library Outlets Internet Connection Public Internet Access Graphic Public Internet Access 56K or Above Graphic Public Internet Access
0RYLQJ7RZDUG0RUH(IIHFWLYH3XEOLF,QWHUQHW$FFHVV
— 11 —
connectivity among library outlets. Even allowing for these differences, Figure 9 clearly shows substantial growth in connectivity, public Internet access and graphical public Internet access.
FIGURE 9
U.S. PUBLIC LIBRARIES AND THE INTERNET 1996 TO 199827
Year Universe28 Connected
Public Internet Access WWW/ Graphic Access Max Speed 56K or Greater Maximum Speed Less than 56K 1996 8,929 44.4% 27.8% 23.1% 1997 8,921 72.3% 60.4% 52.1% 1998 15,945 83.6% 73.3% 68.6% 45.3% 54.7% 1XPEHURI*UDSKLFDO:RUNVWDWLRQVDVD&RPSRQHQWRI(IIHFWLYH$FFHVV
The 1998 survey also provided the basis for additional insights into the numbers of Internet workstations in public libraries. Figure 9 shows that 31.4% of all library outlets do not have any graphical public access to the Internet.29 At an additional 28.3% of library outlets only a single graphical Internet workstation is available for public access. Stated another way, in only 40.3% of public library outlets do patrons have graphic access to the Internet at more than one workstation. In terms of future research, gaining a better understanding of how the number of public Internet access workstations relates to the population of the library’s service area is a high priority since it would contribute to a more accurate measurement of effective public Internet access. Nevertheless, the Commission believes that it is safe to assume that a single workstation is inadequate for effective
public Internet access in many of these library outlets. FIGURE 10
NUMBER OF GRAPHICAL INTERNET WORKSTATIONS FOR PUBLIC ACCESS IN LIBRARIES
27
Bertot, J.C., and McClure, C. R., The 1997 National Survey of Public Libraries and the Internet: Final Report, American Library Association, Office for Information Technology Policy, Washington, DC, 1997; and Bertot, J.C., and McClure, C. R., The 1996 National Survey of Public Libraries and the Internet: Progress and Issues, U.S. National Commission on Libraries and Information Science, Washington, DC, 1996.
28
The 1996 and 1997 data (Universe) represent public library systems; the 1998 data (Universe) represent individual public library outlets. The difference between a library system and a library outlet is explained at the beginning of Section II. 29
Based on Appendix D, Figure 22: Frequency Analysis of Public Library Outlet Graphical Public Access Workstations. For consistency of presentation, Figure 9 presents the frequency analysis as a percentage of all public library outlets.
Number of Cumulative Graphic Workstations % % Unspecified 2.4% 100.0% 10 or more 3.4% 97.6% 9 0.9% 94.2% 8 1.5% 93.3% 7 1.7% 91.8% 6 2.6% 90.1% 5 2.5% 87.5% 4 4.9% 85.0% 3 6.2% 80.1% 2 14.2% 73.9% 1 28.3% 59.7% None 31.4% 31.4%
861DWLRQDO&RPPLVVLRQRQ/LEUDULHVDQG,QIRUPDWLRQ6FLHQFH
— 12 —
8VH RI )LOWHULQJ 6RIWZDUH DQG $YDLODELOLW\ RI DQ $FFHSWDEOH 8VH 3ROLF\ IRU 3XEOLF,QWHUQHW$FFHVV
For some time the Commission has been concerned about the dangers to children from the “dark side of the Internet.” There are dangers from predatory pedophiles using chat rooms to contact children. There are violations of privacy, especially in the case of marketing efforts that entice kids to provide a wide variety of consumer information about themselves and their families. There are also dangers from exposure to inappropriate materials, generally sexually explicit matter, including pornography, but also hate language, cult messages, and other troublesome material.
The Commission recognizes that these concerns must be balanced against the freedom of speech guaranteed by the First Amendment and the library community’s aversion to censorship. It also acknowledges that individual library policies on Internet use are appropriately local issues, based on the culture, customs and character of each community. Nevertheless, protecting our children is an issue of such importance that the Commission held a hearing in November 1998 on Kids and the
Internet: The Promise and the Perils. The purpose of the hearing was to focus attention on the
enormous benefits of the Internet as well as the significant dangers it poses for children and to seek advice on appropriate means for libraries to protect children without denying them access to the benefits of the Internet.
Many pubic libraries have already addressed the issue of protecting children from inappropriate materials by developing “acceptable use policies” for public Internet access and/or by installing filtering software on some or all of their public access Internet workstations. The Commission believes that the decision about use of filtering software on workstations for public Internet access is a matter for local assessment and decision-making. However, the Commission passed a resolution at its December 3, 1998, meeting in Seattle, Washington, stating:
The U.S. National Commission on Libraries and Information Science feels strongly that the governing body of every school and public library, in order to meet its trustee responsibilities, should establish, formally approve, and periodically review a written acceptable use policy statement on Internet access.
Recognizing the importance of these issues, the 1998 survey contained questions about the use of Internet content filtering software to block pornography30 and also about the availability of an “acceptable use public access Internet policy.”31 Library outlets report availability of acceptable use policies far more frequently than use of content filtering software. The survey results regarding the number of Internet workstations provide some insight into one possible reason for such a preference. The survey results indicate that 42.7% of the 10,251 library outlets offering graphical public Internet access have only one workstation.32 As shown in Figure 10, this is the equivalent of 28.3 % of all public library outlets.
Where only a single public Internet access workstation exists, such a workstation must serve all of the library’s users, whether children and adults. Content filtering to protect children from pornography may constrain the Internet content that adults access as well. Depending on the software used, filtering might block an adult from gaining important information on healthcare or other matters due to the inclusion in the response of terms that the filtering software deems objectionable for children.
30
Survey Instrument, Question 6b, Appendix B. 31
Survey Instrument, Question 7, Appendix B. 32
Based on Appendix D, Figure 22: Frequency Analysis of Public Library Outlet Graphical Public Access Workstations. For consistency of presentation, Figure 10 presents the frequency analysis as a percentage of all public library outlets.
0RYLQJ7RZDUG0RUH(IIHFWLYH3XEOLF,QWHUQHW$FFHVV
— 13 —
Figure 1133 shows that, when the survey data was gathered in May and June 1998, acceptable use policies were already in place in 62.2% of the library outlets, while another 8.9% of these outlets were in the process of developing acceptable use policies. The survey results show only 10.7% of public library outlets using filtering software on some or all of their Internet workstations. Only 2.1% of public libraries did not use filtering software and did not have an acceptable use policy in place or under development.
FIGURE 11
STATUS OF ACCEPTABLE USE POLICIES AND INTERNET FILTERING SOFTWARE IN PUBLIC LIBRARY OUTLETS
33
Acceptable use policy and filtering software data are based on Appendix D, Figure 56: Overall Distribution of Public Library Outlet Acceptable Use Policy for Public Internet Access and Public Internet Access Terminal/Workstation Filtering Software Use (as a Percentage of Library Outlets Offering Public Internet Access). The other percentages are based on Appendix D, Figure 3: Internet Status for All Public Library Outlets by Metropolitan Status (As A Percentage of All Public Library Outlets). For consistency of presentation, the data from Figure 56 are presented as a percentage of all public library outlets. 16.4% 10.3% 2.1% 0.1% 9.4% 1.1% 7.8% 73.3% 52.7% Not Connected (16.4%)
Connected, No Public Access (10.3%)
No Acceptable Use Policy; No Filters on Any Workstation (2.1%)
Acceptable Use Policy; No Filters on Any Workstations (52.7%) No Acceptable Use Policy; Filters on Some or All Workstations (0.1%)
Acceptable Use Policy; Filters on Some or All Workstations (9.5%)
Developing Acceptable Use Policy; Filters on Some or All Workstations (1.1%) Developing Acceptable Use Policy; No Filters on Any Workstations (7.8%)
861DWLRQDO&RPPLVVLRQRQ/LEUDULHVDQG,QIRUPDWLRQ6FLHQFH
— 14 —
,,, )LQGLQJV3ROLF\,VVXHVDQG&RPPLVVLRQ5HVSRQVHV
NCLIS supports work such as this survey based on its statutory authority. The statute states that "The Commission shall have the primary responsibility for developing or recommending overall plans for, and advising the appropriate governments and agencies on, [the library and information services adequate to meet the needs of the people of the United States]" [20 U.S.C. 1504]. In carrying out that responsibility, the Commission shall:
• Advise the President and the Congress on the implementation of national policy by such statements, presentations, and reports as it deems appropriate;
• Conduct studies, surveys, and analyses of the library and informational needs of the nation…and the means by which these needs may be met through information centers [and libraries];
• Develop overall plans for meeting national library and informational needs and for the coordination of activities at the federal, state, and local levels, taking into consideration all of the library and informational resources of the nation to meet those needs; and
• Promote research and development activities that will extend and improve the nation's library and information-handling capability as essential links in the national and international communications and cooperative networks.
6XSSRUWLQJ2QJRLQJ6XUYH\VRQ3XEOLF/LEUDULHVDQGWKH,QWHUQHW
The series of surveys sponsored by the Commission provide valuable baseline information, useful in understanding the state of public library Internet connectivity and service, and the 1998 survey is particularly useful in providing a snapshot of public library Internet service immediately prior to issuance of the first E-Rate funding.
Based on its analyses of the 1998 survey results, the Commission has identified some significant findings as well as a number of policy issues and questions for further research, whether by the Commission and its research partners or by others. Based on the survey and other collateral information, the Commission finds that:
• A substantial number of public libraries have Internet connectivity (83.6%), provide public Internet access (73.3%), and offer graphical public Internet access (68.6%). However, only 45.3% offer graphical public access to the World Wide Web at speeds of 56 kbps or greater.
• Although the poverty level of the population served does not seem to be a significant factor in determining the availability of public Internet access, metropolitan status does: rural libraries lag behind other types of libraries in providing Internet access. Only 67.6% of rural public libraries offer public Internet access which places these libraries 9.1% behind suburban libraries and 16.4% behind urban libraries.
• Nearly one third (31.4%) of the library outlets currently offer no graphical public Internet access. 28.3% of the outlets have only one graphic workstation for public Internet access and 14.3% have only two graphic workstations. More needs to be learned about what constitutes an adequate number of public access Internet workstations in a library. Nevertheless, in many libraries, one graphic workstation for public Internet access is likely to be inadequate to meet public needs.
• The Commission believes that achieving universal Internet connectivity is not enough. Libraries need to implement effective public Internet access, offering graphic capability, as well as sufficient speed, workstation functionality, and staff support to meet local needs.
0RYLQJ7RZDUG0RUH(IIHFWLYH3XEOLF,QWHUQHW$FFHVV
— 15 —
Based on these findings, the Commission will continue its support for the annual National Survey of Public Libraries and the Internet to track the evolving state of public Internet access and the implementation of the goals of Universal Service for public library Internet access.
,QLWLDWLQJD'LDORJRQ(IIHFWLYH3XEOLF,QWHUQHW$FFHVV
The Commission understands that questions regarding effective public Internet access will require ongoing dialog among a number of parties. In the federal sector this includes a number of agencies and departments that have active interests and responsibilities.
Recognizing the variety of perspectives which federal agencies and departments can bring to bear on such questions, the Commission will coordinate within the federal sector to assess what constitutes a minimal level of effective public Internet access. Based on this assessment, the Commission will advise the President and the Congress about the types and levels of support necessary to achieve effective public Internet access on an ongoing basis.
The Commission recognizes that the advent of the E-Rate and the importance of the Internet as a national resource ensure that questions about effective public Internet access will continue to be debated at the federal level for the foreseeable future. Nevertheless, the Commission feels strongly that these questions remain primarily issues for local assessment and decision-making. To be successful, current and future national programs for public Internet access, such as the E-Rate, need to be based on guidelines for effective public Internet access that allow for the wide variation in local resources and requirements.
The Commission will lead a dialog among state and local governments about how to implement and measure effective public Internet access in light of varying local conditions, such as the degree of existing Internet access among the populations served.
,GHQWLI\LQJ3ROLF\4XHVWLRQVDQG3URPRWLQJ$GGLWLRQDO5HVHDUFK
The 1998 survey only touched on the degree to which libraries have put in place Internet capabilities to serve the physically disabled34 and did not provide an adequate basis for drawing conclusions in this area. Additionally, while the survey included the population density near the library building in general terms (urban, suburban or rural), it did not address the size of the population served by each library. It is reasonable to assume that library capacity for public Internet access should be proportional to the population to be served, although other local factors, such as the penetration of personal Internet access among library patrons, also must be considered. The survey did not provide an adequate basis for drawing conclusions in this area. These are both possible areas for inclusion in future research, whether by the Commission and its research partners or by others with an interest in these issues.
Based on the survey and other collateral information, the Commission has identified a number of questions regarding the public library as a provider of public Internet access that deserve further investigation. Future national surveys sponsored in full or in part by the Commission may be able to address some of these questions, but certainly cannot address all of them. Nevertheless, it is valuable to identify these questions in order to focus attention on the work that remains to be done in order to
34
861DWLRQDO&RPPLVVLRQRQ/LEUDULHVDQG,QIRUPDWLRQ6FLHQFH
— 16 —
implement and evaluate effective public Internet access through America's public libraries. The questions that can be addressed by surveying the libraries include the following:
• How well located are public libraries with respect to populations requiring the most assistance in obtaining Internet access, such as rural or high poverty areas or other under-served populations; and how well are libraries serving populations which lack or lag behind in Internet access?
• What effect, if any, does measured telephone service (i.e. service that incurs charges for each minute or other unit of use), or the process of establishing and maintaining a dial-up Internet connection, have on the amount and effectiveness of dial-up Internet service?
• What types of acceptable use policies are in effect in libraries and how well do those policies satisfy community concerns for protecting children from inappropriate materials available through the Internet?
• What Internet applications, content, and library staff services do public libraries deliver within the library building and via the Internet to users at home, at work, or elsewhere (e.g., database access, e-mail, and voice and/or video reference services)?
• What role do librarians play in facilitating public Internet access; what amount and type of Internet training do the library staff receive; and what training do public libraries provide to users?
• How much staff time and budget do Internet-related services consume in relationship to other library services, and what contribution does the E-Rate make to the ongoing costs of providing effective public Internet access and the related technology, applications and services?
The Commission also identified research questions that require research methods beyond an institutional survey of libraries. Such questions require resources for investigation well beyond the resources available for the Commission surveys. For example, the MCI LibraryLink® Survey referenced in Section I.4 is based on a large scale telephone survey of the general population. Questions that require research methods beyond an institutional survey of libraries include:
• To what degree do libraries continue to serve as a principal or significant public point of Internet presence; and how could the role of libraries be improved or strengthened?
• How successful are libraries in serving those who lack other means of gaining Internet access; and how could libraries be more effective in reaching under-served populations?
• How many persons receive service in library buildings and from beyond library buildings and what population groups do they represent?
• How does library public Internet access compare to other public Internet points of presence?
• What outcomes do users have from their use of the Internet via public libraries (both in buildings and from remote locations); and how do those outcomes compare with their experience with the Internet at home, at work, at school, or at other public Internet points of presence?
• How, and to what extent, do public libraries cooperate with schools and school library media centers, or other public Internet points of presence, in order to provide public Internet access?
The Commission has an interest in such questions, but recognizes both its own limited resources and the fact that many others are engaged in investigation of related topics.
0RYLQJ7RZDUG0RUH(IIHFWLYH3XEOLF,QWHUQHW$FFHVV
— 17 —
The Commission will continue to develop partnerships and cooperative relationships with federal agencies and with other organizations with similar research interests to investigate questions related to public access to the Internet and the role that libraries play in providing such access. The Commission will work with such organizations to identify relevant issues to be studied and to review the results of such research. By publicizing its own findings, placing those findings in the context of other research, and continuing to identify unanswered questions, the Commission will promote research and development on these topics when it cannot pursue them directly or through partnerships or cooperative relationships.
,9 %LEOLRJUDSK\RI2WKHU6WDWLVWLFDO6WXGLHV)XQGHGE\WKH&RPPLVVLRQ
As noted in Section I, the Commission has tracked the increasing use of the Internet among public libraries since 1994. Some of these studies were supported solely by NCLIS and others were funded jointly with the American Library Association (ALA) Office of Information Technology Policy (OITP). In each case, the contractors for the research were Dr. John Carol Bertot, now with the School of Information Science and Policy at the State University of New York, Albany, and Dr. Charles R. McClure of the School of Information Studies, Syracuse University. Entries are presented in chronological order.
• McClure, Charles R., Bertot, John Carlo, and Zweizig, Douglas L. Public Libraries and the
Internet: Study Results, Policy Issues and Recommendations. Washington, DC, NCLIS, 1994.
62 pages. http://www.nclis.gov/what/what.html.
• McClure, Charles R., Bertot, John Carlo, and Beachboard, John C. Internet Costs and Cost
Models for Public Libraries: Final Report. Washington, DC, NCLIS, 1995. 47 pages.
http://www.nclis.gov/what/what.html.
• Bertot, John Carlo, McClure, Charles R., and Zweizig, Douglas L. The 1996 National Survey
of Public Libraries and the Internet: Progress and Issues. Washington, DC, NCLIS, 1996.
67 pages. [Survey sponsored by American Library Association Office for Information Technology Policy (ALA/OITP) and the U.S. National Commission on Libraries and Information Science (NCLIS).] http://www.nclis.gov/what/what.html.
• Bertot, John Carlo, and McClure, Charles R., Policy Issues & Strategies Affecting Public
Libraries in the National Networked Environment: Moving Beyond Connectivity.
Washington, DC, NCLIS, 1997. 26 pages. http://www.nclis.gov/what/what.html.
• American Library Association, Office of Information Technology Policy, The 1997 National
Survey of U.S. Public Libraries and the Internet: Final Report. Washington, DC, American
Library Association, 1997. 100 pages. [Survey conducted by Dr. John Carlo Bertot, Dr. Charles R. McClure, and Dr. Patricia Diamond Fletcher and sponsored by the American Library Association Office for Information Technology Policy (ALA/OITP) and the U.S. National Commission on Libraries and Information Science (NCLIS).] http://www.ala.org/oitp/research/survey97.html.
• American Library Association, Office of Information Technology Policy, The 1997 National
Survey of U.S. Public Libraries and the Internet: Summary Results. Washington, DC,
American Library Association, 1997. 8 pages. [A report on a survey conducted by Dr. John Carlo Bertot, Dr. Charles R. McClure, and Dr. Patricia Diamond Fletcher