Abstract—Network devices including firewall, QoS, Anti-Virus wall, IDS and so on were developed to help administrators monitor internet usage behaviors in response to network applications. However, it requires administrators to log on different network devices for acquiring associated usage logs for further respective analysis whenever abnormal network usage behavior occurred. It is both difficult and time consuming for administrators to manage usage logs from all the devices within a network. Therefore, how to provide administrators integrated information through one single platform for more effective management and efficient data inquiry is the aim of this research. This study proposed the measure that the usage logs from network devices can be stored in the data warehouse where the necessary information within a specific timeframe was acquired by business intelligence system for further comparison and integration. It can save the time for log inquiries and assist efficient network users behavior analysis.
Index Terms—Audit, business intelligence, network security.
I. INTRODUCTION
Different brand of network equipment has its own independent log format. The manufacturers only provide the analysis database for its own products. The database contains built-in statistics data designed by manufacturers. However, such data is insufficient for administrator to execute the comprehensive management under the internet environment.
When the unusual event occurred or the need for analyzing user behaviors arose, the administrators have to query and analyze the logs manually from particular network devices as the system cannot investigate the relevance among the data retrieved from all network devices on its own [1]. Once virus attack is detected by Anti-Virus wall, administrators have to query IDS logs and investigate whether the source IP launched the attack. The administrators then have to manually query QoS logs for data regarding stream and service types and adjust the management setting to firewall. The administrators have to query the corresponding logs from different network devices and are unable to execute effective management. The process projects additional labor costs and
Manuscript received March 18, 2015; revised June 2, 2015. This work was supported in part by the Ministry of Science and Technology, Executive Yuan, Taiwan under Grant MOST 102-2410-H-015-MY2.
W. Y. Chen is with the Department of Information Management, Tatung University and also with the Department of Mass Communication, Chinese Culture University, Taipei, Taiwan (e-mail: [email protected]).
S. H. Li is with the Department of Accounting Information, National Taipei University of Business, Taipei, Taiwan (e-mail: [email protected]).
M. J. Hsiao is with the Department of Information Management, Kang-Ning Junior College of Medical Care and Management, Taipei, Taiwan (e-mail: [email protected]).
C. C. Hu is with the Department of Computer Science and Engineering, Tatung University, Taipei, Taiwan (e-mail: [email protected]).
K. C. Tu is with the Department of Information Management, Tatung University, Taipei, Taiwan (e-mail: [email protected]).
indicates that the daily maintenance is time consuming.
II. LITERATURE REVIEW
A. Business Intelligence
Business intelligence is a set of concepts, methodologies, software and processes and being broadly used in enterprise to enable more effective strategic insights and decision-making as it can transform enormous amount of information into competitive edges. The main difference among business intelligence, DSS (Decision Support System) and EIS is that business intelligence system is not only open to leaders or owners but also to managers even employees [2]. Therefore, the role of business intelligence is not only limited to act as the foundation of strategy making process but also projects the capability to data management, data analysis and data mining.
Business intelligence can help managers improve the quality of decision-making process and take adequate strategy to enhance an enterprise’s competitiveness and profitability by transforming internal and external data (both structured and unstructured) into useful information [3].
The framework of business intelligence system mainly includes the followings [4]:
1) ETL toolkit: The daily transaction data were being extracted, transformed, loaded and transferred to data warehouse.
2) Data warehouse: The data from various databases was being extracted, transformed and stored in the data warehouse. The way data being stored is according to the subject in multiple dimensional model. In short, data warehouse is the database of decision-making support system and the data was from daily transactions. 3) Business intelligence toolkit or platform:Including
on-line analysis, query, report tool, and data mining and so on. It was mainly provided to decision-making staff for analyzing the information stored in the warehouse. It can be used as a tool of toolbox or serve as the basis for developing application software [5].
B. Data Warehouse
Srivastava and Chen defined data warehouse as a type of database. It once the inquiry occurred from local terminal but not resource of data [6]. Inmon (2005) defined four features of data warehouse including subject-oriented, integration, time-variation, non-volatilization [7]. Ralph Kimball (2002) defined data warehouse as “a copy of transaction data specifically structured for query and analysis”. Ralph Kimball took the function of data warehouse as a start point and made no limitations to the data stored in the data warehouse [8]. Therefore, the most significant difference between Inmon and
Network Security Analysis by Using Business Intelligence
Kimball is the thoughts about the data storage model in the data warehouse. Inmon believed that the data stored in the data warehouse should be kept in traditional model where Kimball proposed the dimensional model. Table I showed the difference between these two approaches [9].
TABLEI:APPROACH COMPARISON (BILL INMON VERSUS RALPH KIMBALL)
Item Bill Inmon Ralph Kimball
Data warehouse model Traditional (ERDs, DISs) Dimensional The relationship between data warehouse and data
marts
Data mart is a layer of data warehouse
Data warehouse is composed of multiple data marts
Coverage Broad Narrow
Concept Theoretical Practical
III. NETWORK SECURITY ANALYSIS FRAMEWORK
A. Network Log Analysis
How to acquire and investigate network device logs for administrators has been an important issue under the current network environment. The current log analysis products and the business intelligence application used in this research were discussed below.
Existing log analysis products
IT vendors have already introduced a variety of products that can analyze and integrate logs from various kinds of devices and in different formats [10]. The products can be divided into two categories.
1) The product that can integrate related logs generated by
products in the same brand. However, the major flaw of such a product is that it cannot integrate logs generated by devices in other brands. Under usual activity investigation and network management, it will cost administrator valuable time to query logs from devices in other brands and analyze the logs manually whenever the unusual activity analysis is required [11].
2) The product that can analyze logs from major brands products. Nevertheless, such a product is still not able to integrate logs from minor or other brands products. Once the device logs cannot be recognized by the product, the users are required to wait for the update release. 3) Analyze device logs with business intelligence system.
Business intelligence tools were used to analyze internet behavior data in this research. The data from various devices was loaded into data warehouse by extraction, transform and load process by ETL tools and allow administrator to analyze internet behavior in an interactive manner with business intelligence models [12]. In addition, the data required for administrators to analyze was provided in flexible operation mode through single platform where the limitation for utilizing logs in different formats is removed.
B. Data Warehouse Design
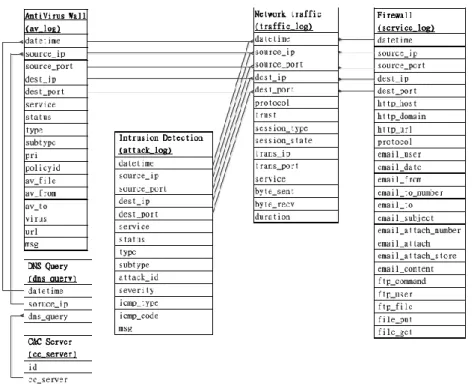
The database model and framework design is finished in this stage, which includes defining and naming columns, database environment setting, and data indexing. Six logs were used for recording data from QoS utilization log, QoS stream log, Anti-Virus wall, IDS, DNS Query Log and C&C Server as illiustrated in Fig. 1 and each log was discussed below.
Fig. 1. A snowflake schema includes logs from QoS, anti-virus wall, IDS, DNS and C&C server.
1) The av_log (anti-virus wall) documented the stream and the virus attack. It can also distinguish the virus species and the service used.
2) The attack_log (IDS) records stream in and out of the device and can analyze the type of internet attack.
3) The service_log (QoS) documented detailed information regarding HTTP, POP3, SMTP, FTP and Telenet behavior like the stream used by visiting website with HTTP service.
information including the size of packets, usage time, ource IP, source port, destination IP, destination port, service and so on.
5) The dns_query (DNS server) recorded information including usage time, Source IP, dns_query when users using webpage service.
6) The cc_server (C&C Server) is responsible for controlling the whole botnets and send batterer’s script to botclient. The log stored the known harmful C&C Server addresses.
C. Network Behavior Analysis
Business intelligence system can use for investigating internet behavior. Analyzing various network devices logs by business intelligence system through single platform. The internet usage behavior analyzed by business intelligence system was discussed below.
1) HTTP/HTTPS virus attack analysis 2) Email virus threat analysis
3) FTP virus attack analysis
4) Virus source IP and internal destination IP traffic analysis 5) TOP N virus source IP and internal destination IP
analysis
6) The ranking of virus internet service types 7) The ranking of Anti-Virus wall file name 8) TOP N source IP internet attack analysis 9) TOP N internet attack mode analysis 10)Protocol used in internet attack analysis 11)Unusual internal IP connection analysis 12)Unusual destination IP connection analysis 13)Bandwidth usage analysis
14)TOP N IP service usage and traffic analysis 15)TOP N WEB service usage analysis 16)TOP N EMAIL service usage analysis 17)TOP N FTP service usage analysis
18)Employees internet usage behavior analysis
The administrators can analyze infected IP stream with HTTP/HTTPS/FTP/EMAIL behaviors by Anti-Virus wall logs and QoS stream through business intelligence single management platform when virus attack occurred.
19)Botnets virus analysis
Botnets have been the common network attack mode with no effective preventive measures. When a computer within a network becomes compromised, it will keep make unusual inquires to DNS server. The business intelligence tool can be utilized to query logs from Anti-Virus wall, DNS and C&C server for investigating if DNS keeps querying logs from C&C server. The results can be provided to administrators as an reference for adjust blocking policy.
IV. CASE ANALYSIS
A. System Environment and Network Infrastructure The data used in this research for practice and analysis was obtained from QoS log, IDS log, Anti-Virus wall log and DNS server query log at Tatung University campus by Aug. 23, 2010. The internet framework and device logs are being discussed below.
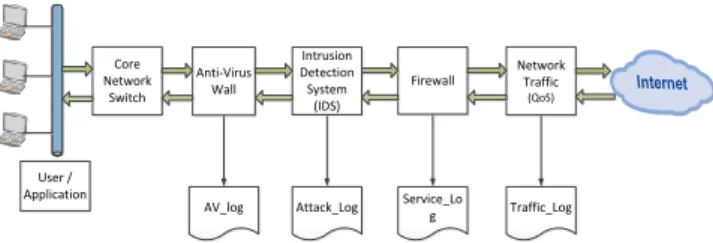
Whenever the internal user (IP) need the access to the
internet, the traffic was put through the marginal switch connected to the core network switch and vice versa and Anti-virus wall detect the presence of virus after the exchange of IP routing. If the test results came back normal, the intrusion Detection system (IDS) will confirm whether there is potential internet attack and Anti-Virus wall will evaluate if IP complies with Anti-Virus wall policy. In addition, QoS will monitor the traffic and record internet usage behavior. The external users (EP) also need to be checked by all the devices if they need access to campus network (as illustrated in Fig. 2). Core Network Switch Anti-Virus Wall Intrusion Detection System (IDS) Firewall Network Traffic (QoS) AV_log User / Application
Attack_Log Service_Log Traffic_Log Fig. 2. Network stream access flowchart.
B. Data Warehouse Construction
The establishment of data warehouse and setting was accomplished in this stage. The data from Anti-Virus wall, IDS, QoS, DNS server log and C&C server logs were being extracted, transformed and loaded into MS SQL 2005 database. The connections between columns were defined and formed by SAP Universe Builder software.
The raw data being extracted, transformed, and loaded into data warehouse in this phase. The data need to be transformed after the extraction and the load process was divided into two different procedures including the first time device information load and routine load of information thereafter. ESF database migration software was used in this research to transform and load QoS, IDS, Anti-Virus wall and DNS query logs from various database into MS SQL 2005. The scheduled off-peak time of day routine
C. Network Behavior Analysis
The SAP Web Intelligence Client front-end tools were incorporated with SAP Universe Builder to form connection between columns from logs for analyzing internet usage behavior. The characteristics of each network behaviors analysis were discussed below.
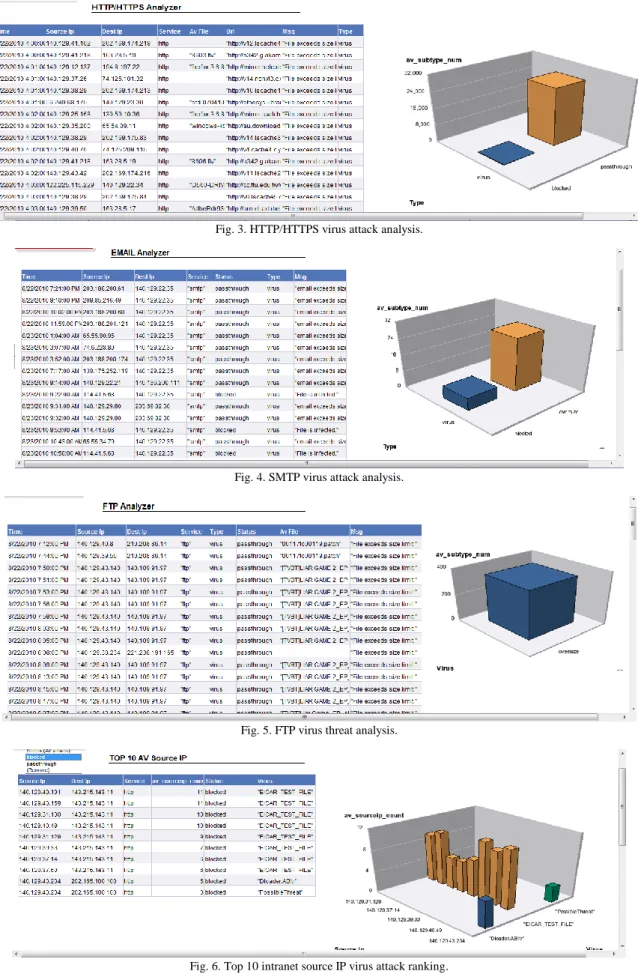
1) HTTP/HTTPS virus attack analysis
Querying columns including time, source_ip, dest_ip, service, av_file, msg and type from dbo.0823_av for inquiring the source IP, infected file name and virus species by utilizing business intelligence tool to analyze HTTP/HTTPS internet applpication behavior. A statistics chart was used to demonstrate the number of HTTP/HTTPS usage infection within a specific timeframe as shown in Fig. 3.
2) Email virus threat analysis
Analyze email internet application behavior by querying columns including time, source_ip, dest_ip, service, av_file, msg and type from dbo.0823_av log with business intelligence tool for investigating the affected file name and type. A statistics chart was used to exhibit the number of email virus attacks within a specific timeframe as shown in Fig. 4.
Fig. 3. HTTP/HTTPS virus attack analysis.
Fig. 4. SMTP virus attack analysis.
Fig. 5. FTP virus threat analysis.
Fig. 6. Top 10 intranet source IP virus attack ranking.
3) FTP virus attack analysis
Analyze FTP internet application behavior by querying columns including time, source_ip, dest_ip, service, av_file, msg and type from dbo.0823_av log with business intelligence tool for investigating the affected file name and type. A statistics chart was used to exhibit the number of virus
attacks within a specific timeframe as shown in Fig. 5. 4) Top 10 intranet virus attack ranking
Querying log (dbo.0823_av) from Anti-Virus wall stored in data warehouse to analyze top 10 blocked source IPs responsible for virus attack and the result was illustrated in statistics chart as shown in Fig. 6.
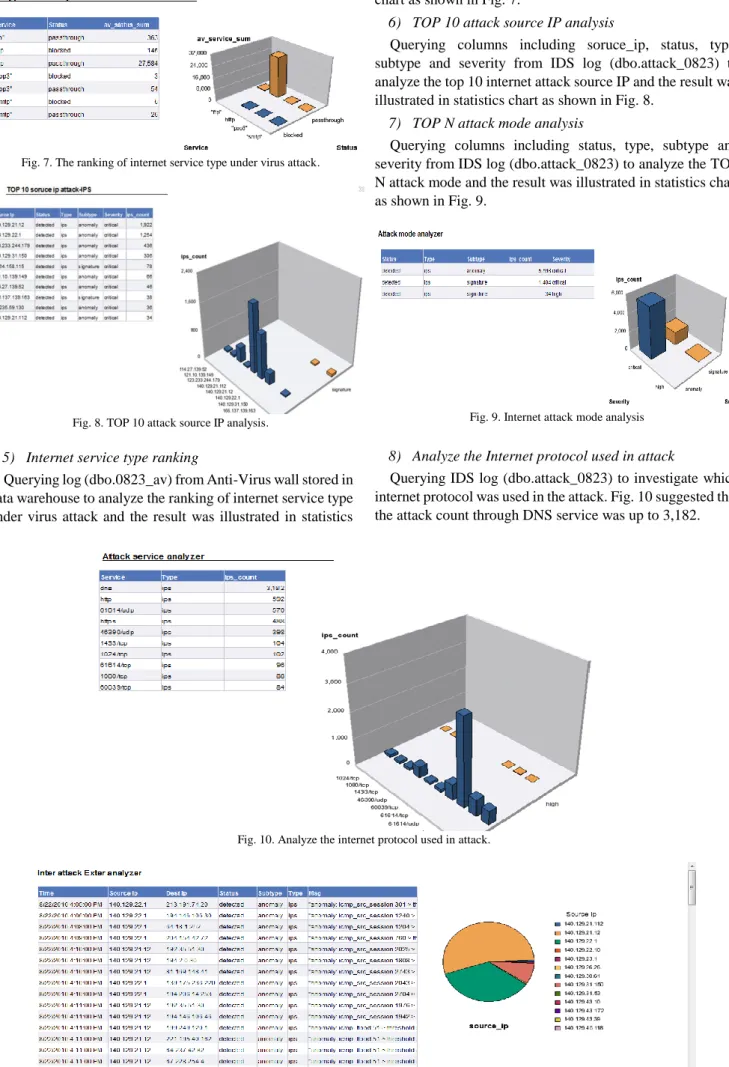
Fig. 7. The ranking of internet service type under virus attack.
Fig. 8. TOP 10 attack source IP analysis.
5) Internet service type ranking
Querying log (dbo.0823_av) from Anti-Virus wall stored in data warehouse to analyze the ranking of internet service type under virus attack and the result was illustrated in statistics
chart as shown in Fig. 7.
6) TOP 10 attack source IP analysis
Querying columns including soruce_ip, status, type, subtype and severity from IDS log (dbo.attack_0823) to analyze the top 10 internet attack source IP and the result was illustrated in statistics chart as shown in Fig. 8.
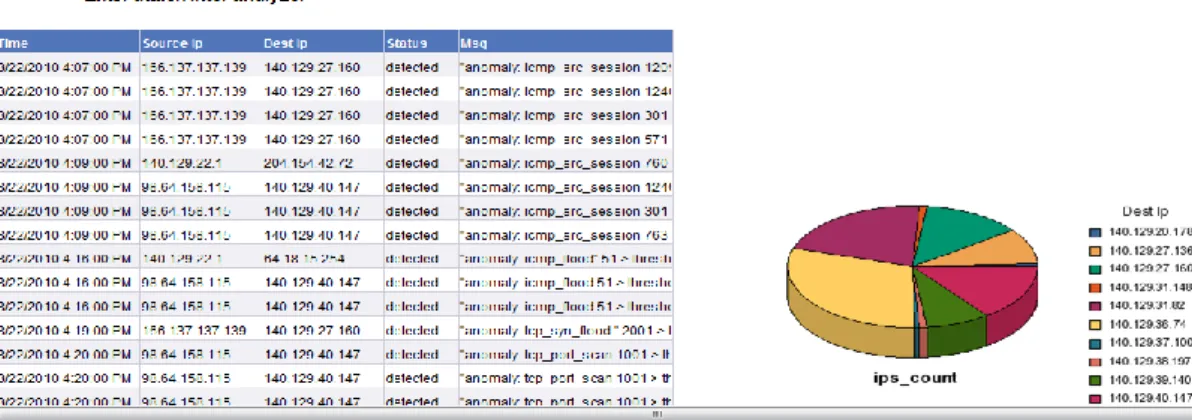
7) TOP N attack mode analysis
Querying columns including status, type, subtype and severity from IDS log (dbo.attack_0823) to analyze the TOP N attack mode and the result was illustrated in statistics chart as shown in Fig. 9.
Fig. 9. Internet attack mode analysis
8) Analyze the Internet protocol used in attack
Querying IDS log (dbo.attack_0823) to investigate which internet protocol was used in the attack. Fig. 10 suggested that the attack count through DNS service was up to 3,182.
Fig. 10. Analyze the internet protocol used in attack.
Fig. 12. Unusual destination IP connection analysis.
9) Unusual intranet IP connection analysis
Querying columns including time, source_ip, dest_ip, status, subtype, type and msg from IDS log (dbo.attack_0823) to investigate the attack originated from intranet. As illustrated in Fig. 10, the internal IP 140.129.21.12 used connection to launch attack to multiple external IPs. The report was sent to administrators as a reference for investigating whether the system is planted by malicious software or the attack was launched by individuals (refer to Fig. 11).
10) Unusual destination IP connection analysis
Querying IDS log (dbo.attack_0823) and discovered that the IP 140.129.36.74 being attacked counted the most. The administrator should take necessary relevant measures to prevent the server from damage caused by the attacks (as illustrated in Fig. 12).
11) Bandwidth usage analysis
Querying QoS log (dbo.v_log_traffic_all) for investigating the top 10 bandwidth usage IPs and provide the results to administrators as a reference for monitoring the intranet usage (refer to Fig. 13).
Fig. 13. Bandwidth usage analysis.
Fig. 14. Top 10 web service usage analysis.
12) Top 10 web service usage analysis
Querying QoS log (dbo.v_log_traffic_all) for investigating the top 10 IPs using HTTP service and the result was provided to administrators for helping monitor the bandwidth used by HTTP service (as shown in Fig. 14).
13) Top 10 email internet service analysis
Querying QoS log (dbo.v_log_traffic_all) for investigating top 10 IPs using SMTP and POP3 service and the result was provided to administrators for helping monitor the bandwidth used by SMTP and POP3 service (as illustrated ub Fig. 15 and Fig. 16).
Fig. 15. SMTP internet service usage analysis.
Fig. 16. POP3 internet service usage analysis.
14) Top 10 FTP internet service usage analysis
Querying QoS log (dbo.v_log_traffic_all) for investigating top 10 IPs using FTP service and the result was provided to administrators for helping monitor the bandwidth used by FTP service (as illustrated in Fig. 17).
D. Advance Network Behavior Analysis
The databases from all network devices was loaded to data warehouse through ETL and incorporated with business intelligence system to integrate the relevant logs for analyzing
internet usage behavior as discussed below.
Fig. 17. FTP internet service usage analysis.
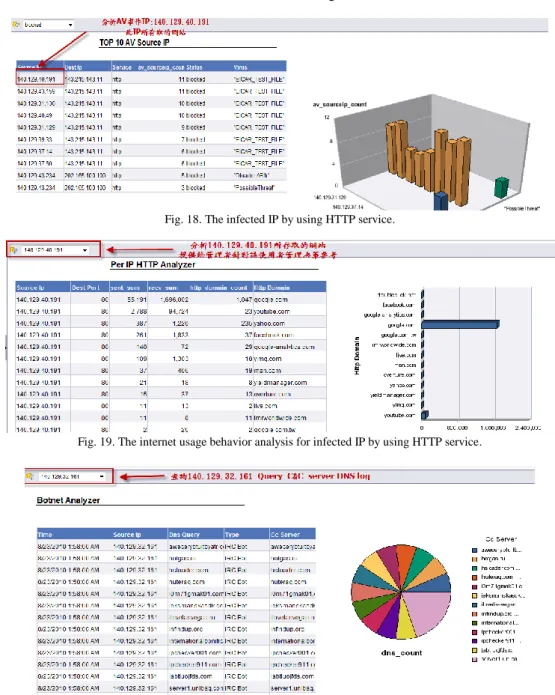
1) Analyze virus infected IP through HTTP service internet usage behavior
In the past, administrators needed to locate the infected IP using HTTP service and accessed to QoS logs for investigating if the websites violated the internet usage policy. However, this management measure projected great burden on administrators. With the aid of business intelligence system, administrators can now effectively locate HTTP
access record from infected IP. The information contained in Anti-Virus wall log (dbo.0823_av) can provide administrators the references for making management policy decisions. As illustrated in Fig. 18 and Fig. 19, IP 140.129.40.191 was analyzed to investigate the domain and bandwidth it accessed to websites.
2) Botnets virus behavior analysis
Botnets can be manually analyzed to prevent Client keeps querying data from DNS and compared with the known list from C&C server for indentification. The internet also blocked the infected computer to reduce the level of effect and cost. However, the manual comparison is a time consuming task for administrators and adapting business intelligence system can locate infected computer effectively. The Anti-Virus wall log (dbo.0823_av) was queried in this research for retrieving dbo.dns_query log and C&C Server(dns.cc_server) log to analyze if infected computer has already queried C&C Server for list during the specific timeframe. Take IP 140.129.32.161 as an example, it has already queried known C&C server lists (as shown in Fig. 20 and Fig. 21).
Fig. 18. The infected IP by using HTTP service.
Fig. 19. The internet usage behavior analysis for infected IP by using HTTP service.
Fig. 20. Botnet infection analysis.
V. CONCLUSION
The business intelligence system was mainly used in transaction data and strategy analysis systems but not internet usage behavior management. The main advantage of business intelligence system is it can extract and integrate raw data for preserving the correct and decision-making relevant information as a comprehensive database for future decision-making software. This study investigated the significance of business intelligence system and adapted it to construct application models for practical analysis.
The main aim of this research is to load various network device logs into data warehouse through ETL tools and generate charts to analyze intranet usage behavior by adapting business intelligence system. In addition, only one system platform was used for querying all device logs, which enabled more efficient management and provided administrators a foundation for establishing management policies.
The logs from network devices used in this research only include Anti-Virus wall, IDS, QoS and DNS server only contains record for one day. The benefits may only being partly illustrated in this research as the timeframe of data is short and devices are not abundant.
The result of this research was mainly applied to internet usage behavior management. The future researchers are advised to integrate more device logs with business intelligence system to further analyze security issues for offering administrators important reference for effective management.
REFERENCES
[1] A. D. Kent, L. M. Liebrock, and J. C. Neil, “Authentication graphs:
Analyzing user behavior within an enterprise network,” Computers &
Security, vol. 48, pp. 150-166, 2015.
[2] R. Sharda, D. Delen, E. Turban, J. Aronson, and T. P. Liang, Businesss
Intelligence and Analytics: Systems for Decision Support-(Required),
Prentice Hall, 2014.
[3] D. D. Wu, S. H. Chen, and D. L. Olson, “Business intelligence in risk
management: Some recent progresses,” Information Sciences, vol.
256, pp. 1-7, 2014.
[4] C. M. Olszak and E. Ziemba, “Approach to building and implementing
business intelligence systems,” Interdisciplinary Journal of
Information, Knowledge, and Management, vol. 2, pp. 134-148, 2007.
[5] H. Chen, R. H. Chiang, and V. C. Storey, “Business intelligence and
analytics: From big data to big impact,” MIS Quarterly, vol. 36, no. 4,
pp. 1165-1188, 2012.
[6] J. Srivastava and P. Y. Chen, “Warehouse creation—a potential
roadblock to data warehousing,” IEEE Transactions on Knowledge
and Data Engineering, vol. 11, no. 1, pp. 118-126, 1999.
[7] W. H. Inmon, “The data warehouse and data mining,”
Communications of the ACM, vol. 39, no. 11, pp. 49-50, 1996.
[8] R. Kimball, The Data Warehouse Lifecycle Toolkit: Expert Methods
for Designing, Developing, and Deploying Data Warehouses, John
Wiley & Sons, 1998.
[9] T. Ariyachandra and H. J. Watson, “Which data warehouse
architecture is most successful?” Business Intelligence Journal, vol. 11, no. 1, p. 4, 2006.
[10] T. A. Peters, “The history and development of transaction log
analysis,” Library Hi Tech, vol. 11, no. 2, pp. 41-66, 1993.
[11] H. Hochheiser and B. Shneiderman, “Using interactive visualizations
of WWW log data to characterize access patterns and inform site
design,” Journal of the American Society for Information Science and
Technology, vol. 52, no. 4, pp. 331-343, 2001.
[12] A. Abraham, “Business intelligence from web usage mining,” Journal
of Information & Knowledge Management, vol. 2, no. 4, pp. 375-390,
2003.
Wei-Yu Chen is a lecturer in the Department of Computer Science and Mass Communication in Chinese Culture University, Taiwan. He received his master’s degree in information management from Chinese Culture University, Taiwan in 2005. He is reading doctoral in the Department of Computer Science and Engineering in Tatung University. His research interests include information security, mobile learning, mobile commerce, image processing, network management, and digital archive.
Shing-Han Li is an associate professor in the Department of Accounting Information in National Taipei University of Business, Taiwan. He received his Ph.D. degree in information management from National Chung-Cheng University, Taiwan, 2006. His current research interests include service quality, ERP system, web services and information auditing and assurance. He has published his work in ACM Transactions on Management Information Systems, Journal of Computer Information Systems, Journal of Database Management, Information Systems Frontiers, Information and Software Technology, Computers in Human Behavior, Computers in Industry, Computer Standards & Interfaces, Industrial Management & Data Systems, Total Quality Management & Business Excellence, Production Planning & Control and Journal of Medical Systems.
Mann-Jung Hsiao is an assistant professor in the Department of Information Management at Kang-Ning Junior College of Medical Care and Management, Taiwan. She received her Ph.D. degree in computer science and engineering at Tatung University, Taiwan. Her research interests include image retrieval, data mining, and neural networks. She received her M.S. degree in computer engineering from the Pennsylvania State University.
Chung-Chiang Hu is a Ph.D. program student of Department of Computer Science and Engineering in Tatung University, Taiwan. He received his M.S. degree in the Graduate Institute of Communication Engineering from Tatung University, Taiwan in 2002. His current research interests include real-time network device control and monitoring, network security, information security audit and data mining.
Kuo-Ching Tu is currently working for Network Security Consultant of EZHI Technologies, Inc., Taiwan. He received his master degree in Information Management from Tatung University in Taiwan in 2011. His research interests include network management, data mining, and information auditing & security.