cinitapride in bulk & tablets
Atta-ur-Rehman
1, Anwar Ejaz Beg
1, Rabia Bushra
2*, Maria Ashfaq
1,
Farya Zafar
3, Huma Ali
4and Mehwish Rizvi
21Department of Pharmaceutics, Faculty of Pharmacy, Ziauddin University, Karachi, Pakistan
2Department of Pharmaceutics, Dow College of Pharmacy, Dow University of Health Sciences, Karachi, Pakistan 3Department of Pharmaceutics, Faculty of Pharmacy, University of Karachi, Karachi, Pakistan
4Department of Pharmaceutics, Faculty of Pharmacy, Jinnah Sindh Medical University, Karachi, Pakistan
Abstract: A simple stability indicating UV-spectrophotometric method has been developed and validated for the determination of cinitapride hydrogen tartrate (CHT) in bulk and solid pharmaceutical dosage form. Drug absorption was measured in different analytical mediums however; maximum absorption was seen in 0.1 N HCl at wavelength (λmax) of 266 nm. The calibration curve was found to be linear over the concentration range from 6 to14µg/mL with the correlation coefficient value (r) of 0.999. The LOD and LOQ were estimated to be 0.1019µg/ml and 0.309µg/ml
respectively. The accuracy was evaluated by determining the percent drug recovery, performed at three different levels of 50%, 100% and 150%. The% recovery was found to be in the range of 99.96–100.64%. The precision of the method was determined by inter-day and intra-day variations. The % RSD value <0.5 indicates the underlying method is precise and accurate as well. The developed method was applied to characterize in vitro assay content of few brands of cinitapride (1 mg) available in local market. No interference of the formulation excipients with the drug absorption was observed during assay. Drug substance and drug product were exposed to various stressed conditions (acid, base, oxidative, thermal and photolysis). Forced degradation testing of drug product showed that the oxidation (20%) was found to be the major degradation pathway of the cinitapride. However; drug estimation was not influenced in presence of degradation moieties formed during acid, base, oxidation, thermal and photolytic breakdown. Overall, the investigated technique is robust and specific that would be successfully used to quantify the cinitapride hydrogen tartarate in pharmaceutical dosage and bulk form in future.
Keywords: Cinitapride hydrogen tartarate, assay, stability indicating method, UV-spectrophotometer, tablet assay.
INTRODUCTION
Cinitapride is chemically a 4-amino - N-[1-(1-cyclohex-3enylmethyl)-4-piperidyl]-2-ethoxy-5-nitro- benzamide yellowish crystalline powder. It belongs to the benzamide class that known to be a potent gastro enteric prokinetic agent (Robert et al., 2007). It is freely soluble in
methanol, chloroform and soluble in water. The molecular formula of the drug is C21H30N4O4 with a molecular weight of 1 402.49 g.mol (Lahari et al., 2012).
Being a strong gastro-prokinetic and anti-ulcer agent it has been prescribed widely for the potential treatment of functional dyspepsia (FD)and gastro-esophageal reflux disease (GERD), irritable bowel syndrome, and abdominal discomfort (Du et al., 2014; Marcelín-Jiménez et al., 2017; Roy et al., 2008). Pharmacologically
activates the myenteric nerve plexus of gastro-intestinal region and promotes the release of acetylcholine that favors the propulsive movement of GIT. It is an agonist of 5-HT4 and 5-HT1 receptors while 5-HT2 receptor antagonist. Moreover; the anti-dopaminergic activity additionally improves the efficiency of the drug (Du et al.,
2014; Baqai et al., 2013).
Different analytical techniques to determine the content of cinitapride (pure or combination) in solvent and plasma medium have been reported. The common estimation procedures used in pharmaceutical industries and researches include extraction polarography (Martı́n et al.,
1998), RP-HPLC (Roy et al., 2010; Humaira et al., 2011;
Ahir et al., 2014), LC-MS/MS (Roy et al., 2008) and
UV-Vis spectrophotometeric methods (Thangabalan and Kumar, 2012) methods. Among the mentioned analytical techniques, UV spectrophotometric analysis is still considered to be the simple, easier, and cost effective way of drug content estimation for pharmaceuticals. (El-Kafrawy et al., 2017; Naz et al., 2014; Shah et al., 2011).
Although the few spectrophotometric procedures have been developed by different researchers in past but these methods were based on the extraction (Unnisa et al.,
2014; Thangabalan et al., 2010) and diazotization of CHT
(Thangabalan and Kumar, 2012; Basnet et al., 2014)
using many chemical reagents and seems to be relatively complicated, expensive and time consuming. In the present work simple, specific and precise stability indicating UV spectrophotometric method using single solvent medium (blank) has established for the sole quantification of cinitapride hydrogen tartrate in bulk and *Corresponding author: e-mail: [email protected]
solid dosage form as per ICH recommendation (ICH, 2005).
MATERIALS AND METHODS
Instrumentation
Digital analytical balance (Sortorious, Japan), Ultrasonic cleaner (Elma; America), pH meter (Mettler Toledo, Switzerland) andUV-visible spectrophotometer, model UV 1800 (Shimadzu, Japan) with 1cm matched open top UV quartz cells (Germany), general oven (Heratherm
OGS 100 Thermo Electron LED, GmbH) were used.
Materials
Chemicals/ Reagents
Cinitapride hydrogen tartarate pure and working standard were gifted by AGP Limited, Karachi Pakistan. Commercial tablets of cinitapride (Cidine 1mg; Highnoon Laborites; Pakistan) were purchased from the local market.
Hydrochloric acid, sodium acetate, potassium dihydrogen phosphate, potassium hydroxide and sodium hydroxide and hydrogen per oxide were of analytical grade and procured from the Merck KGaA Darmstadt 6427 Germany.
Method
Selection of medium
The absorbance of the drug was analyzed in common analytical mediums including 0.1N HCl (pH 1.2), acetate buffer (pH 4.5), phosphate buffer (pH 6.8) and distilled water (pH 7.0). All solutions were prepared as per USP recommendations (USP, 2017). Drug solutions were scanned between 400nm to 200 nm wave length to identify the optimized solvent system with maximum absorption.
Preparation of stock solution
Accurately weighted 27.5 mg of cinitapride hydrogen tartarate pure (equivalent to 20mg of cinitapride) was transferred into a 100mL volumetric flask, stirred the solution by adding 20mLof 0.1N HCl manually for 5minutes then sonicated for 2 minutes. The volume was makeup with the same solvent to give a concentration of 200µg/mL.
Selection of Wavelength for Cinitapride Hydrogen Tartarate
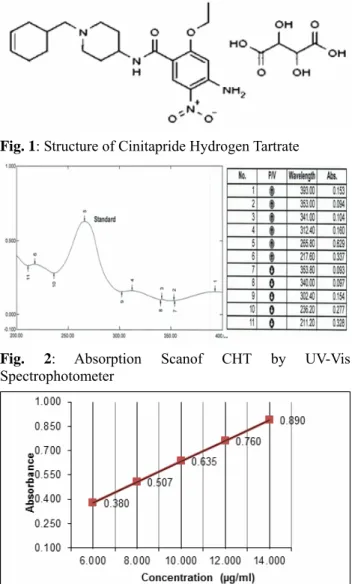
5mL of standard stock solution of CHT was transferred into 100 mL volumetric flask, making the volume with 0.1N HCl giving a concentration of 10µg/mL. The resulting solution was scanned using UV-visible spectrophotometer to 200-400nm. Drug scan showed a maximum absorbance at wave length of 266nm (fig. 1).
Method validation
Validation is one of the most important steps in method development for analytical determinations. To
various validation testing parameters were evaluated according to the ICH guidelines given in the document “validation of analytical procedures Q2 (R1)” (ICH, 2005). These parameters are mentioned briefly as;
Linearity
From the stock standard solution (200µg/mL) various calibration standard solutions having strength of 6, 8, 10, 12 and 14µg/mL were prepared. The absorbance of these solutions was recorded at 266nm wavelength. The calibration plot (Beer’s Lambert graph) was constructed using concentration vs. absorbance of each solution. The linear regression correlation value (r) for linearity should
be close to the value 1.
Detection Limit (DL)
It is computed using the standard deviation of the response and the slope and be expressed as:
DL = 3.3 σ/ S (Eq. 1)
Where σ = the standard deviation of the response S = the slope of the calibration curve
Quantitation Limit (QL)
Limit of quantification is estimated by slightly modifying the equation 1 as;
QL = 10 σ /S (Eq. 2)
Selectivity/ specificity
Specificity is basically performed to test the analyte in the presence of other components including formulation ingredients, contamination and degradation analytical moieties. For this purpose CHT solution of strength 10 µg/mL was made. Placebo solution was also prepared by adding common formulation ingredients that were previously scanned individually between 200-400 nm. The excipients contained in placebo solution were include mannitol, microcrystalline cellulose (avecil PH 102), colloidon silicon dioxide (aerosil200), povidone K30, crospovidone, magnesium stearate, aspartame and mint flavor. Selectivity was examined by scanning the CHT solution (10µg/mL) and placebo solution at same wavelength. Interference and noises were observed carefully around the peak of the drug.
Precision
Precision of the newly developed technique was confirmed by conducting the intra-day (repeatability) and inter-day (Reproducibility) testing of the CHT samples. Twenty tablets of locally available brand were crushed to fine powders and the assay of six replicates of sample tablets (75 mg of crushed powder in 100mL) was assessed. Precision was evaluated by estimating the quantity of drug per tablet and the % assay at different time interval and by different analyst as well. According to the official limit the % relative standard deviation (RSD) is less than 2.0%.
Table 1: Repeatability and Reproducibility of the Procedure
Intra-Day (% Assay)
Sample Analyst 1 Analyst 2 Inter-Day (% Assay)
1 100.84 100.86 99.93 2 99.74 100.97 100.92 3 100.53 100.95 100.83 4 100.33 100.34 100.68 5 99.98 100.24 100.17 6 100.14 100.44 100.13 % Mean Assay 100.26 100.63 100.44 %RSD 0.394 0.328 0.414 Table 2: Accuracy of the Analytical Technique
Sample Recovery Level of Amount of CHT added (mg) Quantity of CHT Estimated % Recovery Recovery (%) Mean SD RSD %
1 13.4 13.48 100.64 2 13.8 13.87 100.54 3 50% 13.7 13.7 100.01 100.40 0.3378 0.3365 4 27.8 27.83 100.12 5 27.7 27.92 100.80 6 100% 27.3 27.48 100.69 100.54 0.3625 0.3606 7 40.5 40.67 100.43 8 41.1 40.89 99.49 9 150% 40.0 39.98 99.96 99.96 0.4709 0.4711 Table 3: Robustness of the Cinitapride
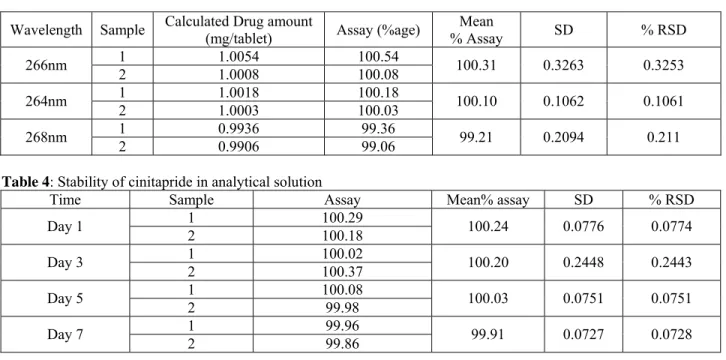
Wavelength Sample Calculated Drug amount (mg/tablet) Assay (%age) % Assay Mean SD % RSD 1 1.0054 100.54 266nm 2 1.0008 100.08 100.31 0.3263 0.3253 1 1.0018 100.18 264nm 2 1.0003 100.03 100.10 0.1062 0.1061 1 0.9936 99.36 268nm 2 0.9906 99.06 99.21 0.2094 0.211
Table 4: Stability of cinitapride in analytical solution
Time Sample Assay Mean% assay SD % RSD
1 100.29 Day 1 2 100.18 100.24 0.0776 0.0774 1 100.02 Day 3 2 100.37 100.20 0.2448 0.2443 1 100.08 Day 5 2 99.98 100.03 0.0751 0.0751 1 99.96 Day 7 2 99.86 99.91 0.0727 0.0728
Table 5: Drug Content Analysis of various Cinitapride (1 mg) Brand by newly developed method S. No. Brand Code Batch Code Manufacturing
Date Expiry Date Characteristics Physical % Assay
1 CHT-B1 171157 05-2017 05-2022 Acceptable 100.18±1.19
2 CHT-B2 072T62 11-2016 11-2018 Acceptable 101.74± 1.67
Accuracy& Recovery
Accuracy was evaluated by determining the recovery of cinitapride hydrogen tartarate at three different levels of 50µg/mL, 100µg/mL and 120µg/mL concentrations. The sample solutions were spiked with standard solutions corresponding to 50%, 100% and 150% of nominal analytical concentrations. The amount added was then assessed and amount found was calculated.
Fig. 1: Structure of Cinitapride Hydrogen Tartrate
Fig. 2: Absorption Scanof CHT by UV-Vis Spectrophotometer
Fig. 3: Calibration curve of Cinitapride Hydrogen Tartrate
Robustness
The robustness of the underlying method was evaluated by inducing small variations against the optimized wavelength (266nm ±2nm).The same assay procedure was carried to evaluate the concentration of 10µg/mL solution of cinitapride at three different wavelengths.
Solution stability
Stability of drug solution was also evaluated periodically through the same mentioned procdure for one weak.The assay of tablets was determined at 1, 3, 5 and 7 days interval.
Application of the validated analytical method for analyzing commercial brands
Three different brands of cintipride immediate release (1 mg) tablet formulations were procured from the retail pharmacy. Physical appearance, batch code, manufacturing and expiry dates of these tablets were noted. To determine the percent drug content of these formulations twenty tablets of each brand were finely powdered in mortar and then mixed. A portion of the powder equivalent to 1mg of cinitapride was transferred into a 100mL volumetric flask having 20mL of 0.1N HCl. The content of the flask was sonicated for 2 min and diluted to volume using 0.1N HCl to mark. This solution was filter through whatmann filter paper (No. 41) to obtain a clear solution. The absorbance of these solutions was measured and the amount of cinitapride per tablet was calculated using the calibration curve.
Fig. 4: Absorption overlay plot of Cinitapride standard, sample, Placebo& Blank 0.1N HCl
Fig. 5: Force Degradation Scan of Cinitapride (1mg) Product
Fig. 6: Force Degradation Scan of Cinitapride (1mg) Product
Forced degradation studies
Stress testing was conducted to examine the degradation moieties of cinitapride hydrogen tartarate produced at different extreme conditions. For this purpose acid, base, oxidation, thermal and photolytic degradation studies were performed. The acid and base degradation resistance of the drug substance and drug product was evaluated by heating the drug and sample with 1M HCl and 1M NaOH for 12 hours at 80°C respectively. Drug substance and drug product were also treated with hydrogen peroxide (3% v/v H2O2) at 80° for 12 hours to analyze oxidative degradation products. Effect of Photolytic action was determined by keeping the pure drug powder and the drug product under direct sunlight radiations for the same time duration as others. Thermal degradation was evaluated by heating the drug and drug product at 80°C for 12 hours. The placebo was also subjected to the similar stress conditions to minimize the excipients’ responses to the forced degradation conditions. For analysis these drug solutions (pure and drug product) were cooled to room temperature, neutralized by adding 5ml of NaOH/HCl and then diluted with the blank medium (0.1N HCl) to furnish 10 µg/ml of solution. Moreover; hydrogen per oxide was also added in blank solution used for drug concentration dilution to nullify the absorption of the said chemical. Finally content of the pure drug and the product was calculated using the newly developed UV-Visible spectrophotometer.
RESULTS
Method development and validation
The assay of cinitapride hydrogen tartarate (bulk and pharmaceutical dosage form) was effectively determined by simple technique of UV-spectrophotometry using single solvent system comprising of 0.1 N HCl (pH 1.2). fig. 2 demonstrates the absorption maxima of the standard drug solution with corresponding absorption values at different wavelengths. The overlay plot of the standard drug solution, sample drug solution, placebo and the blank (0.1 N HCl) is shown in fig. 4.The scan of standard and the sample drug is overlapping to each other indicating the similarity of the absorption profile. Placebo solution containing various excipients exhibited no absorbance at detecting drug wavelength (266 nm) hence confirming the absence of interference of excipients. The linear calibration curve was plotted at different drug concentrations of 6, 8, 10, 12 and 14µg/mL. The coefficient correlation (r2) of the procedure was computed
as 0.9999 (fig. 3) with a regression equation of Y=0.127+0.252. The slope, intercept and standard error values of the calibration plot were 0.0063, -0.0021 and0.0019 respectively. The limit of detection and limit of quantitation were calculated to be 0.1019 µg/ml and 0.309 µg/ml correspondingly. The percent relative standard deviation (%RSD) of the intra-day repeatability and inter-day reproducibility of the procedure were found to be
0.653 and 0.844 respectively. The accuracy of the method was also fall within the official limits (98% – 102%) with %RSD value of 0.429. Excellent recovery of the drug solutions were observed (99.49%-100.80%) during method validation testing. The method also withstands its measuring capacity against minor changes of wavelength. Drug samples solution were also found to be stable when assessed over long time period (7 days) at normal storage conditions.
Quantification of commercial cinitapride tablets (1 mg)
The investigating method showed the easy and rapid determination of drug content of CHT in various commercial products. Interference of excipients was not even seen during the estimation of cinitapride present in immediate release formulations. The mean percent drug assay of different tablets was quantified as 100.18± 1.19, 101.74 ± 1.67, and 91.40 ± 1.39 for CHT-B1, CHT-B2 and CHT-B3 respectively.
Forced degradation studies
Drug substance in pure form was found to be highly stable upon exposure of various stressed conditions. Maximum of 1.73% degradation was observed by oxidative pathway. However; drug product exhibited degradation of various intensities. Major degradation up to 20% was observed by oxidation, 9.4% by photolytic treatment and 5.33% by acid action. Moreover; thermal and basic degradation was found to be mild and estimated to be 4.29% and 4.04% correspondingly. Fig. 4 showed the degradation of cinitapride in drug product occurred at various stressed conditions. Fig. 5 illustrates the comparative degradation pattern of cinitapride in pure and product forms.
DISCUSSION
Cinitapride hydrogen tartarate is relatively a new gastro-prokinetic agent, commonly used to treat GERD problems globally. Different pharmaceutical industries of the world are manufacturing CHT immediate release product. The drug estimation is one of the significant parameter contributing to the quality of the pharmaceutical formulations. Various methods of drug quantification have been documented for CHT. Spectrophotometric approach is one of the cheapest, time saving and easiest technique of evaluation among others. Simple and rapid assays methods are always considered to be valuable and being extensively utilized for routine quality control testing of drugs by pharmaceutical sectors (Afieroho et al., 2011).
Various studies have been documented for the in vitro estimation of cinitapride in pure and dosage forms. A study was conducted in 2013 to determine the amount of CHT by spectrophotometer at wavelength of 442 nm to 552 nm. Authors have suggested three different schemes based on diazotization and coupling reactions. However;
all drug assay methods were validated and found to be appropriate (Satyanarana and Rao, 2013). Although the reported technique was quite simple but the procedure was lengthy, utilizing various chemicals for diazotization and coupling reactions as well. To overcome the complexity of the mentioned procedure a simple multi-component spectrophotometric analysis was developed for cinitapride content assessment in bulk and pharmaceutical dosage forms. Drug solutions of various strengths in 0.1 N HCl have exhibited sharp peaks at 266 nm wavelength. Calibration plot illustrates the linearity at various drug levels with higher correlation value of 0.9999. It was also observed that small amount of drug amount was determined accurately and precisely with consistent measurement even when estimation was made by second analyst (inter-day variation test). Moreover; small adjustment in wavelength did not affect the drug’s estimation as well and hence the method proves its ruggedness and robustness.
The method was applied for in vitro assay of three different CHT immediate release tablet brands. The drug absorption was found to be unchanged and the quantification was done without interruption of adjuvants. Therefore, the method has proved its selectivity as the common added pharmaceutical excipients used for solid dosage formulation exhibited no absorbance in the vicinity to the peak of the drug.
Forced degradation studies are recommended for the identification of destructive drug pathways, intrinsic drug stability and for development of stability indicating assay techniques. In the present study, the dominant degradation pathway of the drug was estimated by subjecting the drug substance and the product to various stressed conditions. The major route of drug degradation was found to be oxidation both in pure and drug product form. Drug product has exhibited about 20% degradation when treated with hydrogen per oxide. This higher degradation is however supported by the past study. It was documented in an investigation that the cinitapride degradation was observed to be chiefly induced by oxidation (34%) and then decomposition by hydrolysis to about 21% (Bhagavanji, 2013). In the current study, cinitapride product was also moderately decayed by photolysis (9%). Conversely; acid, base and thermal degradation were mild (up to 5%). A study was conducted to estimate the content of omeprazole and conitapride simultaneously in pharmaceutical dosage form. Authors have reported the degradation of cinitapride when kept under various stressed conditions. Up to 5% of drug degradation was shown by thermal, oxidation, acid and alkali treatment (Nalini and Haribabu in 2015).
It was however observed that the production of various degradation moieties due to mentioned stresses did not cause any hindrance in the detection of cinitapride
hydrogen tartarate. Thus the developed method is considered to be a stability-indicating spectrophotometeric analytical method used for the assay of CHT in a bulk and solid pharmaceutical drug product.
CONCLUSION
A simple, precise and robust stability indicating analytical method using UV-spectrophotometric technique has been developed that fulfilled all the validation parameters as per ICH recommendations. The underlying procedure was found to be linear (r2>0.999), accurate and specific even
in presence of many common solid dosage formulations’ excipients. Oxidation was established to be a major degradation pathway for cinitapride hydrogen tartarate however; drug estimation was not influenced in presence of these forced degradation products. Hence the investigated technique would be successfully used to quantify the cinitapride hydrogen tartarate in pharmaceutical dosage and bulk form in future.
REFERENCES
Afieroho OE, Okorie O and Okonkwo TJ (2011). An ultraviolet-spectrophotometric method for the determination of glimepiride in solid dosage forms.
Diabetes Technol Ther., 13(6): 671-674.
Ahir KB, Solanki DN, Gandhi CB, Naik HS and Patel AS (2014). Analytical method development and validation for simultaneous estimation of cinitapride and pantoprazole in pharmaceutical dosage form. Der. Pharma Chemica., 6(2): 252-257.
Baqai MT, Malik MN and Ziauddin F (2013). Efficacy and safety of cinitapride in functional dyspepsia. J. Pak. Med. Assoc., 63(6): 747-751.
Basnet N, Humaira S and Sanaullah S (2014). Development and validation of colorimetric methods for the determination of cinitapride hydrogen tartarate in pure drug and its pharmaceutical formulations. Acta. Chim. Pharm. Indica, 4(2): 104-110.
Bhagavanji NVMS (2013). RP-HPLC method for simultaneous estimation of omeprazole and cinitapride in tablets. Int. Res. J. Pharm. App. Sci., 3(3): 7-12.
Du Y, Su T, Song X, Gao J, Zou D and Zuo C (2014). Efficacy and safety of cinitapride in the treatment of mild to moderate postprandial distress syndrome-predominant functional dyspepsia. J. Clin. Gastroenterol., 48(4): 328-335.
El-Kafrawy DS, Belal TS, Mahrous MS, Abdel-Khalek MM and Abo-Gharam AH (2017). Validated Spectrophotometric and RP-HPLC-DAD methods for the determination of Ursodeoxycholic Acid Based on Derivatization with 2-Nitrophenylhydrazine. J. AOAC Int., 100(3): 677-685.
Humaira S, Dey A, Raju SA and Sanaullah S (2011). Development and Validation of a Rapid RP HPLC Method for the Determination of Cinitapride Hydrogen
Tartarate in Solid Oral Dosage Forms. E-J. Chem.,
8(3): 1424-1429
ICH Q2 (R1) (2005). Validation of Analytical Procedures: Text and Methodology: ICH Steering Committee. Lahari K, Kumari KS, Meghana D and Prakash K (2012).
Development and Validation of RP-HPLC Method for Simultaneous Estimation of Rabeprazole and Cinitapride in Both Bulk and Solid Dosage Forms.
Pharm Analysis & Quality Assurance, 2(4): 1-4.
Marcelín-Jiménez G, Contreras L, Esquivel J, Ávila Ó, Batista D, Ángeles AP and García-González A (2017). Development of an UPLC-MS/MS micro-method for quantitation of cinitapride in plasma and its application in a pharmacokinetic interaction trial.
Bioanalysis, 9(6): 569-579
Martı́n G, Pérez CG and López MAB (1998). Polarographic determination of cisapride and cinitapride. Analytica. Chimica. Acta., 368(1-2):
175-181.
Nalini MVSS and Haribabu B (2015). Stability indicating RP-HPLC method for determination of omeprazole and cinitapride in combined pharmaceutical dosage form.
Rasayan. J. Chem., 8(4): 433-442.
Naz A, Ali H, Zafar F, Shah SN, Sharif H, Siddiqui S, Un-Nisa Z and Naqvi GR (2014). Development of Spectrophotometric Method for Dissolution and In Vitro Kinetic Study of Glimepiride Tablets. Lat. Am. J. Pharm., 33(9): 1418-1424.
Robert M, Salva M, Segarra R, Pavesi M, Esbri R, Roberts D and Golor G (2007). The Prokinetic Cinitapride Has No Clinically Relevant Pharmacokinetic Interaction and Effect on QT during Coadministration with Ketoconazole. Drug Metab Dispos.35(7):1149-1156.
Roy SMN, Mangaonkar KV, Desaiay and Yetal SM (2010). RP-HPLC Method for the Determination of Cinitapride in the Presence of its Degradation Products in Bulk Drug. E-J. Chem., 7(1): 311-319.
Roy SMN, YetalSM, Chavan SV, Pradhan VR and Joshi S (2008). Determination of Free Levels of Cinitipride in Human Plasma by Liquid Chromatography-Tandem Mass Spectrometry. E-J Chem., 5(3): 453-460.
Satyanarayana KVV and Rao NP (2013). Validated spectophotometric methods for the assay of cinitapride hydrogen tartrate in pharmaceuticals. Chem. Ind. Chem. Eng. Q., 19(2): 303-311.
Shah SA, Shah DR, Chauhan RS and Jain JR (2011). Development and validation of simultaneous spectro-photometric methods for drotaverine hydrochloride and aceclofenac from tablet dosage form. Indian J. Pharm. Sci., 73(3): 296-300.
Thangabalan B and Kumar PV (2012). Development and Validation of Spectrophotometric methods for the determination of Cinitapride in pure and in its pharmaceutical formulation. Asian J. Pharm. Clin. Res., 5(1):117-118.
Unnisa A, Chaithanya SK, Kumar SS, Babu YA and Kumar ST (2014). Extractive Spectrophotometric Method Development and Validation for the Estimation of Cinitapride Tartrate in Bulk and Pharmaceutical Formulations. Int. J. Pharm. Pharm. Sci., 6(4):
568-571.