Association for Information Systems
AIS Electronic Library (AISeL)
ICIS 2009 Proceedings
International Conference on Information Systems
(ICIS)
1-1-2009
Understanding IT Innovations Through
Computational Analysis of Discourse
Chia-jung Tsui
University of Maryland - College Park, [email protected]
Ping Wang
University of Maryland - College Park, [email protected]
Kenneth R. Fleischmann
University of Maryland - College Park, [email protected]
Douglas W. Oard
University of Maryland - College Park, [email protected]
Asad B. Sayeed
University of Maryland - College Park, [email protected]
This material is brought to you by the International Conference on Information Systems (ICIS) at AIS Electronic Library (AISeL). It has been accepted for inclusion in ICIS 2009 Proceedings by an authorized administrator of AIS Electronic Library (AISeL). For more information, please [email protected].
Recommended Citation
Tsui, Chia-jung; Wang, Ping; Fleischmann, Kenneth R.; Oard, Douglas W.; and Sayeed, Asad B., "Understanding IT Innovations Through Computational Analysis of Discourse" (2009).ICIS 2009 Proceedings.Paper 102.
C
OMPUTATIONAL
A
NALYSIS OF
D
ISCOURSE
Research-in-Progress
Chia-jung Tsui, Ping Wang, Kenneth R. Fleischmann,
Douglas W. Oard, and Asad B. Sayeed
University of Maryland
College Park, MD 20742
{ctsui, pwang, kfleisch, oard, asayeed}@umd.edu
Abstract
How do Information Technology (IT) innovation concepts emerge, coexist, evolve, and relate to each other? To address this question, we theorize that innovation concepts are interrelated in an idea network, where they can be likened to species in a competitive and symbiotic resource space. Communities of organizations and people interested in the innovations produce discourse that both reflects and enables the flows of attention among innovations. From this ecological perspective, we apply discourse analysis to innovation research and propose computational approach to scale up the analysis. Specifically, we employed Kullback-Leibler divergence to compare the linguistic patterns of 48 IT innovations reported in InformationWeek and Computerworld over a decade. Using multidimensional scaling, we found that similar innovations demonstrated similar discourses. The results demonstrate the validity, scalability, and utility of computational discourse analysis for practitioners and scholars to understand the socio-technical dynamics in the IT innovation ecosystem.
Keywords: Information technology innovation, innovation concept, discourse, computational
General Topics
Introduction
Oracle’s recent takeover of Sun Microsystems and HP’s acquisition of EDS earlier signifies an important industry trend: On the one hand, the current economic crisis and the relentless drive for growth pressure IT vendors to expand and diversify their offerings by mergers and acquisitions. On the other hand, enterprise customers increasingly prefer one-stop shopping of integrated information systems without the need for complicated plumbing in-house (The Economist 2009). Despite the trend toward consolidation and integration in the marketplace for IT products and services, the marketplace for ideas that underlie IT product and service innovations remain messy and fragmented (Lyytinen and King 2004; Pfeffer and Sutton 2006; Wang 2009). With minimal cost, anyone can enter the idea marketplace with a seemingly innovative concept. At any time, numerous IT concepts are competing for the already thin attention of practitioners and scholars. What the concepts mean and propose is often inconsistent and ambiguous. Thus far, research on IT innovations has primarily sought to understand the social and technical dynamics in the IT product/service marketplace (Fichman 2004). Our understanding of the idea marketplace for IT innovations is still inadequate as we face thorny questions of theoretical and practical significance.
On today’s scene of IT innovations, Web 2.0 and related concepts are in the process of yielding the limelight to Cloud Computing. As IT innovations ebb and flow constantly, what are the current innovation concepts in the marketplace and what is emerging? The ability to monitor existing and emerging innovations and to be mindful of their implications for specific organizations is a critical managerial capability (Swanson and Ramiller 2004). Along with the emergence of almost every new concept comes the question: Is this really new or just old wine in a new bottle? For example, is Cloud Computing a brand new idea or simply Utility Computing repackaged? Such sense-making is not only limited to the comparison of the new with the old, but also necessary for understanding the complex relationships among concepts coexisting in an idea network. For instance, what is the difference between Web Services and Software as a Service (SaaS)? What is the relationship between virtualization and Service-Oriented Architecture (SOA)? As innovation concepts progress through their differentiated trajectories, how do they evolve and what does their evolution mean to the organizations and people associated with these innovations? For instance, does the Customer Relationship Management (CRM) concept mean the same thing today that CRM meant a decade ago? Depending on the answer to this question, a vendor may choose to continue promoting its offerings under the CRM banner or switch to a new label or category that corresponds more with its current emphasis and customer preferences. As an innovation concept evolves, how does the community of people and organizations associated with the innovation evolve? For example, has the diverse community for Web 2.0 become fragmented or coherent in the current economic meltdown? Have the diverse opinions on Web 2.0 in the community been converging or diverging? What does the co-evolution of the innovation and its community imply for the fate of the innovation?
The lack of knowledge about how IT innovation concepts emerge, coexist, co-evolve, and relate to each other is in part caused by theoretical and methodological limitations. Theoretically, the focus of IT innovation research on the product/service form of innovations has thus far provided only a modest number of insights for understanding innovations as concepts. Methodologically, most innovation studies were designed to examine only one or a few innovations, owing to the difficulty in analyzing large-scale data on multiple innovations (Strang and Soule 1998). The present study seeks to address these limitations by offering (1) a theoretical foundation built upon an ecological view of innovations and (2) an analytical methodology enabled by computational analysis of discourse. In what follows, after laying the theoretical foundation, we illustrate our methodology with an empirical study of 48 IT innovations over a ten-year period. We conclude by discussing the utility of our approach for IT innovation research and practice.
An Ecological View of IT Innovation Concepts
Innovation concepts are related to one another in many ways. First, a broader concept may be comprised of narrower, more specific concepts. Second, different concepts may represent the same core idea. Third, concepts may compete with each other as alternative solutions to similar problems or for the attention from the same group of people or organizations. Finally, concepts may complement each other to accomplish common tasks. As innovations are interrelated, their evolutionary trajectories (as indicated by popularity or performance for instance) are interrelated too. It may be helpful to conceptualize a network of innovations as part of an ecological system, where innovations can be likened to species in a competitive and symbiotic resource space (Wang 2009; Whittaker
and Levin 1975). Innovations rely on the attention from communities of organizations and people with interests in producing and/or using the innovations. Each community emerges to make sense of an innovation and orchestrate material activities. The membership of the community evolves dynamically, as the collective attention to the innovation evolves. The flows of attention among innovations are both reflected and enabled by discourse – what have been said and written about the innovations. While the discourse about an innovation sometimes manifests human actions undertaken on behalf of the innovation, often the discourse itself is a form of human action, e.g., to make sense of, promote, or denounce the innovation (Phillips and Hardy 2002). Therefore, analysis of discourse about multiple innovations can help us understand the emergence and evolution of innovations and their relationships.
Methodology: Computational Analysis of Discourse
Discourse analysis of innovation concepts presently faces a methodological challenge: Discourse data are often voluminous and very labor-intensive to collect and analyze. Extant discourse studies of innovation concepts have to trade off between case studies using in-depth data and large-scale analysis using thin observations (e.g., citations). Recent advances in computational analysis of discourse have made it possible to achieve both depth and breadth in discourse analysis. Computational or automated analysis of discourse is a large, active interdisciplinary field with a variety of theories and techniques (see Oard 2008 for a non-technical primer). To demonstrate the utility of computational discourse analysis, we have chosen one technique suitable for our interest in the emergence, coexistence, co-evolution, and relationships of innovation concepts. This technique, called Kullback-Leibler (KL) divergence (Kullback and Leibler 1951), is essentially a measure that quantifies how close a probability distribution is to another distribution. For probability distributions P and Q of a discrete random variable, the KL divergence of Q from P is defined as DKL(P||Q) P i( ) log( ( ) /P i Q i( ))
i
∑
= . KL divergence is commonly used for comparing the relative frequency of term use in pairs of discourses (Manning and Schütze 1999). Before we detail our use of this technique in this illustrative empirical study, we need to describe the discourse data we have collected.
Data Collection
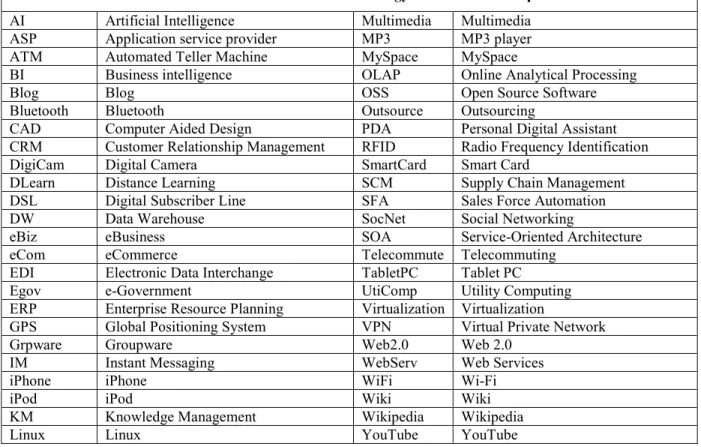
There are numerous discourse outlets, including books, magazines, conferences, blogs, wikis, and many others. Specifically, we downloaded all of the articles published during a ten-year period (1998-2007) in InformationWeek, an IT trade magazine, using the Lexis/Nexis online database. InformationWeek was used as an exemplar outlet of the IT innovation discourse. Meanwhile, we compiled a list of 48 IT innovation concepts (Table 1), ranging from enterprise software (e.g., CRM) to personal gadgets (e.g., iPod), from abstract concept (e.g., Artificial Intelligence) to concrete products/services (e.g., YouTube), and from highly popular (e.g., e-business) to less well-known concepts (e.g., digital subscriber line – DSL). This list illustrates a broad range of IT innovation concepts in the examination period. We then extracted from the InformationWeek articles all the paragraphs containing any of IT innovations on the list. In doing so, we considered possible labels for each innovation, plural forms, and acronyms unique to the innovation. For example, in extracting paragraphs containing “digital subscriber line,” we also included paragraphs mentioning “digital subscriber lines” and “DSL.” Some IT innovations had many paragraphs in the 10-year period while others have only a few. For example, there were more than 5,000 paragraphs mentioning Enterprise Resource Planning (ERP). In total, 71,113 paragraphs were extracted, with about 1,500 paragraphs on average for each innovation.
Data Analysis
In this dataset, each innovation is represented by the paragraphs mentioning the innovation. The use of language in the paragraphs constitutes a probability distribution over words and we calculated the KL divergence for each pair of innovations. The calculation generates an asymmetric 48x48 matrix with each column and row representing one of the 48 innovations. After symmetrization (by averaging the KL divergence in each direction), the value in each cell of the matrix can be considered as the distance between a pair of innovations.
In order to visualize the distance between innovations, we applied multidimensional scaling (MDS) to the symmetrized KL divergence matrix. MDS is a set of statistical techniques for information visualization. Based upon a matrix of item-item similarities or dissimilarities, an MDS algorithm assigns a location to each item in a
General Topics
space such that the distances between the items correspond as closely as possible to the measured dissimilarities between the items. In other words, the proximity of items to each other in the space indicates how similar they are. In MDS, one can choose the number of dimensions s/he wants the algorithm to create. Generally, the more dimensions, the better the statistical fit, but the more difficult it is to interpret the results.
Table 1. List of Information Technology Innovation Concepts
AI Artificial Intelligence Multimedia Multimedia ASP Application service provider MP3 MP3 player ATM Automated Teller Machine MySpace MySpace
BI Business intelligence OLAP Online Analytical Processing
Blog Blog OSS Open Source Software
Bluetooth Bluetooth Outsource Outsourcing
CAD Computer Aided Design PDA Personal Digital Assistant CRM Customer Relationship Management RFID Radio Frequency Identification DigiCam Digital Camera SmartCard Smart Card
DLearn Distance Learning SCM Supply Chain Management DSL Digital Subscriber Line SFA Sales Force Automation DW Data Warehouse SocNet Social Networking
eBiz eBusiness SOA Service-Oriented Architecture eCom eCommerce Telecommute Telecommuting
EDI Electronic Data Interchange TabletPC Tablet PC Egov e-Government UtiComp Utility Computing ERP Enterprise Resource Planning Virtualization Virtualization
GPS Global Positioning System VPN Virtual Private Network
Grpware Groupware Web2.0 Web 2.0
IM Instant Messaging WebServ Web Services
iPhone iPhone WiFi Wi-Fi
iPod iPod Wiki Wiki
KM Knowledge Management Wikipedia Wikipedia
Linux Linux YouTube YouTube
MDS is advantageous over other dimension-reduction techniques such as factor analysis because MDS can fit an appropriate model in fewer dimensions than other techniques (Wilkinson 1986). In addition, a matrix of symmetrized KL divergence measures is appropriate input for MDS but not for factor analysis. Further, MDS allows researchers to gain insights into the underlying structure of relations between items by providing a geometrical representation of the relations (Deun and Delbeke 2000). We used the MDS procedure in SPSS based on the ALSCAL or alternating least squares scaling (Takane et al. 1977), the most popular algorithm in MDS. For simplicity, we chose two dimensions and presented the 48 IT innovations in a two-dimensional scatter plot.
Results
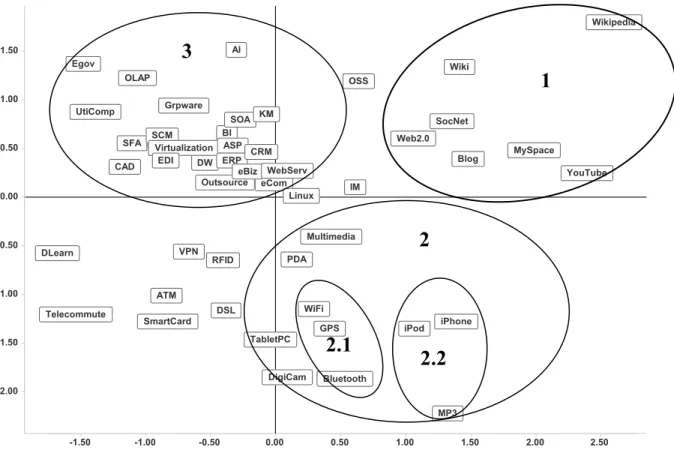
Figure 1 is the MDS plot of the 48 innovations, with an R-squared of 0.72, meaning that 72% of the variance of the scaled data can be accounted for by the MDS procedure. To interpret this plot, we followed Coxon (2006) and drew closed contours around the items that we consider closely related innovations based on the locations of the items and our own knowledge of the innovations. The areas so enclosed represent regions of relatively high density, and the extent of their dissociation is the distance in a MDS configuration (Coxon 2006). For illustration, in Figure 1 we have identified five groups, which we describe one by one below.
Group 1 includes Web 2.0, social networking, MySpace, blog, YouTube, wiki, and Wikipedia. Apparently, they seem to belong to the Web 2.0 family broadly defined. Hence we named this group Web 2.0. This group is close to Open Source Software (OSS). We suspect that some common attributes shared by OSS and Web 2.0 technologies, such as openness, freedom, and user participation, may explain the proximity.
Figure 1. MDS Plot of the 48 IT Innovations from 10-year InformationWeek Data
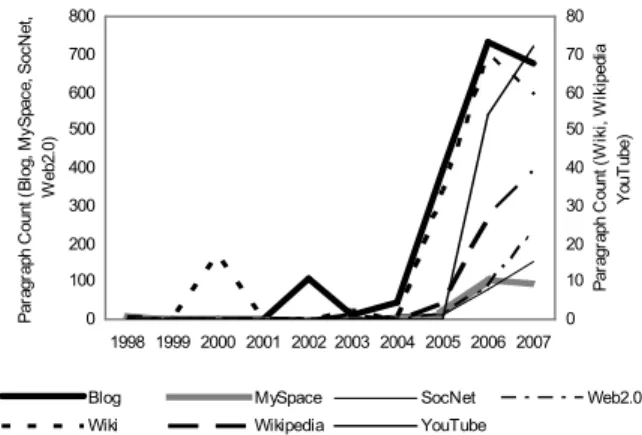
We counted the number of paragraphs each year containing the innovation concepts in Group 1 and Figure 2 shows the popularity curves of these innovations. The number of paragraphs about an innovation indicates the prevalence or popularity of the innovation in the discourse. Interestingly, concepts in this group followed similar patterns in popularity: Every concept had a significant surge around 2005 and 2006. This finding seems to suggest that items close to each other in a MDS plot tend to follow similar popularity patterns in the discourse.
Group 2 has ten innovations and two sub-groups (Subgroups 2.1 and 2.2.) are evident. Subgroup 2.1 includes Wi-Fi, Global Positioning System (GPS), and Bluetooth. Subgroup 2.2 includes iPod, iPhone, and MP3 player. Besides these subgroups, Group 2 also includes Personal Digital Assistant (PDA), multimedia, tablet PC, and digital camera. Subgroup 2.1 seems to represent the wireless technologies for mobile devices and Subgroup 2.2 is about mobile devices themselves. Intuitively, we named Group 2 mobile devices. The popularity curves for the innovations in Subgroup 2.1 are presented in Figure 3. Similar to the innovations in Group 1, the three innovations in Subgroup 2.1 had similar popularity patterns. However, the popularity curves for the innovations in Subgroup 2.2 shown in Figure 4 did not follow similar patterns. Rather, Figure 4 implies that iPhone might have superseded older technologies such as iPod and MP3 players, suggesting that new innovations may force old innovations out (Abrahamson and Fairchild 1999).
Group 3 is the largest group with 21 innovations in the upper-left quadrant of the plot (Figure 1). In general, they are enterprise IT innovations such as CRM, e-business, and ERP. The popularity curves for five innovations selected from Group 3 are presented in Figure 5. These innovations experienced their peaks around 1999 and 2000, and then their discourses dwindled.
-1.50 -1.00 -0.50 0.00 0.50 1.00 1.50 2.00 2.50 1.50 1.00 0.50 0.00 -0.50 -1.00 -1.50 -2.00 MySpace YouTube Blog SocNet Wiki iPod Bluetooth GPS WiFi DigiCam PDA Multimedia Outsource TabletPC VPN DSL RFID CAD DW Grpware OLAP UtiComp Egov AI BI OSS IM Wikipedia Web2.0 MP3 iPhone SmartCard ATM Telecommute DLearn SFA eCom Linux SOA KM SCM Virtualization EDI ASP ERP eBiz CRM WebServ
1
2
2.1
2.2
3
General Topics 0 100 200 300 400 500 600 700 800 1998 1999 2000 2001 2002 2003 2004 2005 2006 2007 P a ra g ra p h C o u n t (B lo g , M y S p a c e , S o c N e t, W e b 2 .0 ) 0 10 20 30 40 50 60 70 80 P a ra g ra p h C o u n t (W ik i, W ik ip e d ia , Y o u T u b e )
Blog MySpace SocNet Web2.0 Wiki Wikipedia YouTube
0 50 100 150 200 250 300 350 400 450 1998 1999 2000 2001 2002 2003 2004 2005 2006 2007 P a ra g ra p h C o u n t Bluetooth GPS WiFi
Figure 2. Popularity of Concepts in Group 1 Figure 3. Popularity of Concepts in Subgroup 2.1
0 50 100 150 200 250 300 350 1998 1999 2000 2001 2002 2003 2004 2005 2006 2007 P a ra g ra p h C o u n t iPhone iPod MP3 0 500 1000 1500 2000 2500 3000 1998 1999 2000 2001 2002 2003 2004 2005 2006 2007 P a ra g ra p h C o u n t ASP CRM eBiz eCom ERP
Figure 4. Popularity of Concepts in Subgroup 2.2 Figure 5. Popularity of Concepts in Group 3
Discussion
Validity and Advantages of the Computational Discourse Analysis
The results from the KL-divergence and MDS analysis apparently demonstrate that innovations with similar contents and/or intrinsic relationships are closely located in the two-dimensional spatial representation of the discourse. While this finding is unsurprising to anyone with at least basic familiarity with the innovations, the results provide reasonable confidence in the internal validity of the study’s computational approach to discourse analysis. To further strengthen such confidence, we collected all the articles published in Computerworld, another IT trade magazine, in the same ten-year period and performed the same analysis. The MDS plot based on the
Computerworld data turned out to have a different orientation – innovations in Groups 1 and 2 appeared in the left side of the chart and Group 3 appeared on the right. The orientation of the configuration of points in a MDS plot is often arbitrary regarding the coordinate axes and thus the plot is free to rotate or flip (Shepard et al. 1972). Except the different orientations of the axes, the MDS plots based on the two datasets are very similar to each other. This additional analysis suggests reasonable external validity of the “KL-divergence plus MDS” analytical approach. In addition to internal and external validity, this approach has several advantages. Foremost, computational analysis is scalable. The study has examined the discourse on 48 innovations in ten years, already surpassing the scale and scope of many innovation studies. While we have used just two trade magazines for this illustration, the capability of this approach is not limited to the number or type of discourse outlets. Further, although our own knowledge
helped validate the methods in the illustration study, the methods themselves do not rely on expert knowledge. This feature differentiates our approach from other classification methods based on expert ratings or opinions (e.g., Ein-Dor and Segev 1993; Swanson and Ramiller 1993). Expert knowledge can be useful for specific research objectives, but methods relying on experts are not scalable. Moreover, unlike scalable analysis that relies on relatively thin observations, such as citations (e.g., Bettencourta et al. 2006) or vocabulary (e.g., Abrahamson and Eisenman 2008), the KL divergence measure captures both the vocabulary and the rich context of the vocabulary use in the discourse. Overall, these advantages create a middle ground where both breadth and depth can be achieved in discourse analysis.
Implications for IT Innovation Research and Practice
The ecological view of IT innovations and the computational discourse analysis are useful for both scholars and practitioners to understand the emergence, co-existence, relationship, and evolution of innovations. We explain the implications below, revisiting the series of questions we raised in the Introduction.
Understanding Emergence
We applied our knowledge of existing IT innovations to validate the computational approach in the illustrative empirical study. When such knowledge does not exist, as in the case of emerging innovations, the same analysis can be applied to the discourse about new innovations, and to the discourse about existing innovations as well. An innovation’s location in the MDS plot may indicate its broad type and its proximity to existing concepts within the same type may indicate novelty. In assessing the newness of Cloud Computing, for example, it would be useful to check its location in reference to those of other innovations such as Utility Computing and Web Services.
Understanding Coexistence and Relationship
With regard to the complex relationships among existing innovations, the MDS plot based on KL divergence can help visualize broad categories. For example, in Figure 1, Group 2 is about mobile devices while Subgroup 2.1 is about wireless technologies. The hierarchical relationship illustrated by Group 2 and Subgroup 2.1 suggests that mobile devices are enabled by wireless technologies. However, the MDS plot on its own cannot fully explain the relationships among innovations. As we have seen, the popularity curves of closely located innovations may follow similar patterns (e.g., Figures 2 and 5) or they may significantly differ, suggesting substitution (e.g., Figure 4) or competition. Therefore, we suggest combining the use of MDS plot based on KL divergence with time series analysis of the popularity of innovations. This combined approach could be used to detect the complementary and/or competitive relationships among coexisting innovations.
Understanding Evolution and Co-Evolution
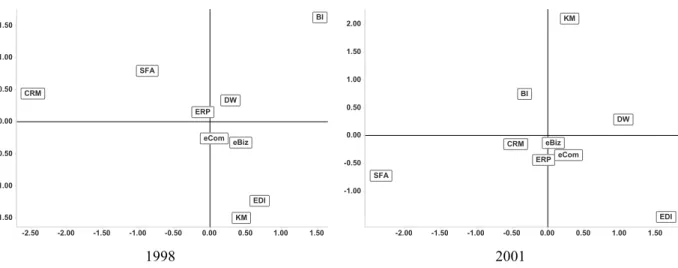
Over time, the meaning of an IT innovation concept may change and the relationships among innovations may also change. For example, in the early 1990s, CRM was initially conceptualized as an automation tool for improving the efficiency of an organization’s sales people, then as a backbone technology for enhancing the effectiveness of customer services, and more recently as a marketing innovation for business intelligence (BI) gathering. Consistent with this story, Figure 6 shows that CRM had moved away from Sales Force Automation (SFA) by 1998 and moved closer to BI in 2001. Organizations and people in innovation communities are sensitive to these changes. For example, the statistics software company SAS strategically moved away from the CRM label for its software products to the embrace the BI label around 2002 (Wang and Swanson 2008). To study the evolution of a single innovation, older discourse and newer discourse about the same innovation can be analyzed and positioned in the same MDS plot, revealing the evolutionary trajectory. Regarding the co-evolution of innovations and communities, it would be useful to analyze the discourses of different members in a community (vendor discourse on CRM vs. academic discourse on CRM) and compare the locations of the members in MDS plots, discovering the leading, following, converging, or diverging opinions about the innovation (Barley et al. 1988).
General Topics
1998 2001
Figure 6. The Evolution of CRM
Next Steps
As part of this study, we are taking three steps to do more in-depth analysis of the InformationWeek and
Computerworld data. First, we are applying hierarchical clustering analysis to KL divergence matrixes. Clustering analysis will help us not only group the innovations systematically, but also discover the hierarchical structure of innovations at finer-grain levels, possibly detecting commonalities and distinctions among different types of innovations such as process vs. product innovations, management-focused vs. technology-focused innovations, and product vs. service innovations. Second, in addition to the IT innovations, we plan to add to the analysis keywords that represent main discursive themes such as customer, automation, end-user, and optimization. We will assess the extent to which IT innovations cluster around these keywords in MDS plots in order to further understand the multi-dimensional innovation ecosystem. Third, we plan to expand from our preliminary analysis of the evolution of CRM and related innovations to a longitudinal analysis of all innovations in our data. We will slice the data by year and perform the same analysis on each year's data. This longitudinal analysis will likely reveal the dynamic evolution of innovations and their ecosystem.
Going beyond this study, we are expanding the InformationWeek and Computerworld data from 10 years to 20 years so that we can study the evolution of more innovations over a longer period of time. This larger dataset will allow us to investigate further the complex relationships among innovations and fine-tune our methods to tease out competition, complementation, substitution, and hierarchy. In addition, recognizing that the two trade magazines only represent a small portion of the larger discourse in the innovation ecosystem, we will collect data from other types of discourse outlets such as academic journals, blogs, and wikis. We plan to assess the robustness of our approach and look forward to discovering interesting differences and qualifications. Data from multiple sources will allow us to construct a more realistic representation of the innovation network and communities. Finally, because positive and negative discourses may have differentiated influences on popularity (Wang 2009), we plan to enhance our present computational discourse approach with sentiment analysis. Such longer examination periods, larger and broader datasets, and richer analysis will likely sustain our continued research program on the IT innovation ecosystem.
Conclusion
In conclusion, the ecological view of IT innovation concepts and the scalable computational discourse analysis presented here provide the theoretical foundation and methodology for scholars and practitioners to monitor and make sense of IT innovations in the idea marketplace. The prosperity and efficiency of that marketplace depend on the knowledge about how IT innovations and communities emerge, coexist, and evolve in a dynamic social-technical ecosystem. This study and our broader research program will contribute such crucial knowledge.
-2.00 -1.50 -1.00 -0.50 0.00 0.50 1.00 1.50 2.00 1.50 1.00 0.50 0.00 -0.50 -1.00 KM BI CRM SFA eBiz eCom ERP DW EDI -2.50 -2.00 -1.50 -1.00 -0.50 0.00 0.50 1.00 1.50 1.50 1.00 0.50 0.00 -0.50 -1.00 -1.50 BI KM EDI eBiz eCom ERP DW SFA CRM
Acknowledgements
This paper is based upon work supported by the National Science Foundation under Grants No. IIS-0729459 and SBE-0915645. We would like to thank Lidan Wang for her suggestion to use symmetrized KL divergence.
References
Abrahamson, E., and Eisenman, M. 2008. "Employee-Management Techniques: Transient Fads or Trending Fashions?" Administrative Science Quarterly (53:4), pp. 719-744.
Abrahamson, E., and Fairchild, G. 1999. "Management Fashion: Lifecycles, Triggers, and Collective Learning Processes," Administrative Science Quarterly (44:4), pp. 708-740.
Barley, S.R., Meyer, G.W., and Gash, D.C. 1988. "Cultures of Culture: Academics, Practitioners and the Pragmatics of Normative Control," Administrative Science Quarterly (33:1), pp. 24-60.
Bettencourta, L.M.A., Cintron-Arias, A., Kaiser, D.I., and Castillo-Chavez. 2006. "The Power of a Good Idea: Quantitative Modeling of the Spread of Ideas from Epidemiological Models," Physica A (364:2006), pp. 513-536.
Coxon, T. 2006. "Interpreting Configurations," in: The User's Guide to Multidimensional Scaling. pp. 93-116. Deun, K.V., and Delbeke, L. 2000. "Multidimensional Scaling." Open and Distance Learning, retrieved April 15,
2009, from http://www.mathpsyc.uni-bonn.de/doc/delbeke/delbeke.htm.
The Economist, 2009. "Mr Ellison Helps Himself," April 25-May 1, pp. 65-66.
Ein-Dor, P., and Segev, E. 1993. "A Classification of Information Systems: Analysis and Interpretation,"
Information Systems Research (4:2), pp. 166-204.
Fichman, R.G. 2004. "Going Beyond the Dominant Paradigm for Information Technology Innovation Research: Emerging Concepts and Methods," Journal of the Association for Information Systems (5:8), pp. 314-355. Kullback, S., and Leibler, R.A. 1951. "On Information and Sufficiency," The Annals of Mathematical Statistics
(22:1), pp. 79-86.
Lyytinen, K., and King, J.L. 2004. "Nothing at the Center?: Academic Legitimacy in the Information Systems Field," Journal of the Association for Information Systems (5:6), pp. 220-246.
Manning, C., and Schütze, H. 1999. Foundations of Statistical Natural Language Processing. Cambridge, MA: MIT Press.
Oard, D.W. 2008. "Whirlwind Tour of Automated Language Processing for the Humanities and Social Sciences,"
Symposium on Promoting Digital Scholarship: Formulating Research Challenges in the Humanities, Social Sciences and Computation, Washington DC, pp. 34-42.
Pfeffer, J., and Sutton, R.I. 2006. Hard Facts, Dangerous Half-Truths, & Total Nonsense: Profiting from Evidence-Based Management. Boston, MA: Harvard Business School Press.
Phillips, N., and Hardy, C. 2002. Discourse Analysis: Investigating Processes of Social Construction. Thousand Oaks CA: Sage Publications.
Shepard, R.N., Romney, A.K., and Nerlove, S.B. 1972. Multidimensional Scaling; Theory and Applications in the Behavioral Sciences. New York: Seminar Press.
Strang, D., and Soule, S.A. 1998. "Diffusion in Organizations and Social Movements: From Hybrid Corn to Poison Pills," in: Annual Review of Sociology, J. Hagan and K.S. Cook (eds.). Palo Alto, CA: Annual Reviews, pp. 265-290.
Swanson, E.B., and Ramiller, N.C. 1993. "Information Systems Research Thematics: Submissions to a New Journal, 1987-1992," Information Systems Research (4:4), pp. 299-330.
Swanson, E.B., and Ramiller, N.C. 2004. "Innovating Mindfully with Information Technology," MIS Quarterly
(28:4), pp. 553-583.
Takane, Y., Young, F.W., and de Leeuw, J. 1977. "Nonmetric Individual Differences Multidimensional Scaling: An Alternating Least Squares Method with Optimal Scaling Features," Psychometrika (42:1), pp. 7-67.
Wang, P. 2009. "Popular Concepts Beyond Organizations: Exploring New Dimensions of Information Technology Innovations," Journal of the Association for Information Systems (10:1), pp. 1-30.
Wang, P., and Swanson, E.B. 2008. "Customer Relationship Management as Advertised: Exploiting and Sustaining Technological Momentum," Information Technology and People (21:4), pp. 323-349.
Whittaker, R.H., and Levin, S.A. 1975. Niche: Theory and Application. Stroudsburg, PA: Downden, Hutchinson & Ross, Inc.